Q.1.
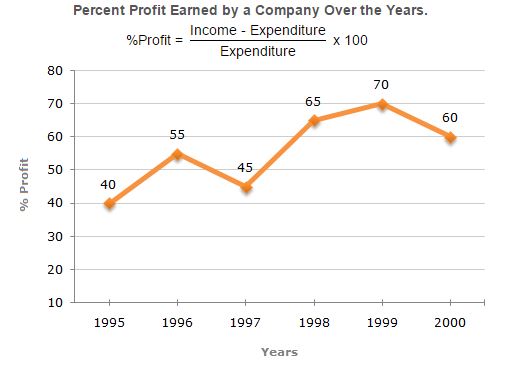
If the profit in 1999 was Rs. 4 crores, what was the profit in 2000?
-
0%
Rs. 4.2 crores
-
0%
Rs. 6.6 crores
-
0%
Rs. 6.8 crores
-
0%
Cannot be determined
Q.2.
The number of observations taken in an experiment determines :
-
0%
the number of columns in a table
-
0%
the number of rows in a table
-
0%
the number of data in a table
-
0%
All of the above
Q.3.
Identify the correct statement.
-
0%
Graphical presentation of data is the basis for tabular representation.
-
0%
Tabular presentation of data is the same as graphical representation.
-
0%
Tabular presentation of data is the basis for graphical representation.
-
0%
None of the above
Q.4.
To attain speed and ease of interpretation of a table, data presentation should be tabulated by efficiently manipulating:
-
0%
contrast
-
0%
alignment
-
0%
spacing
-
0%
ordering
Q.5.
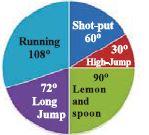
In which game, least number of students took part?
-
0%
High jump
-
0%
Running
-
0%
Long jump
-
0%
Lemon and spoon
Q.6.
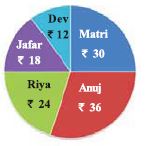
How much contribution was given by Jafar?
-
0%
$$10\%$$
-
0%
$$15\%$$
-
0%
$$18\%$$
-
0%
$$20\%$$
Q.7.
The data for test scores out of $$5$$ for $$10$$ students is given below:
$$3,4,1,3,5,2,4,1,3,2$$
Tabulate the given data and answer the questions.
How many students scored $$4$$ or more than $$4$$?
$$3,4,1,3,5,2,4,1,3,2$$
Tabulate the given data and answer the questions.
How many students scored $$4$$ or more than $$4$$?
-
0%
$$1$$
-
0%
$$2$$
-
0%
$$3$$
-
0%
$$4$$
Q.8.
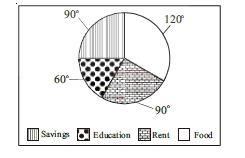
If the monthly income of the family is Rs 9000, what is the expenditure on rent?
-
0%
Rs 2250
-
0%
Rs 2000
-
0%
Rs2050
-
0%
Rs 2500
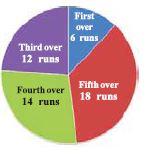
Q.9.
In which over maximum runs were scored?
-
0%
First over
-
0%
Third over
-
0%
Fourth over
-
0%
Fifth over
Q.10.
Who contributed the least fund?
-
0%
Jafar
-
0%
Dev
-
0%
Riya
-
0%
Matri
Q.11.
| Person | $$A$$ | $$B$$ | $$C$$ | $$D$$ | $$E$$ |
| Profeesion | Hort. | Indust. | Phys. | Journa. | Advocate |
| Choice | Tea | Coffee | Tea | Coffee | Tea |
-
0%
$$ACE$$
-
0%
$$DE$$
-
0%
$$BCE$$
-
0%
None of these
Q.12.
How many runs were scored in the third over?
-
0%
$$18\%$$
-
0%
$$20\%$$
-
0%
$$24\%$$
-
0%
$$2\%$$
Q.13.
The total agricultural land in a village is $$1200$$ hectares. This is distributed among $$320$$ families who form four groups in the following pattern. It is assumed that the land is distributed equally within each group. Identify the group of small farmers
| Group | Number of families | Total amount of land owned and operated by each group (in hectares) |
| A | 100 | 300 |
| B | 180 | 300 |
| C | 30 | 300 |
| D | 10 | 300 |
-
0%
A
-
0%
B
-
0%
C
-
0%
D
Q.14.
| Person | $$A$$ | $$B$$ | $$C$$ | $$D$$ | $$E$$ |
| Profeesion | Hort. | Indust. | Phys. | Journa. | Advocate |
| Choice | Tea | Coffee | Tea | Coffee | Tea |
-
0%
$$E$$
-
0%
$$C$$
-
0%
$$B$$
-
0%
$$A$$
Q.15.
In which over, not a single run was scored?
-
0%
First over
-
0%
Second over
-
0%
Fourth over
-
0%
Fifth over
Q.16.
How many students took part in lemon and spoon race?
-
0%
$$10$$ students
-
0%
$$12$$ students
-
0%
$$15$$ students
-
0%
none
Q.17.
| Person | $$A$$ | $$B$$ | $$C$$ | $$D$$ | $$E$$ |
| Profeesion | Hort. | Indust. | Phys. | Journa. | Advocate |
| Choice | Tea | Coffee | Tea | Coffee | Tea |
-
0%
$$A$$
-
0%
$$B$$
-
0%
$$C$$
-
0%
$$D$$
Q.18.
In which game, maximum number of students took part?
-
0%
Running
-
0%
Shot-put
-
0%
Long Jump
-
0%
None of these
Q.19.
Weighted averages are considered when __________________.
-
0%
the data are not classified
-
0%
the data are put in the form of grouped frequency distribution
-
0%
all the observations are not equal importance
-
0%
Both (A) and (C)
Q.20.
_______ bar diagrams are used for comparing two or more sets of data.
-
0%
Simple
-
0%
Component
-
0%
Multiple
-
0%
All of the above
Q.21.
Fill the Alternative given in the bracket:
___________ represent two or more sets of interrelated data.
___________ represent two or more sets of interrelated data.
-
0%
simple tables
-
0%
simple bar diagram
-
0%
multiple bar diagram
-
0%
component bar diagram
Q.22.
What is the objective and significance of statistical averages?
-
0%
To present huge mass of data in a summarized form
-
0%
To facilitate comparison of different sets of data
-
0%
To help in decision making
-
0%
All of above
Q.23.
The given pictograph shows the number of students of class V participated in different games at Annual Diwali Mela.
How many students took part in the game of ring the bottle?
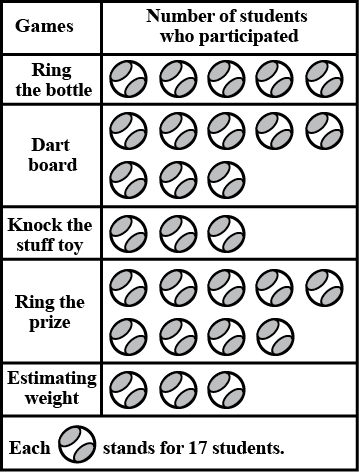
How many students took part in the game of ring the bottle?
-
0%
$$5$$
-
0%
$$17$$
-
0%
$$85$$
-
0%
$$90$$
Q.24.
'More than' ogive is ________.
-
0%
An ascending curve
-
0%
A descending curve
-
0%
First ascending curve and then descending curve
-
0%
First descending curve and then ascending curve
Q.25.
From the table, answer the following question.
The percentage of decrease in speed during $$19.00$$ hrs and $$21.00$$ hrs is ____________.
The percentage of decrease in speed during $$19.00$$ hrs and $$21.00$$ hrs is ____________.
| Time(in hrs) | $$5$$ | $$7$$ | $$9$$ | $$11$$ | $$13$$ | $$17$$ | $$15$$ | $$19$$ | $$21$$ |
| Speed (in km/hour) | $$40$$ | $$50$$ | $$60$$ | $$80$$ | $$70$$ | $$65$$ | $$75$$ | $$60$$ | $$50$$ |
-
0%
$$\displaystyle 16\frac{1}{3}\%$$
-
0%
$$\displaystyle 16\frac{2}{3}\%$$
-
0%
$$\displaystyle 17\frac{2}{3}\%$$
-
0%
$$\displaystyle 18\frac{2}{3}\%$$
Q.26.
Fill the Alternative given in the bracket:
__________ represent 2 or more sets of interrelated data.
__________ represent 2 or more sets of interrelated data.
-
0%
Simple bar diagram
-
0%
Multiple bar diagram
-
0%
Sub - divided bar diagram
-
0%
Percentage bar diagram
Q.27.
The given pictograph shows the number of students of class V participated in different games at Annual Diwali Mela. How many more students participated in ring the prize than in estimating weight and knock the stuff toy altogether?

-
0%
$$51$$
-
0%
$$96$$
-
0%
$$42$$
-
0%
$$83$$
Q.28.
Pictograms are _______.
-
0%
least accurate
-
0%
very accurate
-
0%
mostly used
-
0%
scientifically correct
Q.29.
In a bar diagram, the base line is __________.
-
0%
horizontal
-
0%
vertical
-
0%
false base line
-
0%
any of the above
Q.30.
Choose the correct answer from the alternatives given.
What is the budget estimated by the family on clothing and grocery together?
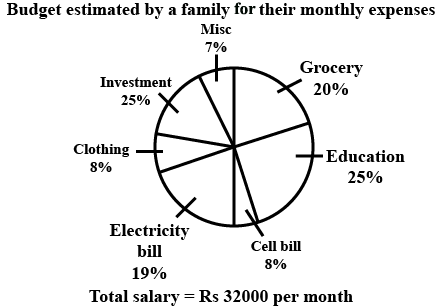
What is the budget estimated by the family on clothing and grocery together?
-
0%
Rs. $$8850$$
-
0%
Rs. $$8690$$
-
0%
Rs. $$8780$$
-
0%
Rs. $$8960$$