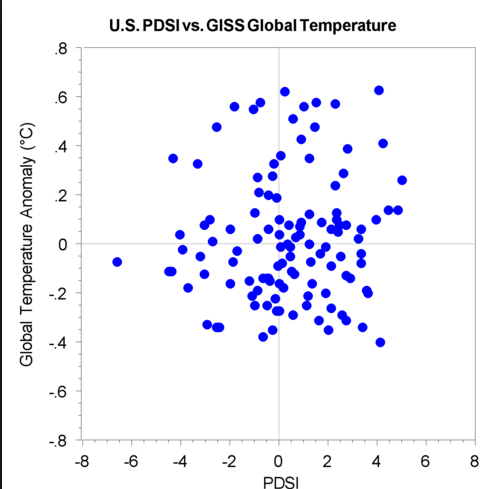
Q.1.
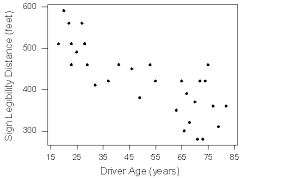
What type of association does this graph have?
-
0%
positive
-
0%
negative
-
0%
none
-
0%
all of the above
Q.2.
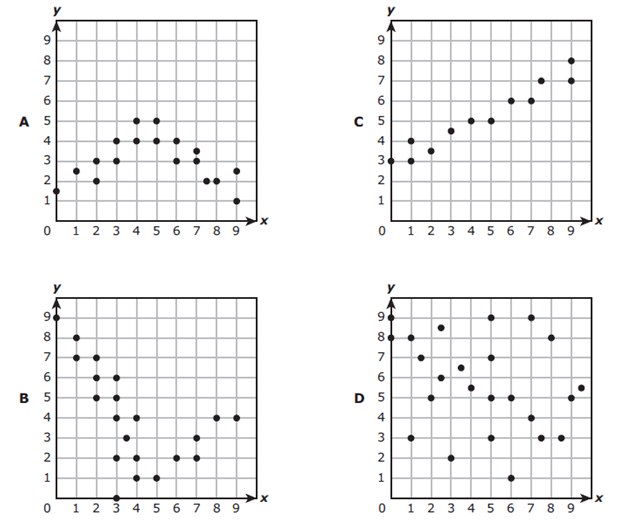
Which scatter plot shows a linear relationship between x and y?
-
0%
Graph A
-
0%
Graph B
-
0%
Graph C
-
0%
Graph D
Q.3.
What is the type of association?
-
0%
Negative
-
0%
no association
-
0%
positive
Q.4.
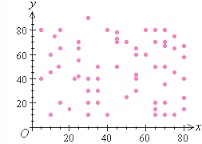
What type of association does this graph have?

-
0%
positive
-
0%
negative
-
0%
none
-
0%
all of the above
Q.5.
What type of association does this graph show?

-
0%
Positive
-
0%
negative
-
0%
none
-
0%
all of the above
Q.6.
What type of association does this scatter plot show?
-
0%
positive linear association
-
0%
negative linear association
-
0%
no association
-
0%
nonlinear association
Q.7.
What type of association (correlation) does this graph have?

-
0%
positive
-
0%
negative
-
0%
none
-
0%
all of the above
Q.8.
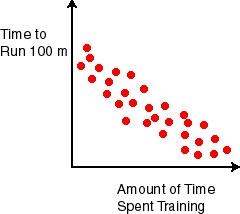
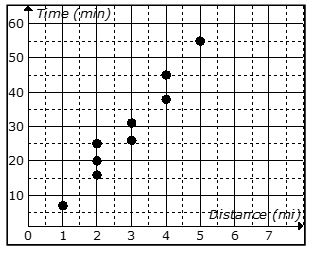
Which sentence describes the relationship shown on this scatter plot?

-
0%
The more time spent training, the longer it takes to run 100 m.
-
0%
As the time spent training increases, the time to run 100 m decreases.
-
0%
As the time spent training decreases, the time to run 100 m decreases.
Q.9.
What type of association does this scatter plot represent?
-
0%
positive linear association
-
0%
negative linear association
-
0%
no association
-
0%
nonlinear association
Q.10.
Which scatter plot shows a linear relationship between x and y?

-
0%
Graph A
-
0%
Graph B
-
0%
Graph C
-
0%
Graph D
Q.11.
What is shown here? (click to remove words)
-
0%
trend line
-
0%
linear regression
-
0%
no correlation
-
0%
positive correlation
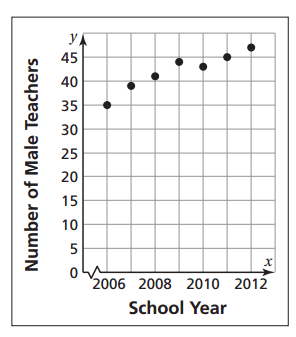
Q.12.
About how many male math teachers were there in 2006?
-
0%
15
-
0%
30
-
0%
35
-
0%
45
Q.13.
What type of correlation?The temperature outside and the amount of ice cream sales.
-
0%
Positive correlation
-
0%
Negative correlation
-
0%
No correlation
Q.14.
The following scatter plot shows Pam's training as she prepares to run a 6 mile race at the end of the month. Which of the following would be a reasonable approximation for the length of time it would take for her to run 6 miles?
-
0%
A. 50 min
-
0%
B. 80 min
-
0%
C. 45 min
-
0%
D. 60 min
Q.15.
What type of association does this graph show?
-
0%
Positive
-
0%
negative
-
0%
none
-
0%
all of the above
Q.16.
What type of association does this graph have?
-
0%
positive
-
0%
negative
-
0%
none
-
0%
all of the above
Q.17.
Describe the association of the scatter plot.
-
0%
Linear; positive association
-
0%
Linear; negative association
-
0%
Non-linear
Q.18.
If Gold's Gym paid $250 for each TV, how many did they buy?
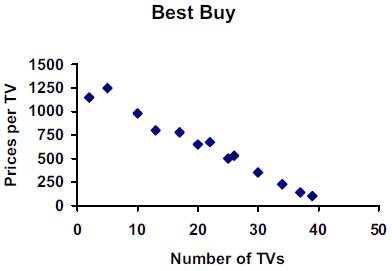
-
0%
35
-
0%
30
-
0%
45
-
0%
20
Q.19.
What type of correlation does this graph have?

-
0%
positive
-
0%
negative
-
0%
none
-
0%
all of the above
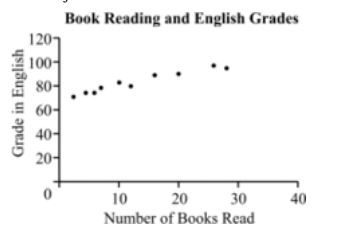
Q.20.
The scatter plot below shows the number of books read by students in Mrs. Hall’s English class and their final grades. Which statement represents the best description about the line of best fit?
-
0%
The more books students read, the lower their English grade.
-
0%
The more books students read, the higher their English grade.
-
0%
The fewer books students read, the higher their English grade.
-
0%
No relationship exists between the number of books students read and their English grades.