Statistics - Class 10 Maths - Extra Questions
For a certain frequency distribution, if median $$= 156$$ and mode $$= 180$$, then obtain the value of mean
Find the mean of the data whose median is $$64$$ and mode is $$45$$.
The demand of different shirt sizes, as obtained by a survey, is given. Calculate the Mode.
| Size | $$38$$ | $$39$$ | $$40$$ | $$41$$ | $$42$$ | $$43$$ | $$44$$ |
| Number of persons(wearing it) | $$27$$ | $$40$$ | $$51$$ | $$16$$ | $$14$$ | $$8$$ | $$6$$ |
Find the mode for the following table.
| Temperature in $$^oC$$ | $$29$$ | $$32.4$$ | $$34.6$$ | $$36.9$$ | $$38.7$$ | $$40$$ |
| Number of days | $$7$$ | $$2$$ | $$6$$ | $$4$$ | $$8$$ | $$3$$ |
Find the mode for the following frequency table.
| Wages(Rs.) | $$250$$ | $$300$$ | $$350$$ | $$400$$ | $$450$$ | $$500$$ |
| Number of workers | $$10$$ | $$15$$ | $$16$$ | $$12$$ | $$11$$ | $$13$$ |
The Mean and Median of a Uni-modal grouped data are $$36.5$$ and $$38.5$$ respectively. Find the Mode of the data.
Four integers are added to a group of integers $$3, 4, 5, 5$$ and $$8$$ and the mean, median, and mode of the data increases by $$1$$ each. What is the greatest integer in the new group of integers?
Observations of a data are $$16, 72, 0, 55, 65, 55, 10,$$ and $$41$$. Chaitanya calculated the mode and median without taking the zero into consideration. Did Chaitanya do the right thing?
If the mean of the following distribution be $$50$$, then find the values of $${ f }_{ 1 }$$ and $${ f }_{ 2 }$$.
| Class | 0-20 | 20-40 | 40-60 | 60-80 | 80-100 | Total |
| Frequency | 17 | 28 | $${ f }_{ 1 }$$ | 24 | $${ f }_{ 2 }$$ | 120 |
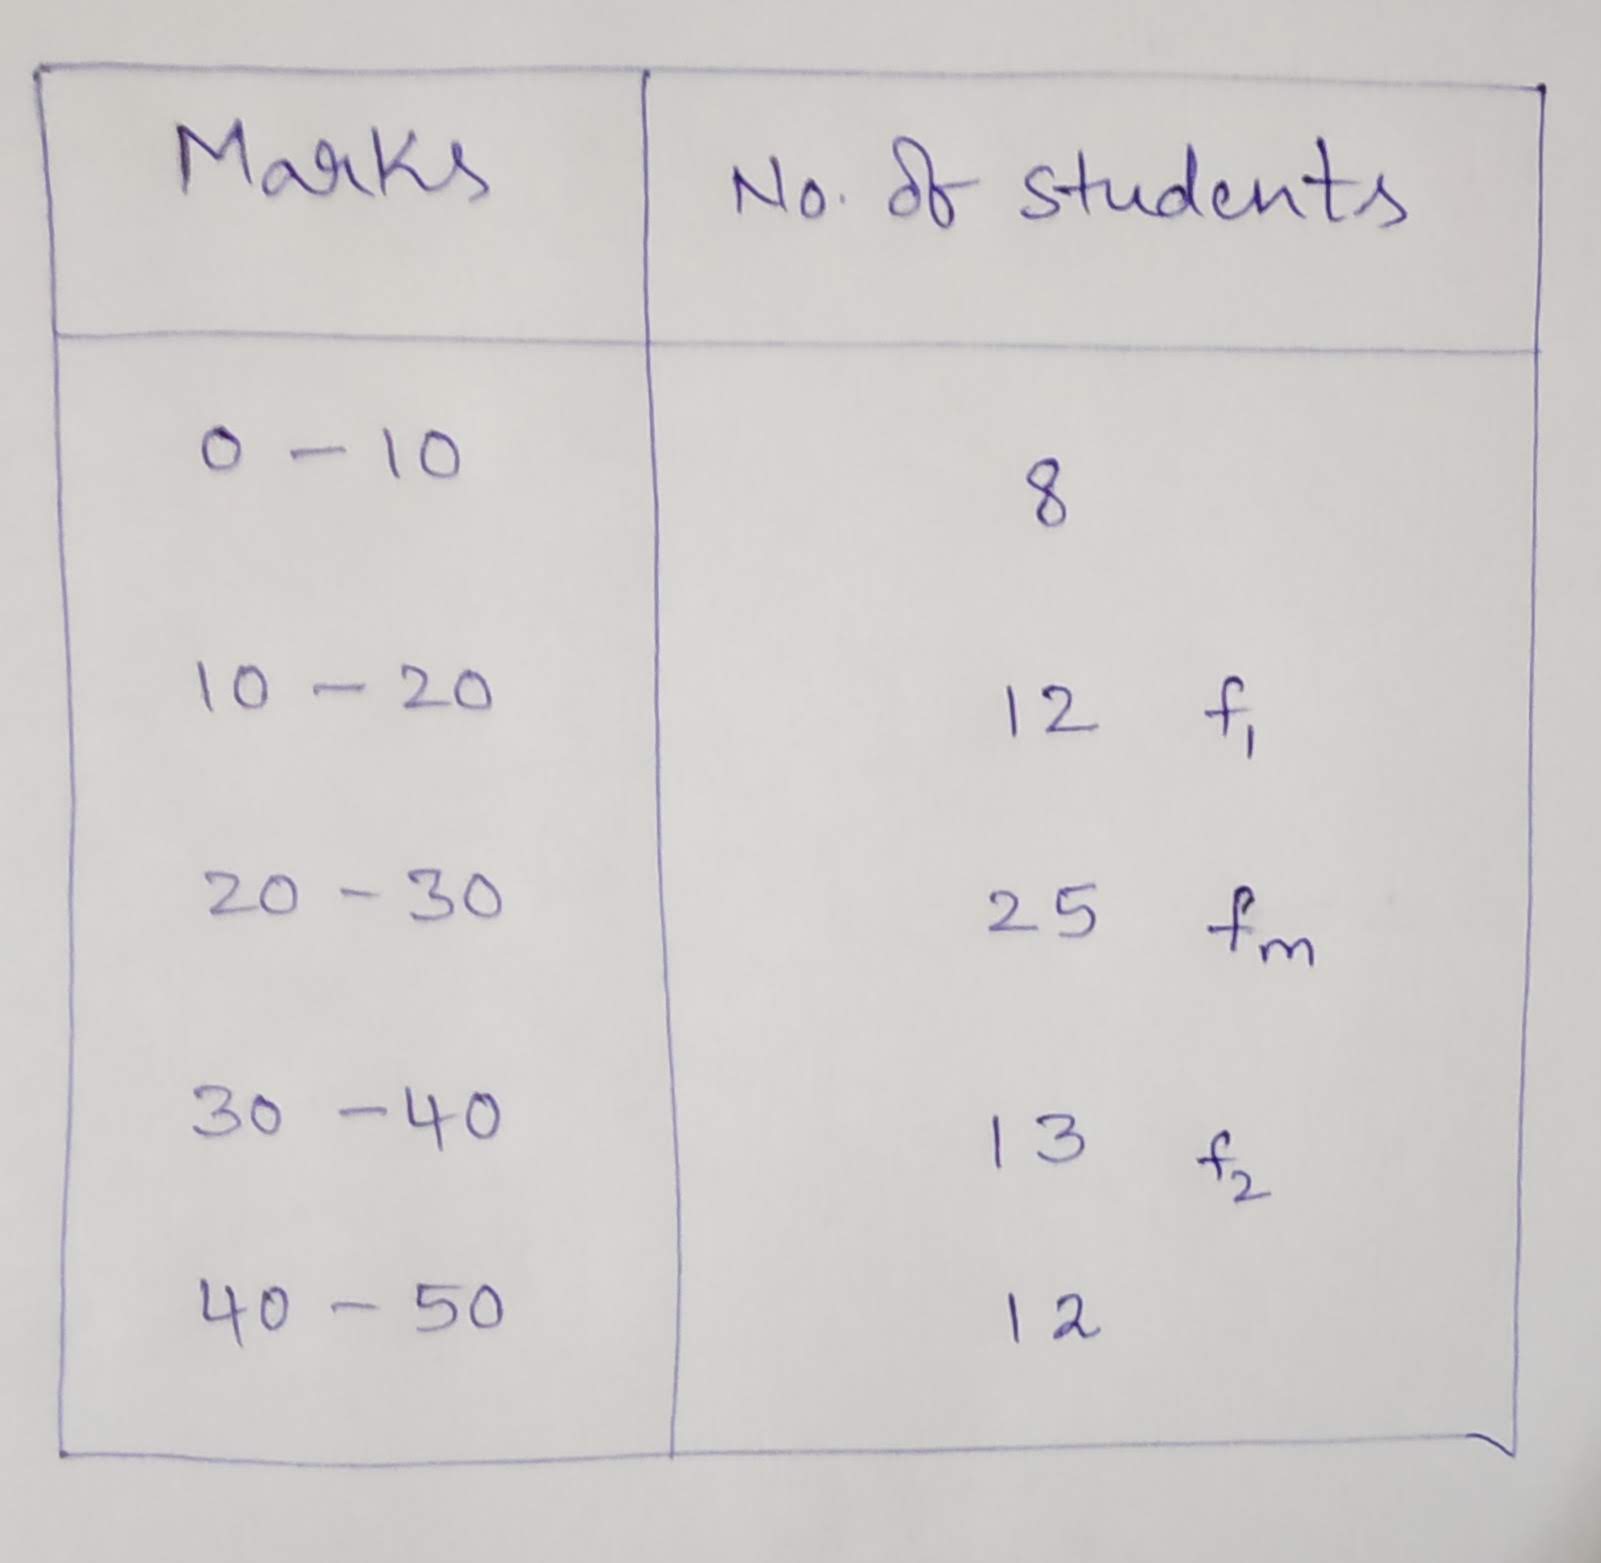
Find the mode of the following data:
| Marks | Below 10 | Below 20 | Below 30 | Below 40 | Below 50 |
| No. of students | 8 | 20 | 45 | 58 | 70 |
Answer the following :
The median of 230 observation isFind a and b.
| Class | 10-20 | 20-30 | 30-40 | 40-50 | 50-60 | 60-70 | 80-90 |
| Frequency | 12 | 30 | a | 65 | b | 25 | 18 |
Find the mode for the following frequency distribution.
| Class | $$0-100$$ | $$100-200$$ | $$200-300$$ | $$300-400$$ | $$400-500$$ | $$500-600$$ |
| Frequency | $$64$$ | $$62$$ | $$77$$ | $$62$$ | $$66$$ | $$54$$ |
Find the mode of the following frequency distribution.
| Age (years) | 14 | 13 | 12 | 15 | 10 |
| Numbers of students | 4 | 8 | 7 | 2 | 9 |
| Shirt size(cm) | 38 | 36 | 40 | 42 | 44 | 37 | 34 | 41 |
| Numbers of students | 7 | 12 | 18 | 6 | 2 | 14 | 3 | 8 |
Find the median of the following data.
| $$x$$ | $$10$$ | $$20$$ | $$30$$ | $$40$$ | $$50$$ |
| $$f$$ | $$2$$ | $$3$$ | $$2$$ | $$3$$ | $$1$$ |
The distribution of sale of shirts sold in a month in a departmental store is as under. Calculate the model class of shirts sold.
Size (in cms) 80-85 85-90 90-95 95-100 100-105 105-110 110-115 No. of shirts sold 33 27 85 155 110 45 15
| Size (in cms) | 80-85 | 85-90 | 90-95 | 95-100 | 100-105 | 105-110 | 110-115 |
| No. of shirts sold | 33 | 27 | 85 | 155 | 110 | 45 | 15 |
Calculate mode of the following data.
| Marks | $$0-20$$ | $$20-40$$ | $$40-60$$ | $$60-80$$ | $$ 80-100$$ |
| Number of students | $$8$$ | $$10$$ | $$12$$ | $$6$$ | $$3$$ |
The mode of the following data isFind the missing frequency $$\chi$$ in it.
| CLASS | 0-10 | 10-20 | 20-30 | 30-40 | 40-50 | 50-60 | 60-70 |
| FREQUENCY | 8 | 10 | $$\chi$$ | 16 | 12 | 6 | 7 |
Calculate the missing frequency from the following distribution, it being given that the median of the distribution is $$24$$.
| Class | $$0-10$$ | $$10-20$$ | $$20-30$$ | $$30-40$$ | $$40-50$$ |
| Frequency | $$5$$ | $$25$$ | $$?$$ | $$18$$ | $$7$$ |
The sum of squares of deviations for $$10$$ observations taken from mean $$50$$ is $$250$$. The co-efficient of variations is
The production of electric bulbs in different factories is shown in the following table. Find the median of the productions.
| No. of bulbs produced (Thousands) | $$30-40$$ | $$40-50$$ | $$50-60$$ | $$60-70$$ | $$70-80$$ | $$80-90$$ | $$90-100$$ |
| No. of factories | $$12$$ | $$35$$ | $$20$$ | $$15$$ | $$8$$ | $$7$$ | $$8$$ |
Find the mean of the following data $$30, 32, 24, 34,28, 30, 35, 33, 25$$
(i) Show that the sum of the deviations of all the given observations from the mean is zero.
(ii) Find the median of the given data.
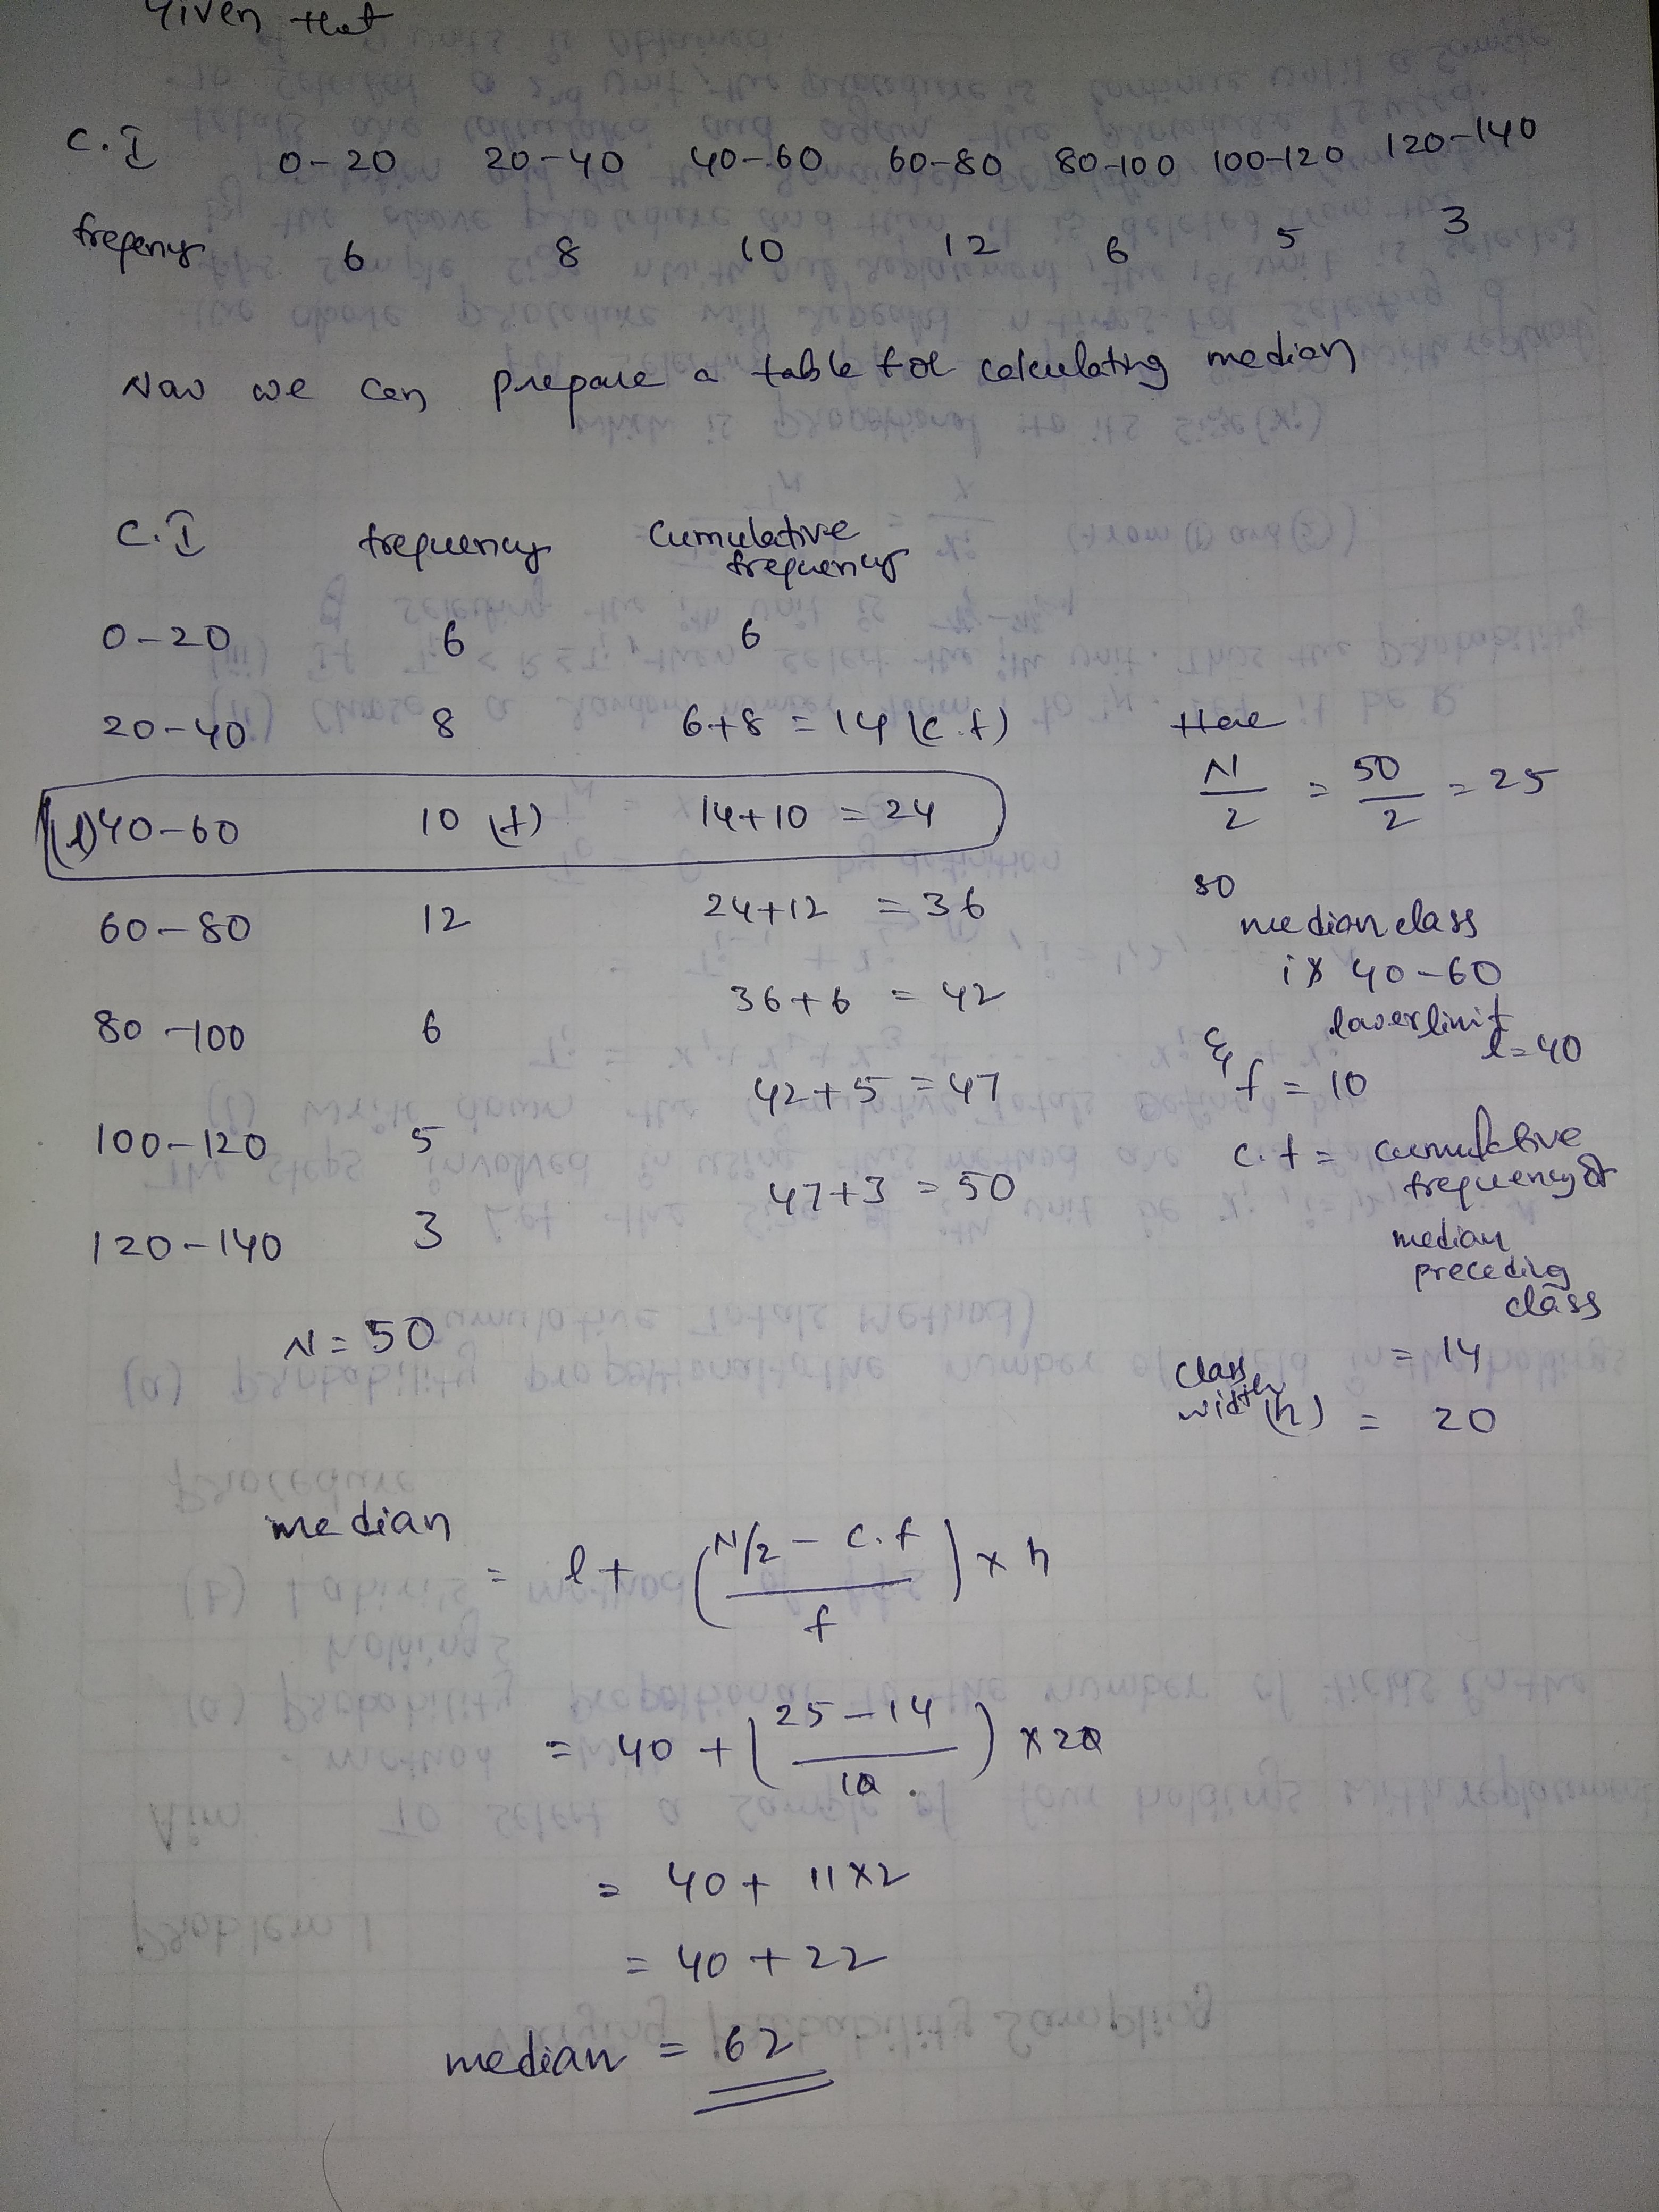
Find the median of the following data:
| Class interval | $$0 - 20$$ | $$20 - 40$$ | $$40 - 60$$ | $$60 - 80$$ | $$80 - 100$$ | $$100 - 120$$ | $$120 - 140$$ |
| Frequency | $$6$$ | $$8$$ | $$10$$ | $$12$$ | $$6$$ | $$5$$ | $$3$$ |
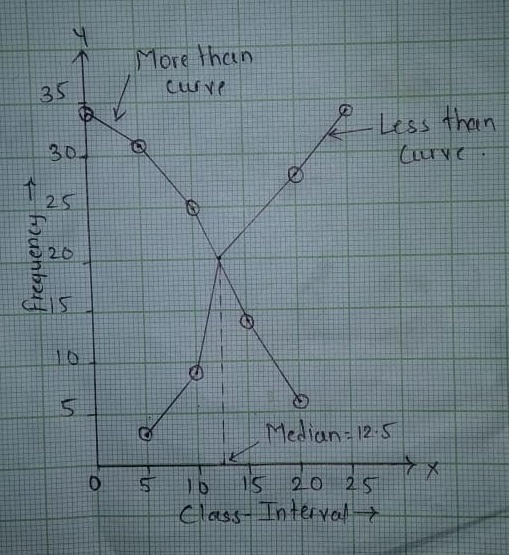
Finding median graphically for the following grouped data ?
| Class Interval | Frequency |
| 0-5 | 03 |
| 5-10 | 06 |
| 10-15 | 11 |
| 15-20 | 08 |
| 20-25 | 06 |
| $$Class-Interval$$ | $$c.f.(more\,than)$$ |
| More than $$0$$ | $$34$$ |
| More than $$5$$ | $$31$$ |
| More than $$10$$ | $$25$$ |
| More than $$15$$ | $$14$$ |
| More than $$20$$ | $$6$$ |
| $$Class-Interval$$ | $$c.f.(less\,than)$$ |
| Less than $$5$$ | $$3$$ |
| Less than $$10$$ | $$9$$ |
| Less than $$15$$ | $$20$$ |
| Less than $$20$$ | $$28$$ |
| Less than $$25$$ | $$34$$ |
The following table given the weekly wages (in Rs.) of workers in a factory:
| Weekly wages (in Rs.) | $$50-55$$ | $$55-60$$ | $$60-65$$ | $$65-70$$ | $$70-75$$ | $$75-80$$ | $$80-85$$ | $$85-90$$ |
| No. of workers | $$5$$ | $$20$$ | $$10$$ | $$10$$ | $$9$$ | $$6$$ | $$12$$ | $$8$$ |
the modal class.
If $$mean = 60$$ and $$median = 50$$, then find mode using empirical relationship.
The weights (in kilograms) of ten puppies from the same litter are recorded below:
$$1.23 \,\,\,\,1.42 \,\, \,\, 2.01 \,\, \,\, 1.56 \,\, \,\,1.66\,\,\,\,\, 0.92 \,\, \,\,1.38 \,\, \,\,1.44 \,\, \,\, 1.52 \,\, \,\,1.48$$
Calculate: the median weight
Find the mode when median is 12 and mean is 16 of a data.
Find the mode
| Marks | 1-5 | 6-10 | 11-16 | 16-20 | 21-25 |
| No. of Students | 7 | 10 | 6 | 32 | 24 |
Find the mode of the following distribution
| Marks in Mathematics | $$45$$ | $$60$$ | $$80$$ | $$90$$ | $$95$$ | $$100$$ |
| Number of students | $$5$$ | $$15$$ | $$6$$ | $$4$$ | $$6$$ | $$4$$ |
Find the mode of the following distribution
| Size of shoes | $$6$$ | $$7$$ | $$8$$ | $$9$$ | $$10$$ |
| Number of student | $$10$$ | $$15$$ | $$9$$ | $$4$$ | $$2$$ |
The following table shows the difference of the ages $$20$$ couples. Find the mean by direct method.
| Difference in ages (in years) | 0-2 | 2-4 | 4-6 | 6-8 | 8-10 | 10-12 |
| No. of couples | 1 | 2 | 8 | 5 | 3 | 1 |
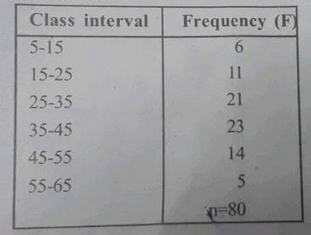
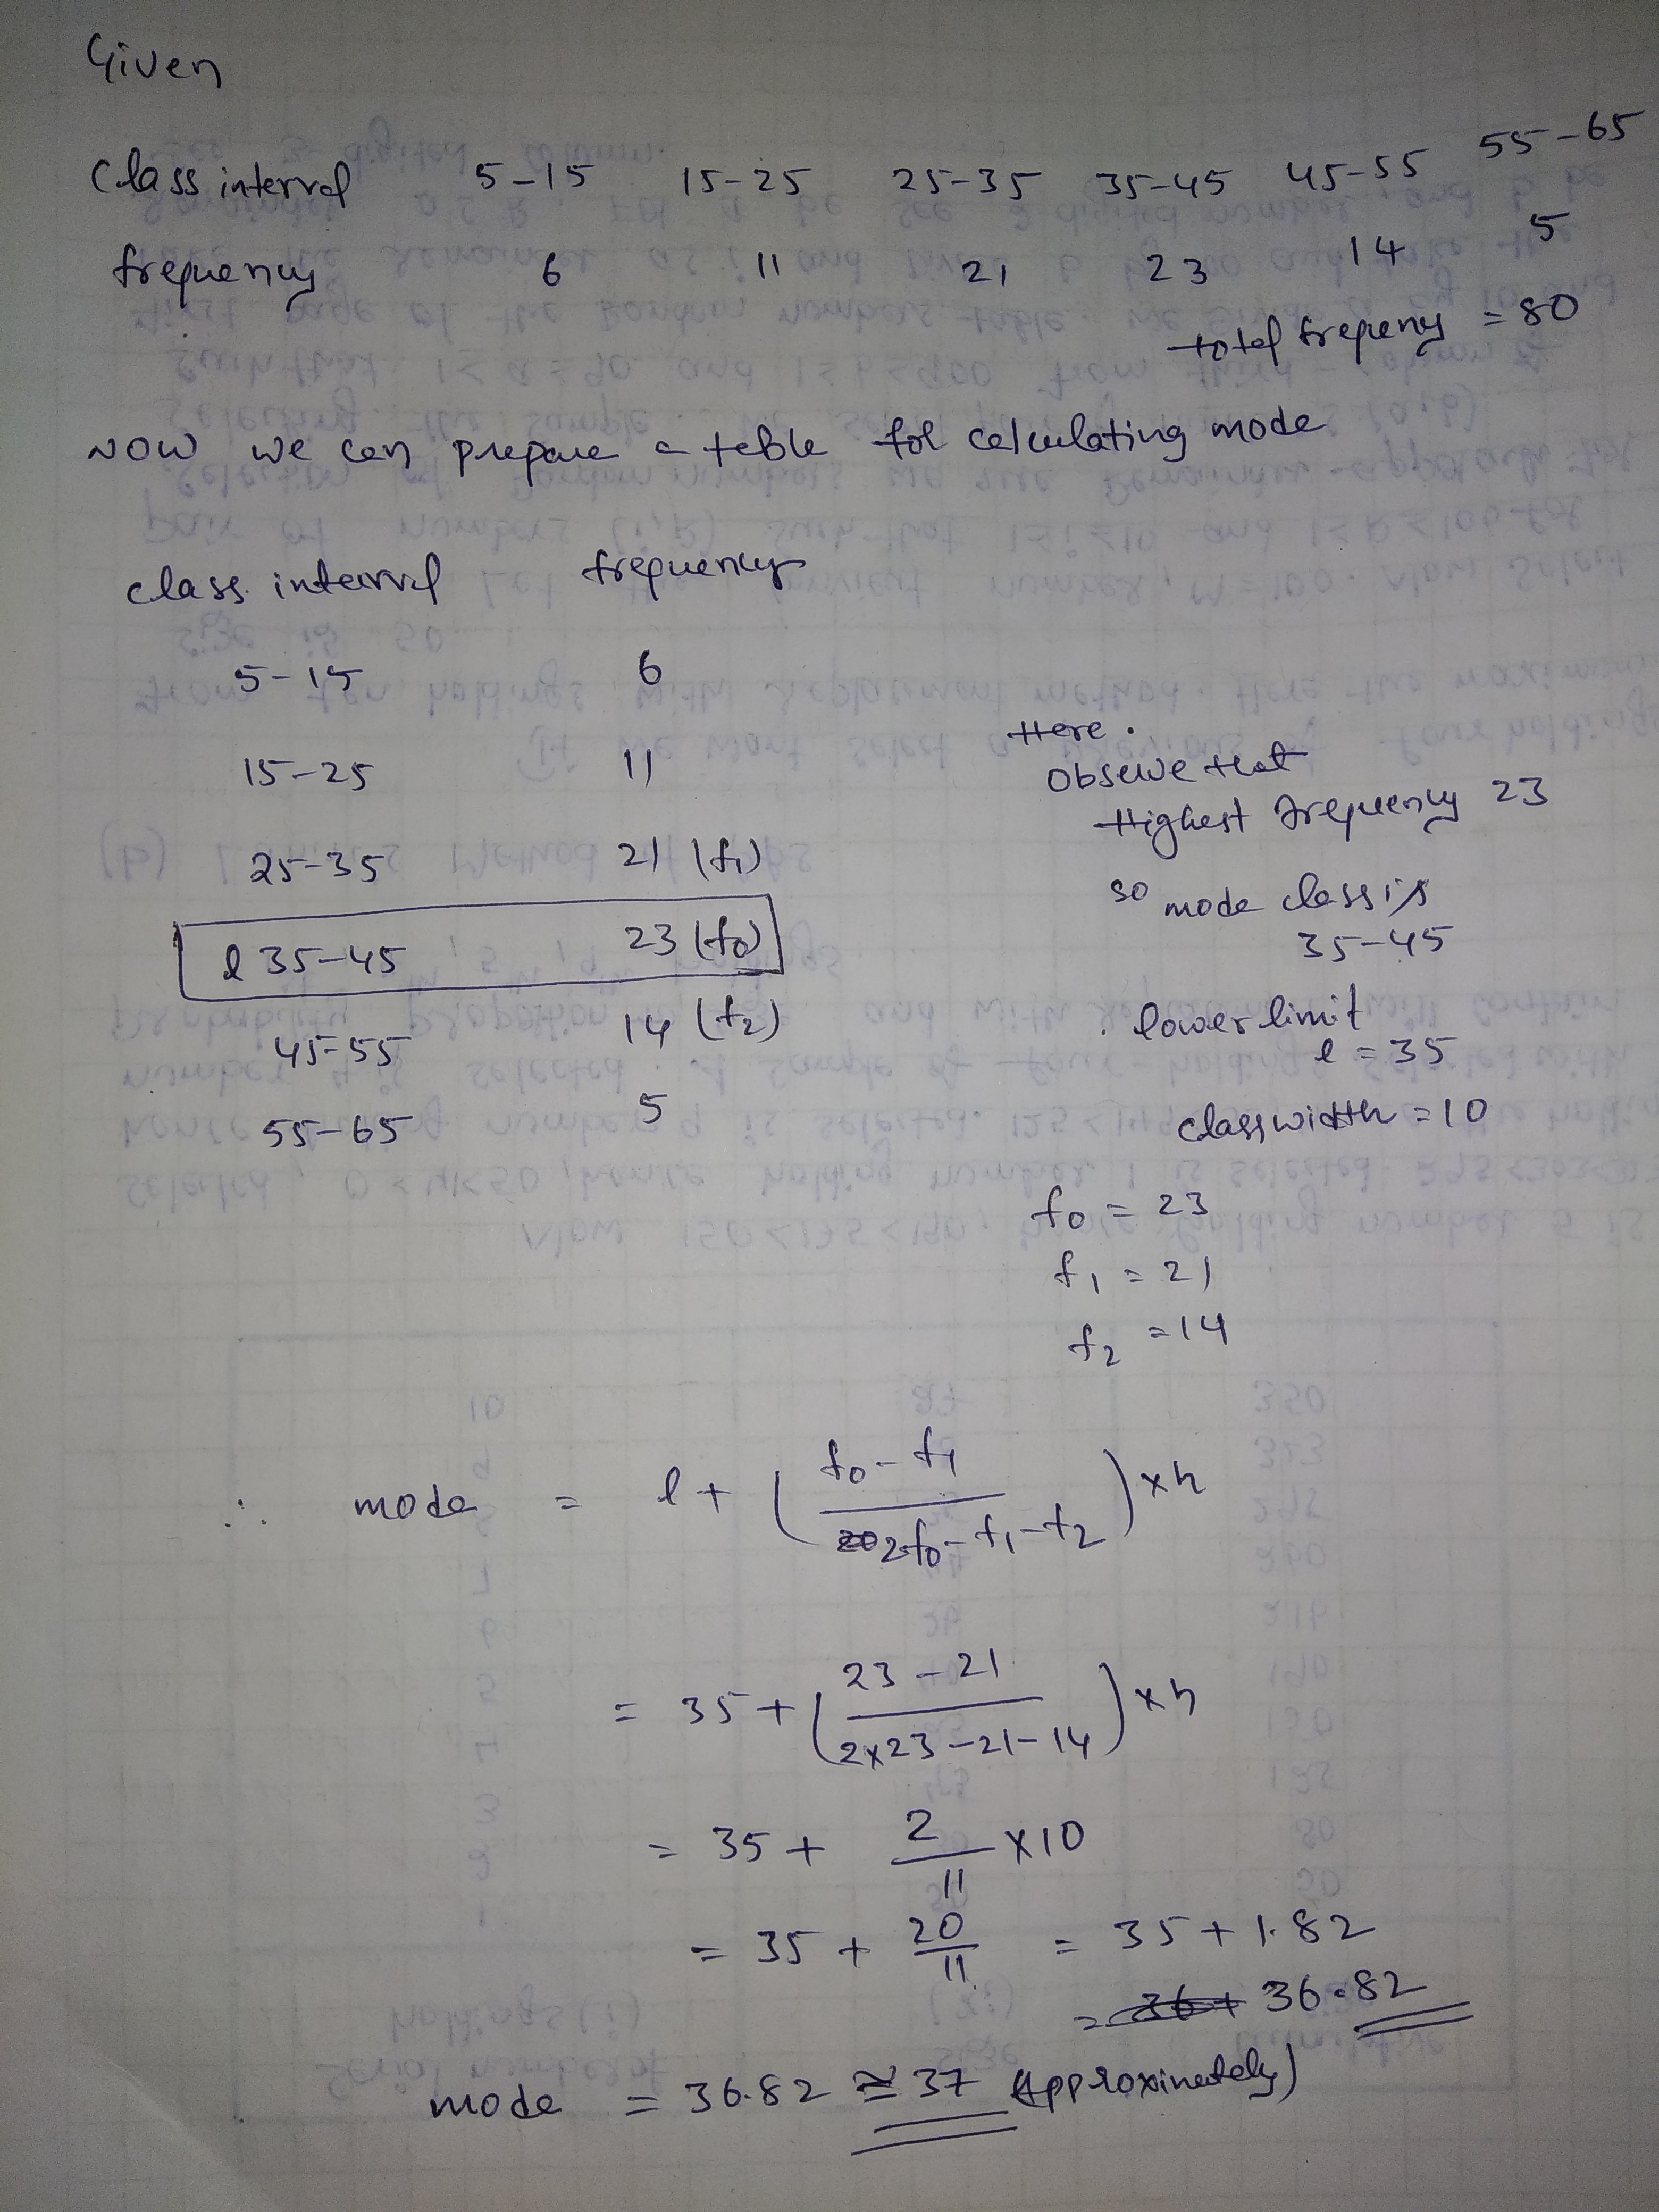
The following table shows the ages of the patients admitted in a hospital during a year:
| Age(in years ) | 5-15 | 15-25 | 25-35 | 35-45 | 45-55 | 55-65 |
| Number of patients | 6 | 11 | 21 | 23 | 14 | 5 |
Find the mode and the mean of the data given above. Compare and interpret the two measure of central tendency.
Find the median :
| Weight | No of students |
| $$40-45$$ | $$2$$ |
| $$45-50$$ | $$3$$ |
| $$50-55$$ | $$8$$ |
| $$55-60$$ | $$6$$ |
| $$60-65$$ | $$6$$ |
| $$65-70$$ | $$3$$ |
| $$70-75$$ | $$2$$ |
Find the mode of
| Class | $$0-5$$ | $$5-10$$ | $$10-15$$ | $$15-20$$ | $$20-25$$ |
| Frequency | $$2$$ | $$3$$ | $$10$$ | $$1$$ | $$4$$ |
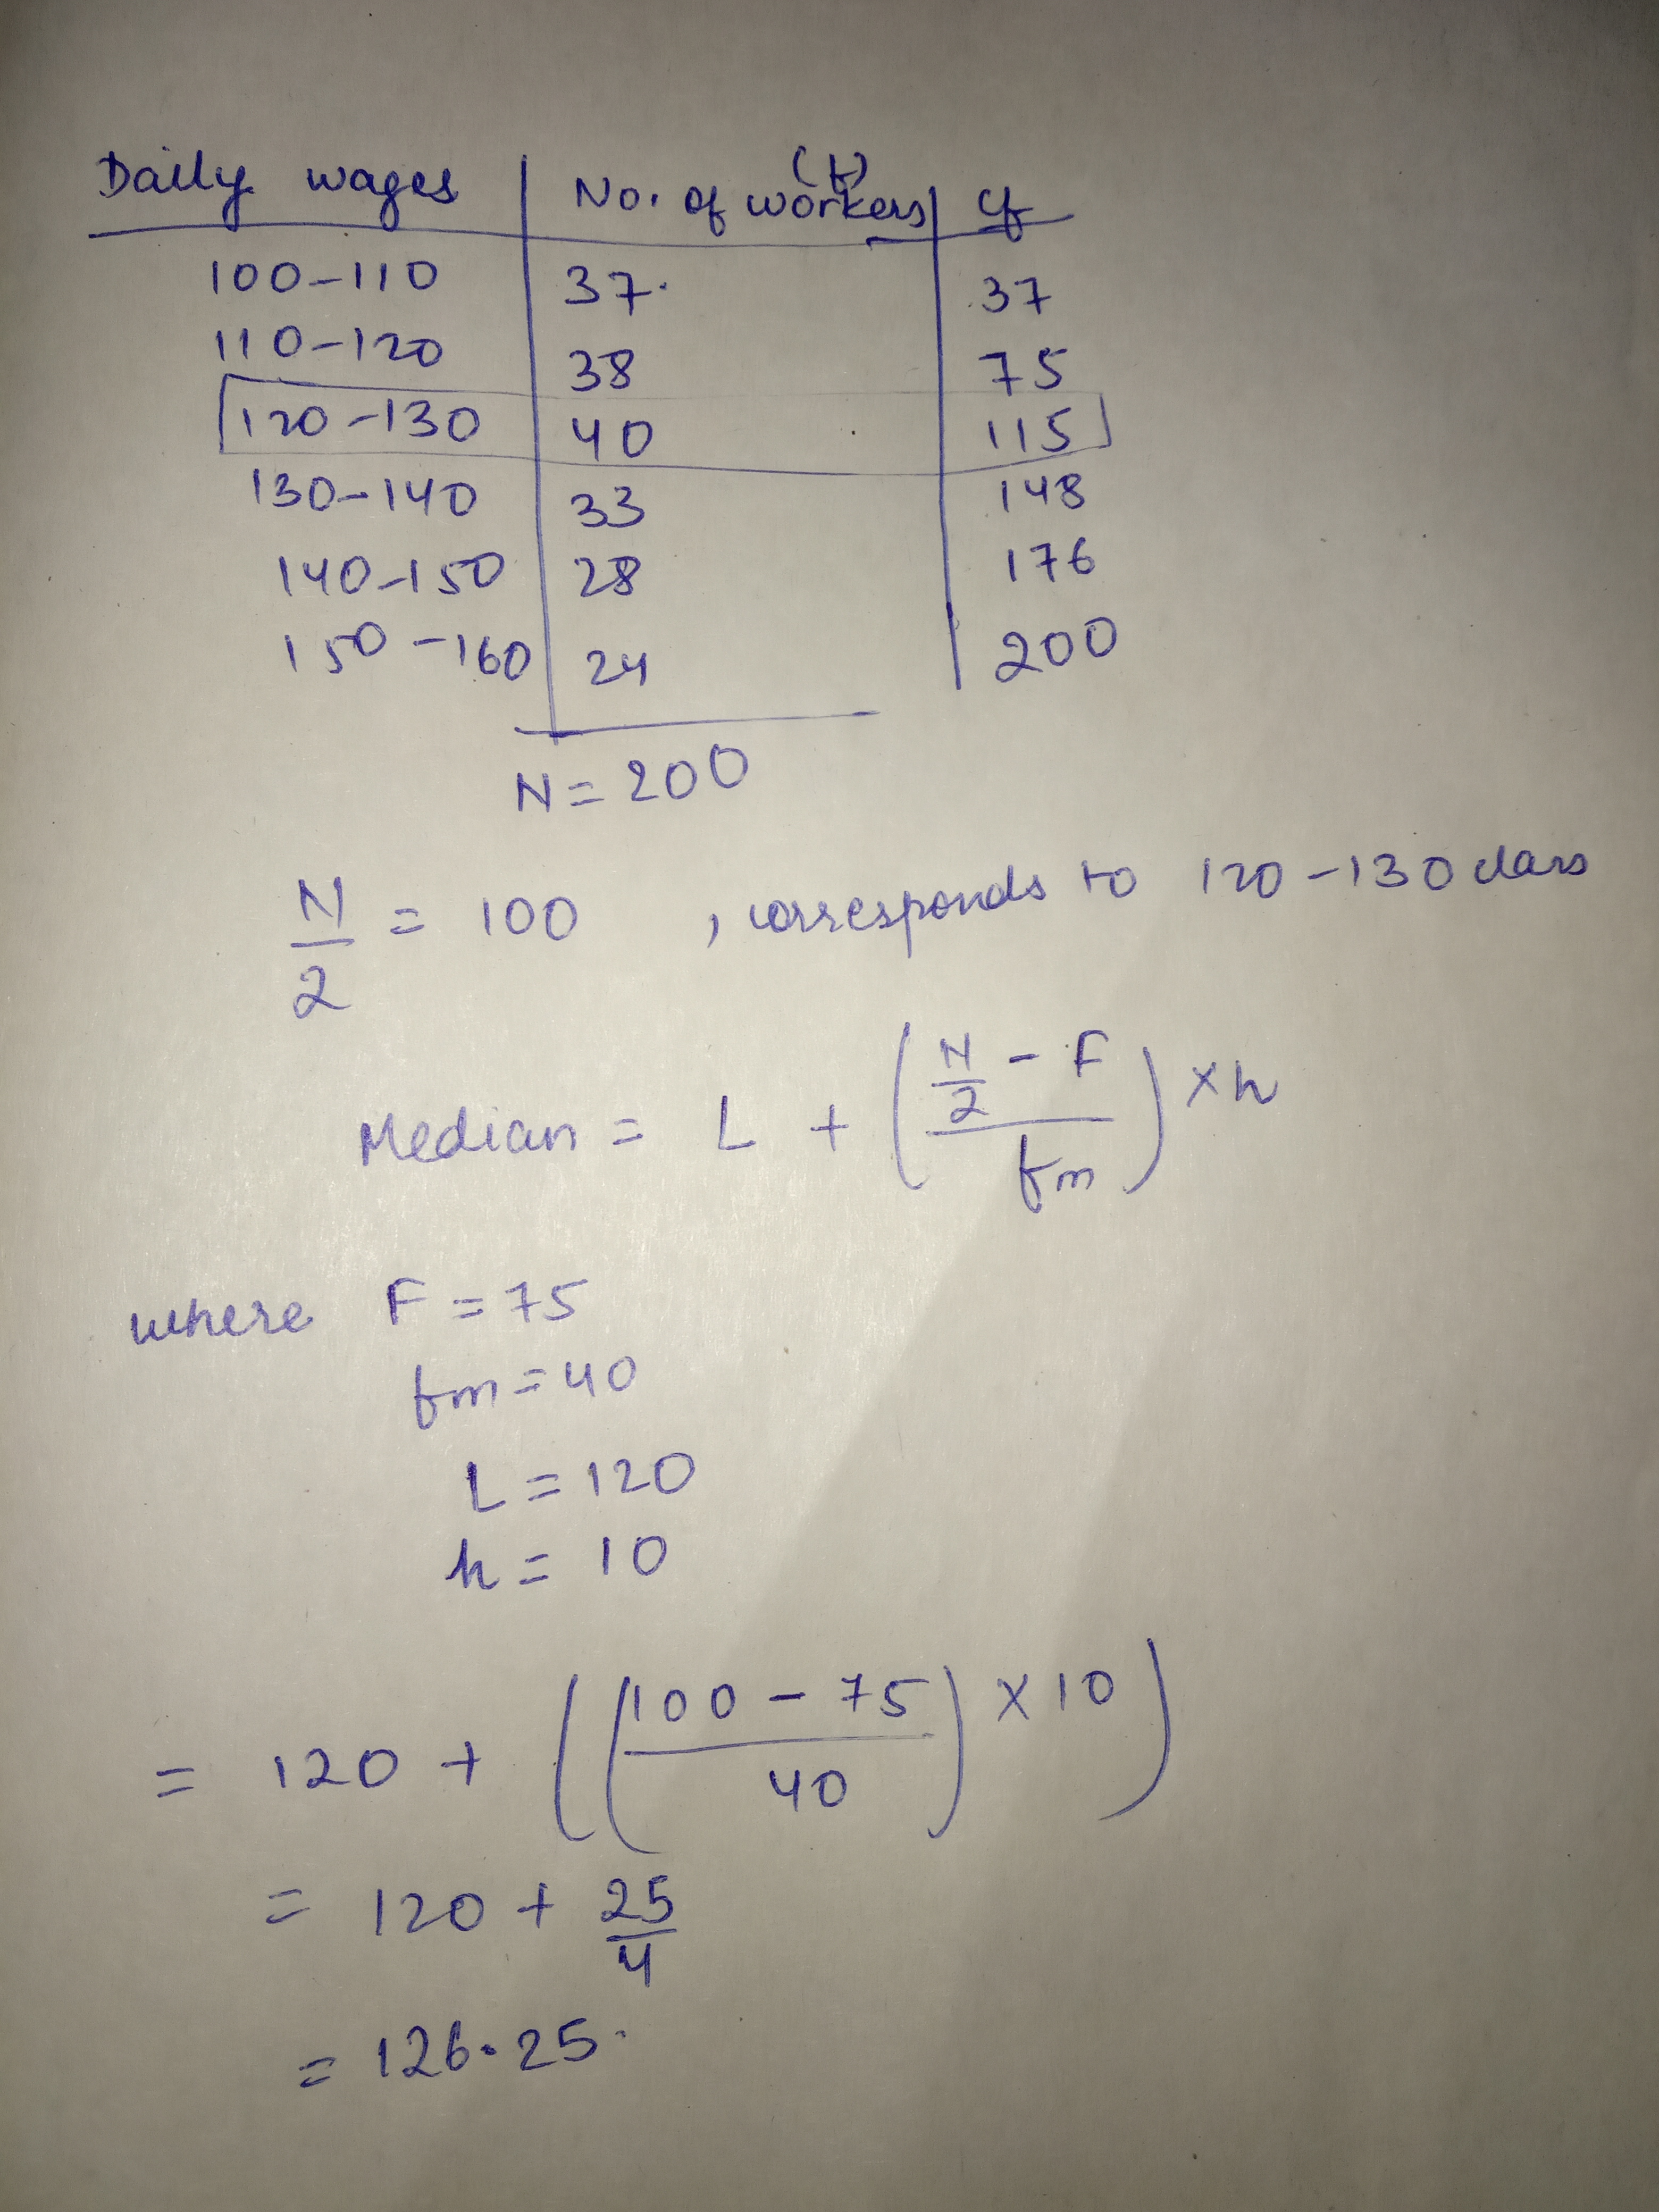
The following table shows the number of workers in a factory and their daily wages. Find the median of the daily wages.
| Daily wages(Rupees) | $$100-110$$ | $$110-120$$ | $$120-130$$ | $$130-140$$ | $$140-150$$ | $$150-160$$ |
| No. of workers | $$37$$ | $$38$$ | $$40$$ | $$33$$ | $$28$$ | $$24$$ |
Find the mode of following data:
| CI | 5-15 | 15-25 | 25-35 | 35-45 | 45-55 | 55-65 |
| f | 6 | 11 | 21 | 23 | 14 | 5 |
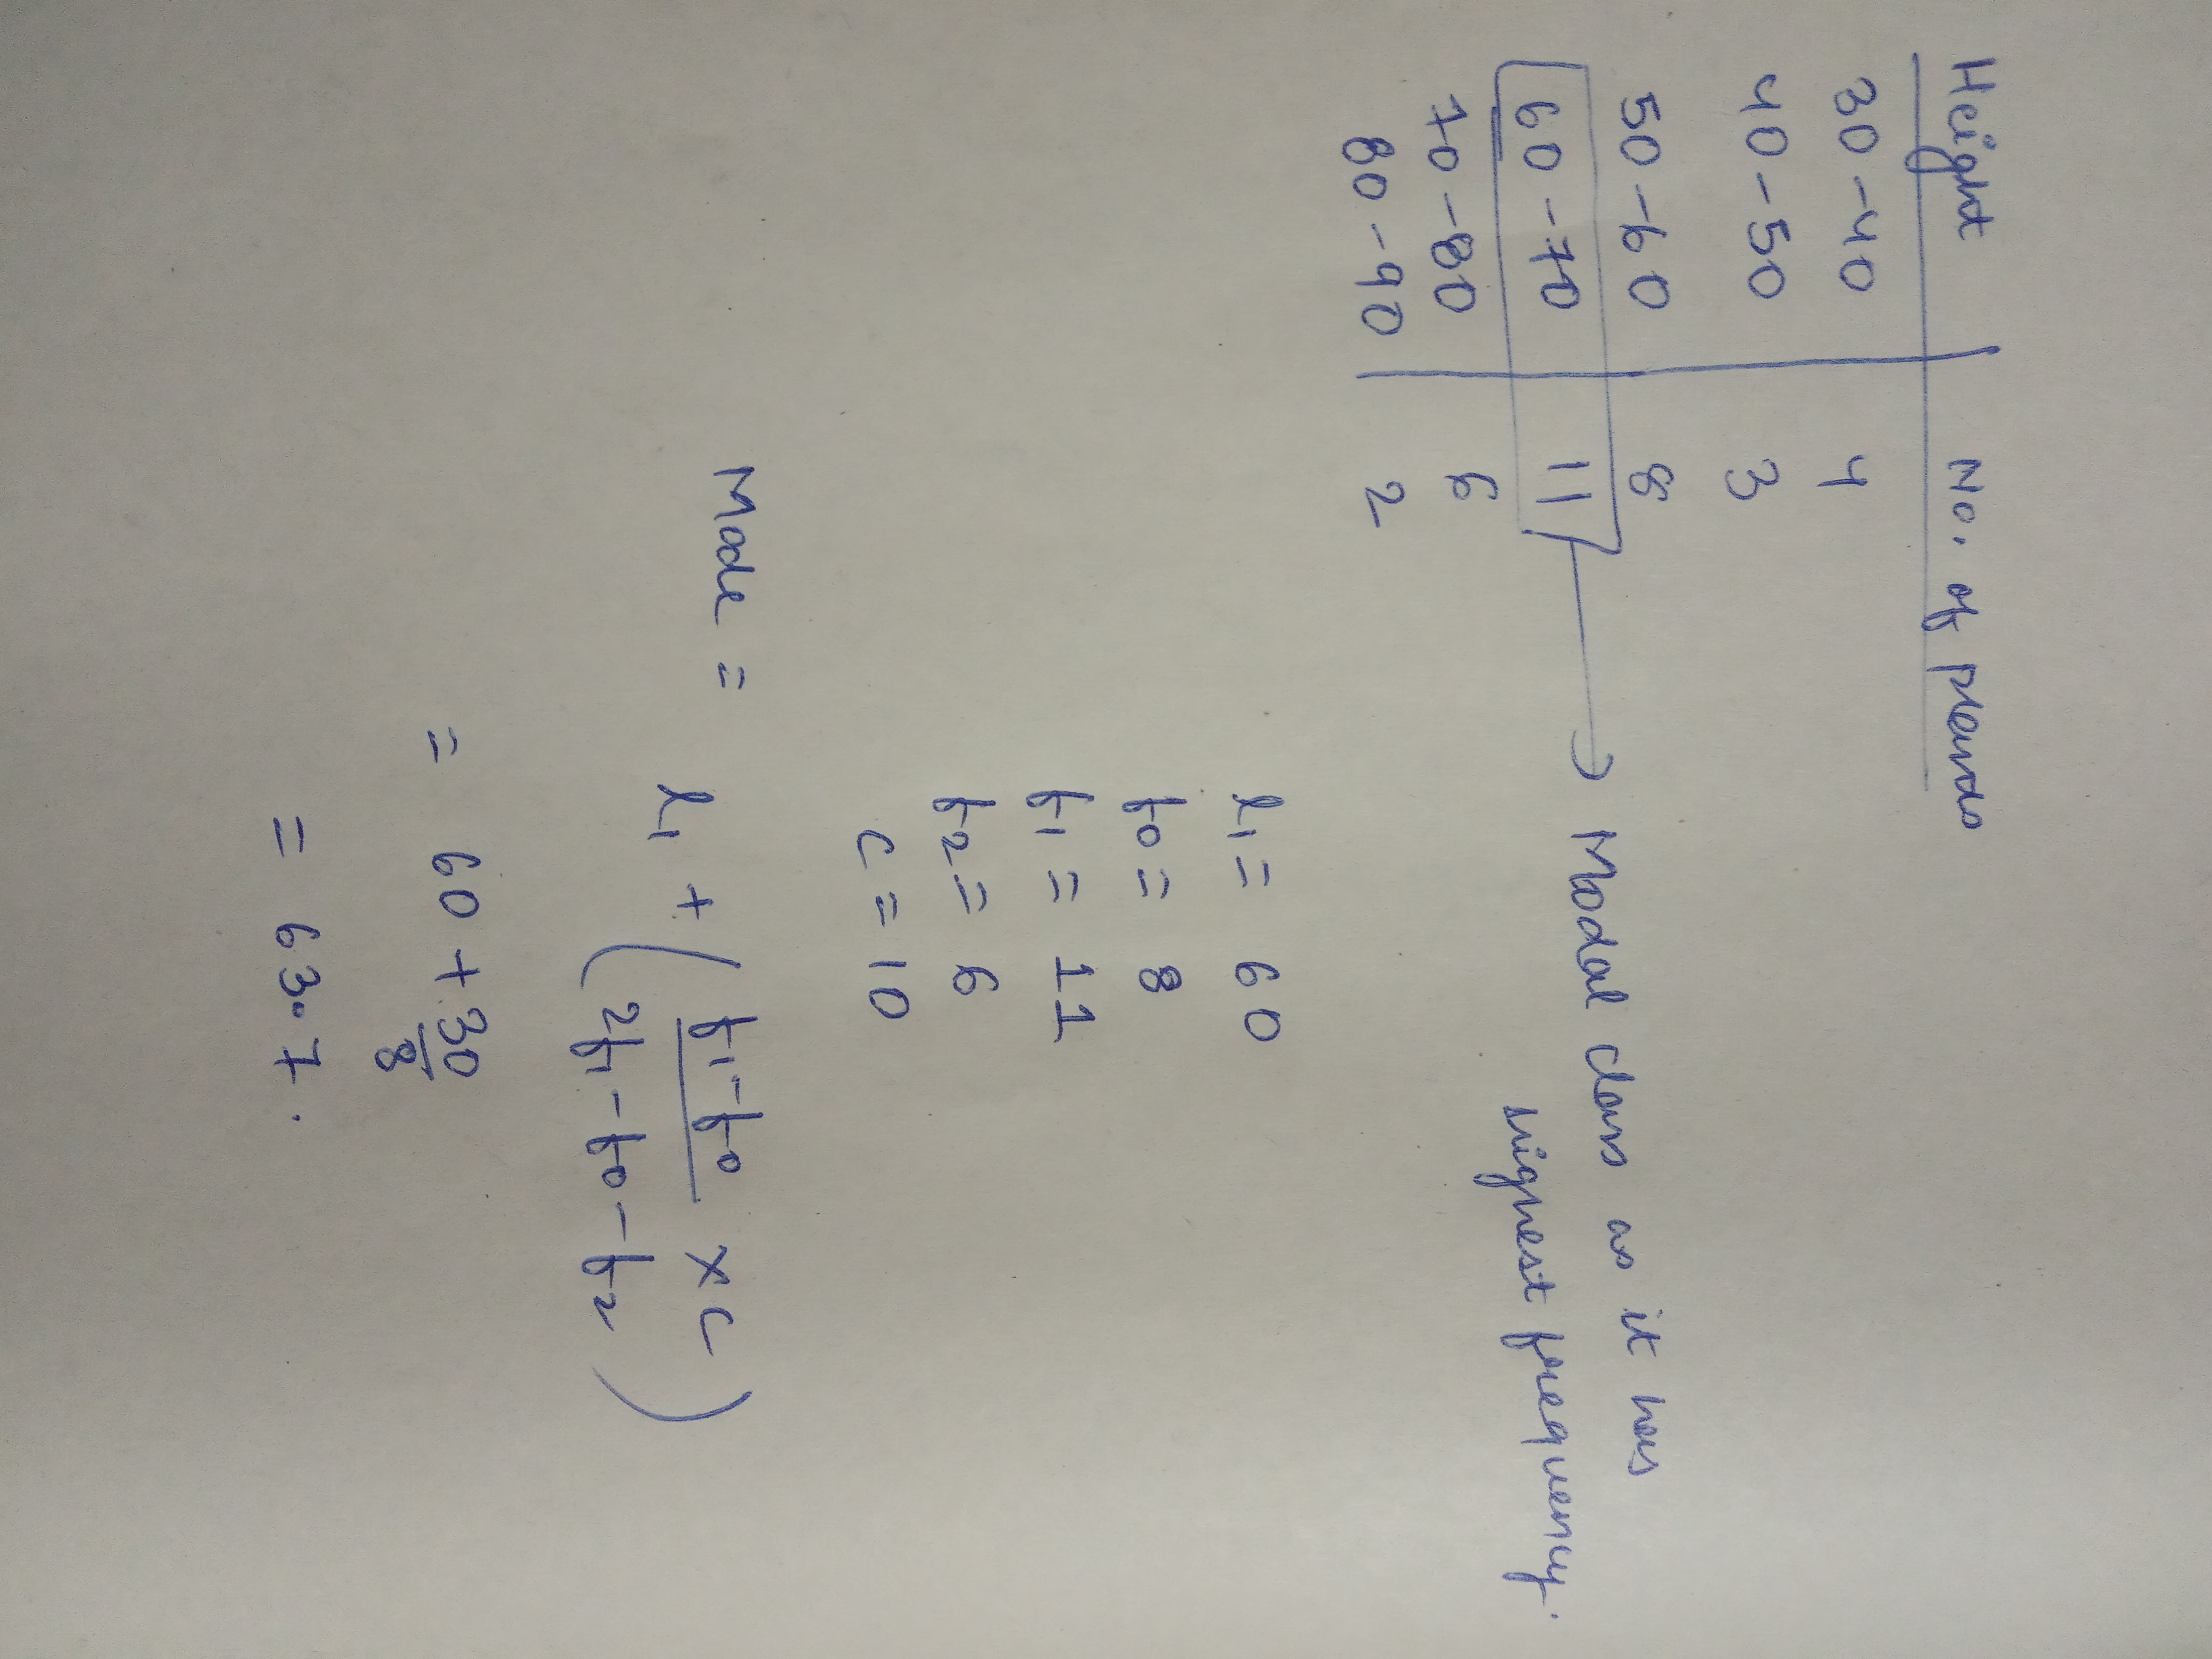
Find the mode of the following distribution:
| Height(in cm) | 30-40 | 40-50 | 50-60 | 60-70 | 70-80 | 80-90 |
| No. of plants | 4 | 3 | 8 | 11 | 6 | 2 |
Find the mode of the following distribution
Height (in inches) $$60$$ $$61$$ $$62$$ $$63$$ $$64$$ $$65$$ $$66$$ Number of children $$0$$ $$10$$ $$6$$ $$4$$ $$18$$ $$10$$ $$2$$
| Height (in inches) | $$60$$ | $$61$$ | $$62$$ | $$63$$ | $$64$$ | $$65$$ | $$66$$ |
| Number of children | $$0$$ | $$10$$ | $$6$$ | $$4$$ | $$18$$ | $$10$$ | $$2$$ |
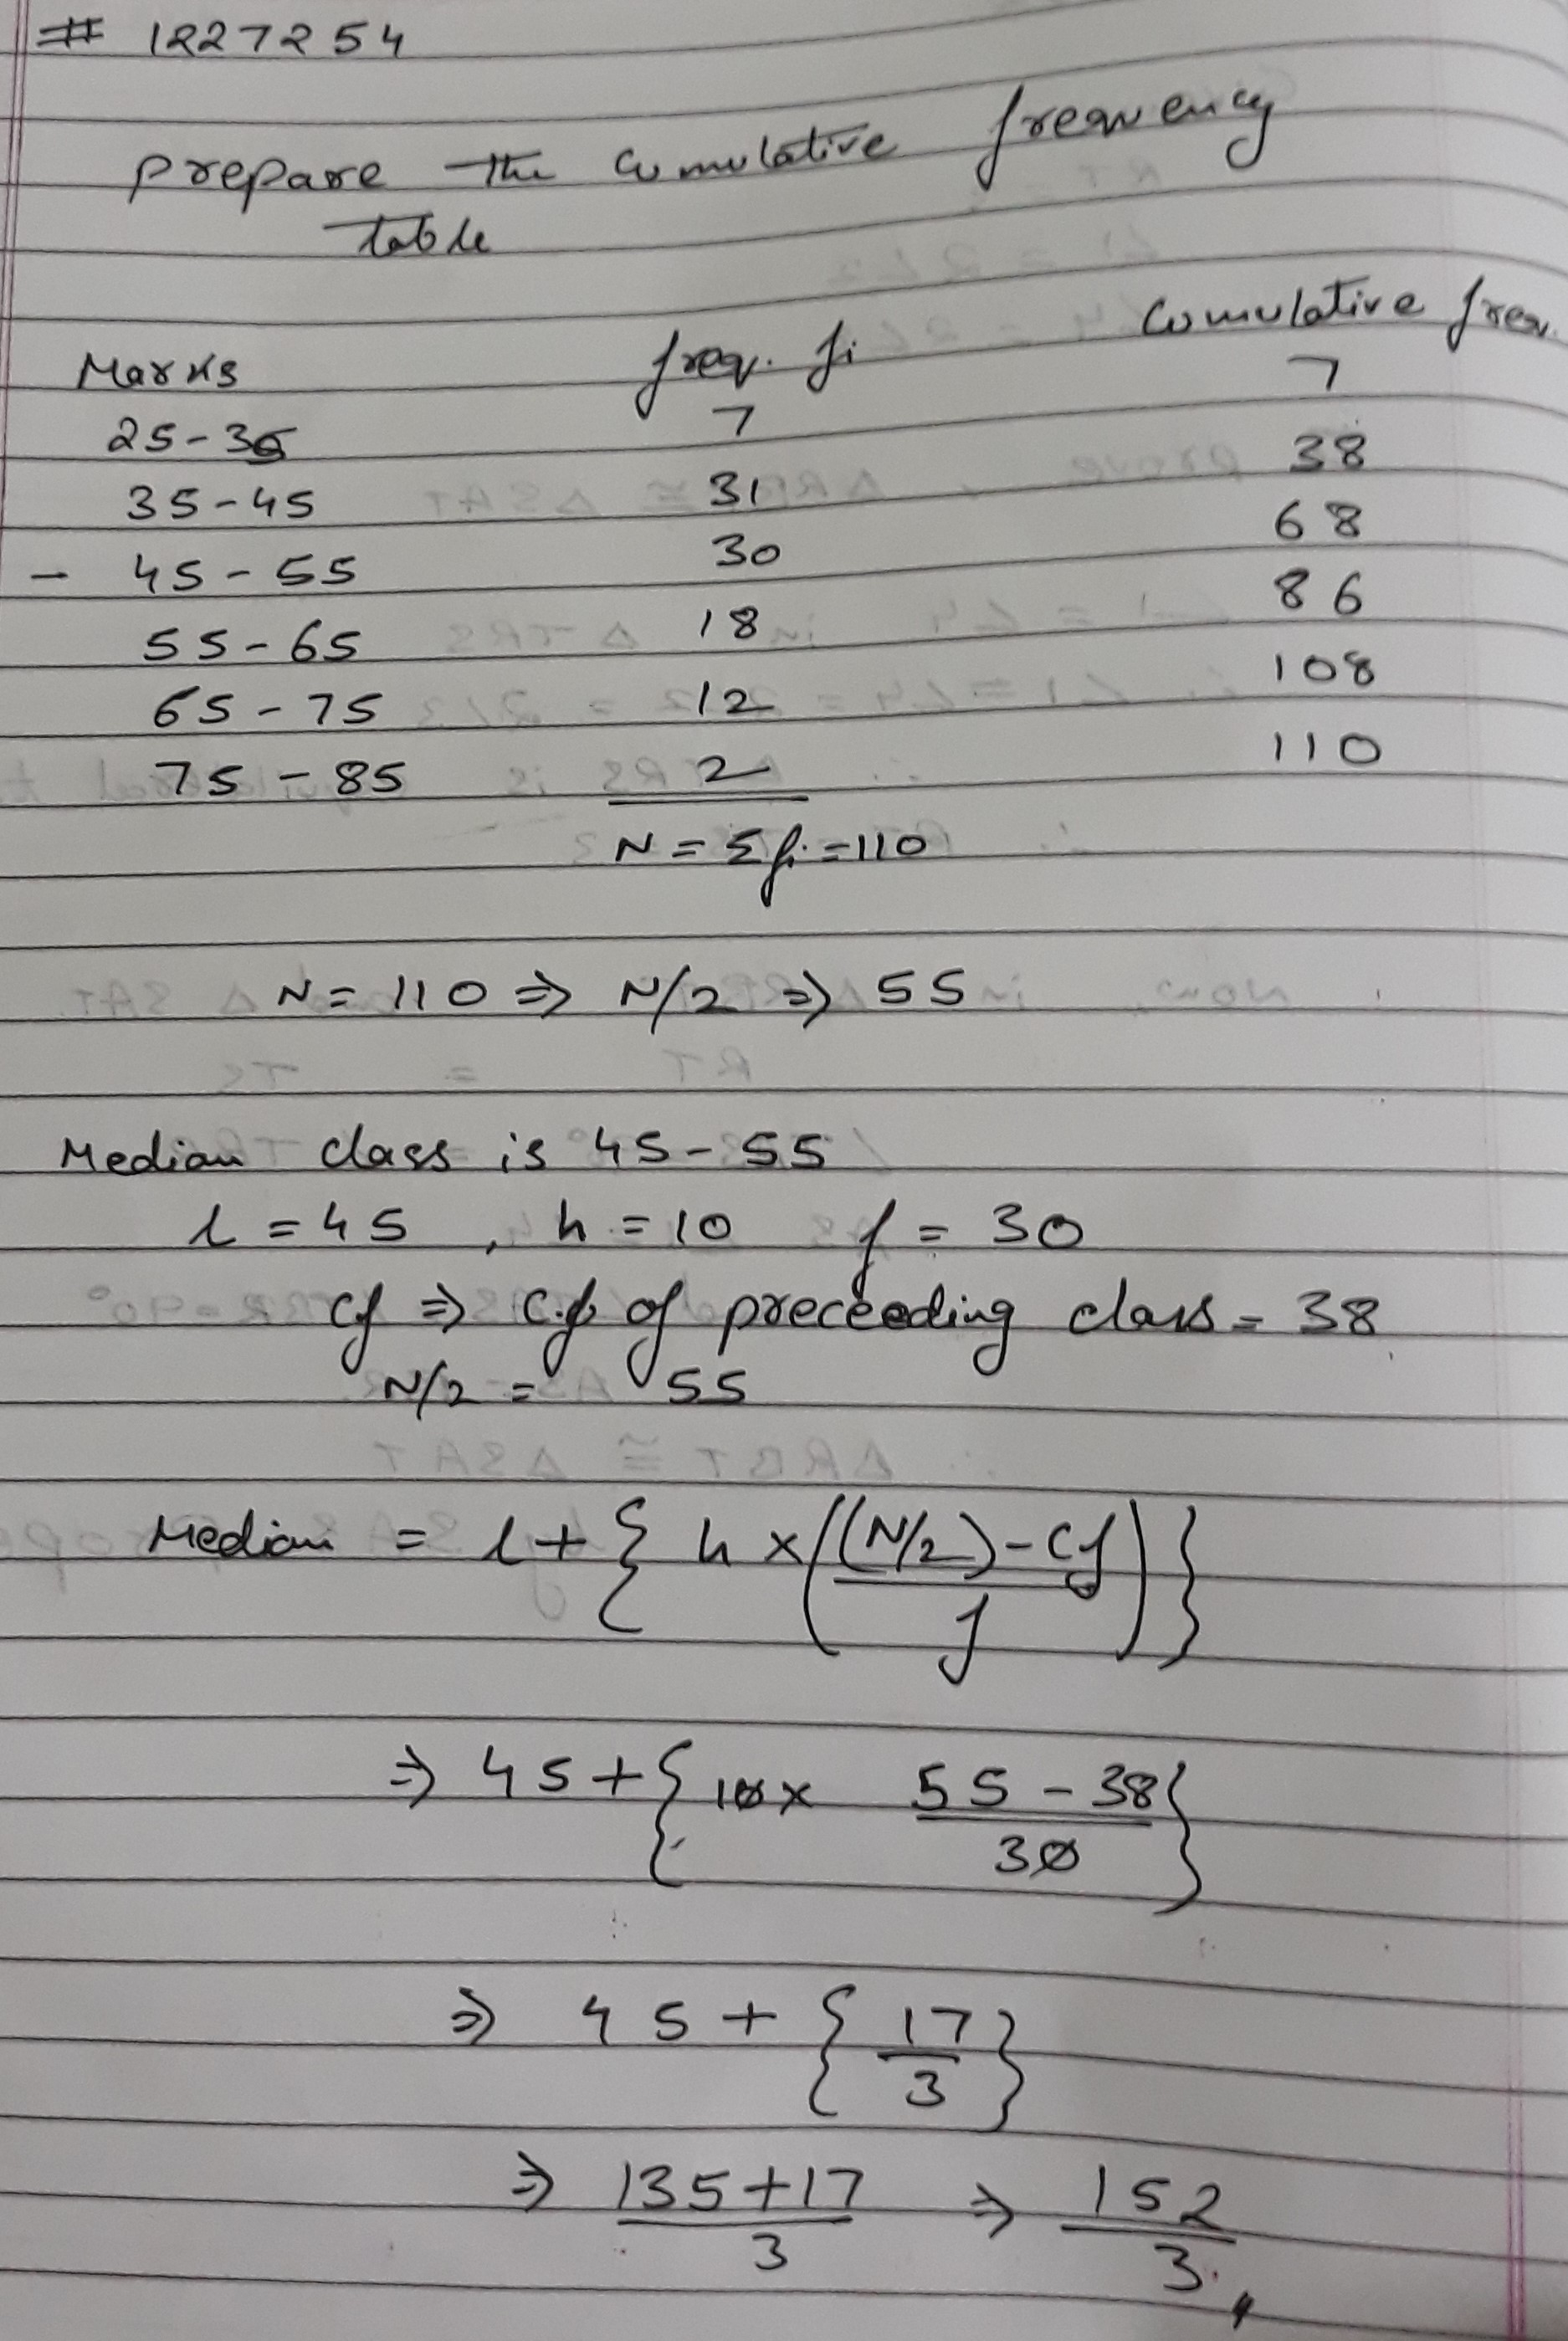
Find the median marks for the following.
| Marks | $$25-35$$ | $$35-45$$ | $$45-55$$ | $$55-65$$ | $$65-75$$ | $$75-85$$ |
| No. of students | $$7$$ | $$31$$ | $$30$$ | $$18$$ | $$12$$ | $$2$$ |
Find the median of the following data:
| monthly consumption | no. of consumers |
| Below 85 | 4 |
| Below 105 | 9 |
| Below 125 | 22 |
| Below 145 | 42 |
| Below 165 | 56 |
| Below 185 | 64 |
Find the mode of the following frequency distribution.
| Class | 0-10 | 10-20 | 20-30 | 30-40 | 40-50 | 50-60 | 60-70 |
| Frequency | 8 | 10 | 10 | 16 | 12 | 6 | 7 |
Write the formula to find the median of a grouped data and explain the alphabet in it.
Find the median of the following data
$$3,1,5,6,3,4,5$$
A survey conducted on $$20$$ household in a locality by a group of statement resulted in the following frequency table for the number of family
Members in a house hold.
| $$\text {Family} \,\text {size}$$ | $$1-3$$ | $$3-5$$ | $$5-7$$ | $$7-9$$ | $$9-11$$ |
| $$\text {Number}\, \,of\, \text {families}$$ | $$7$$ | $$8$$ | $$2$$ | $$2$$ | $$1$$ |
If the mode of a distribution is $$8$$ and mean is also $$8$$, then find median.
If median = 137 units and mean = 137.05 units, then find the mode.
Find the mean of the following frequency distribution:
| Class | 0-20 | 20-40 | 40-60 | 60-80 | 80-100 |
| Frequency | 15 | 18 | 21 | 29 | 17 |
The following data gives the information on the observed lifetimes (in hours) of $$225$$ electrical components:
| Lifetimes (in hours) | $$0-20$$ | $$20-40$$ | $$40-60$$ | $$60-80$$ | $$80-100$$ | $$100-120$$ |
| Frequency | $$10$$ | $$35$$ | $$52$$ | $$61$$ | $$38$$ | $$29$$ |
Write the modal class for the following frequency distribution:
| Class interval | $$10-20$$ | $$20-30$$ | $$30-40$$ | $$40-50$$ | $$50-60$$ | $$60-70$$ |
| Frequency | $$33$$ | $$38$$ | $$65$$ | $$52$$ | $$19$$ | $$48$$ |
A data constitutes of heights (in cm) of $$50$$ children. What do you understand by mode for the data?
Find the mean of the following frequency distribution:
| Class | 25-29 | 30-34 | 35-39 | 40-44 | 45-49 | 550-54 | 555-59 |
| Frequency | 14 | 22 | 16 | 6 | 5 | 3 | 4 |
Find the median class of the following distribution:
| Class | $$0-10$$ | $$10-20$$ | $$20-30$$ | $$30-40$$ | $$40-50$$ | $$50-60$$ | $$60-70$$ |
| Frequency | $$4$$ | $$4$$ | $$8$$ | $$10$$ | $$12$$ | $$8$$ | $$4$$ |
Find the mean of the following frequency distribution:
| Class interval | 50-60 | 60-70 | 70-80 | 80-90 | 90-100 |
| Frequency | 8 | 6 | 12 | 11 | 13 |
Find the mean of the following frequency distribution:
| Class interval | 15-25 | 25-35 | 35-45 | 45-55 | 55-65 |
| Frequency | 60 | 35 | 22 | 18 | 15 |
Find the mean of the following data:
| Classes | 0-100 | 100-200 | 200-300 | 300-400 | 400-500 |
| Frequency | 6 | 9 | 15 | 12 | 8 |
Find the mean of the following data:
| Classes | 0-10 | 10-20 | 20-30 | 30-40 | 40-50 |
| Frequency | 3 | 5 | 9 | 5 | 3 |
A hockey player has scored the following number of goals in $$9$$ matches.$$5, 4, 0, 2, 2, 4, 4, 3, 3$$.Find the mean, median, and mode of the data.
The arithmetic mean of the following frequency distribution is 25.Determine the value of p:
| Class | 0-10 | 10-20 | 20-30 | 30-40 | 40-50 |
| Frequency | 7 | 8 | p | 15 | 4 |
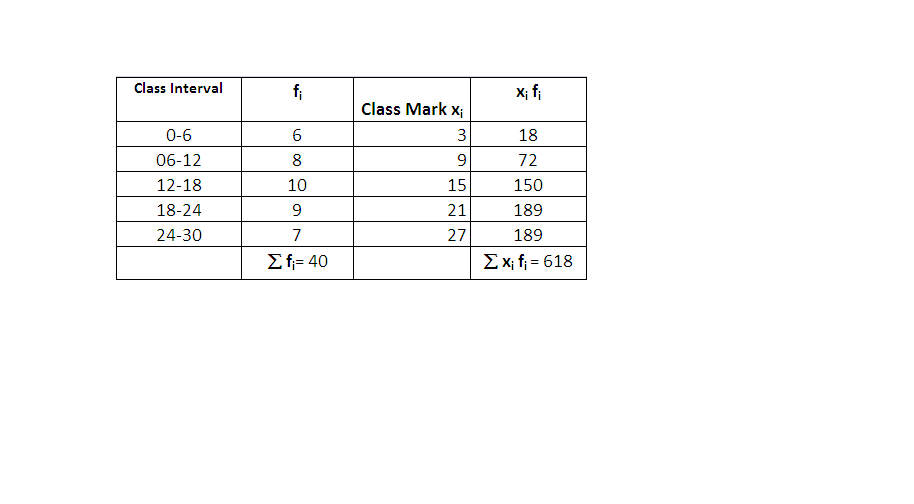
| Class Interval | 0-6 | 6-12 | 12-18 | 18-24 | 24-30 |
| Frequency | 6 | 8 | 10 | 9 | 7 |
For\quad grouped\quad data\quad when\quad Class\quad Interval\quad \quad is\quad given,\quad we\quad find\quad the\quad Class\quad Mark.\\ Class\quad Mark\quad =\quad mid\quad point\quad of\quad an\quad interval\quad =\quad \frac { \left( Lower\quad limit\quad +\quad Upper\quad limit \right) }{ 2 } \\ Class\quad Mark\quad is\quad taken\quad as\quad { x }_{ i }for\quad each\quad class\quad interval.\quad Find\quad { x }_{ i }{ f }_{ i }.\quad \\ From\quad the\quad table,\quad we\quad have\quad \Sigma { x }_{ i }{ f }_{ i }\quad =\quad 618\quad \quad \& \quad \quad \Sigma { f }_{ i }\quad =\quad 40\\ Mean\quad =\quad \frac { \Sigma { x }_{ i }{ f }_{ i } }{ \Sigma { f }_{ i } } \quad =\quad \frac { 618 }{ 40 } \quad =\quad 15.45\\
$$
Calculate the missing frequency $$f$$ from the following distribution, it is being given that the median of the distribution is $$24$$.
| Class | 0-10 | 10-20 | 20-30 | 30-40 | 40-50 |
| Frequency | 5 | 25 | f | 18 | 7 |
Find the median for the following frequency distribution:
| Class Interval | 0-10 | 10-20 | 20-30 | 30-40 | 40-50 | 50-60 |
| Frequency | 6 | 9 | 14 | 2 | 19 | 10 |
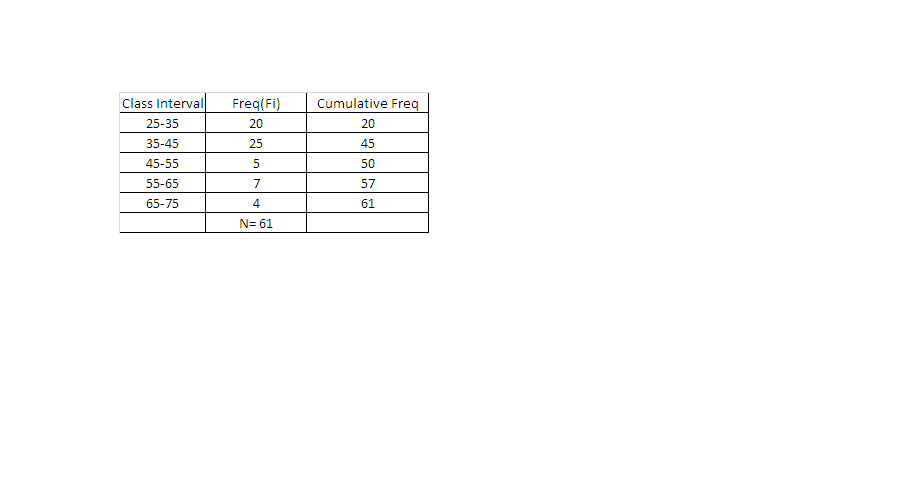
Find the median for the following frequency distribution:
Class Interval | 25-35 | 35-45 | 45-55 | 55-65 | 65-75 |
| Frequency | 20 | 25 | 5 | 7 | 4 |
For\quad continuous\quad data,\quad median=\quad L\quad +\quad \left( \frac { \frac { N }{ 2 } -C }{ f } \right) \quad \times \quad H\\ Where\quad N\quad =\quad Total\quad cumulative\quad frequency\\ L\quad =\quad lower\quad limit\quad of\quad the\quad median\quad class\quad Interval $$
Here\quad N=61\\ \frac { N }{ 2 } =30.5\quad ,\quad this\quad cumulative\quad freq\quad lies\quad within\quad interval\quad \left( 35-45 \right) ;\quad L=35\\ C=20\quad ;f=25;\quad H=10\\ Hence\quad median=\quad 35+\left( \frac { \frac { 61 }{ 2 } -20 }{ 25 } \times 10 \right) =\quad 35+\left( \frac { 30.5-20 }{ 25 } \times 10 \right) $$
$$
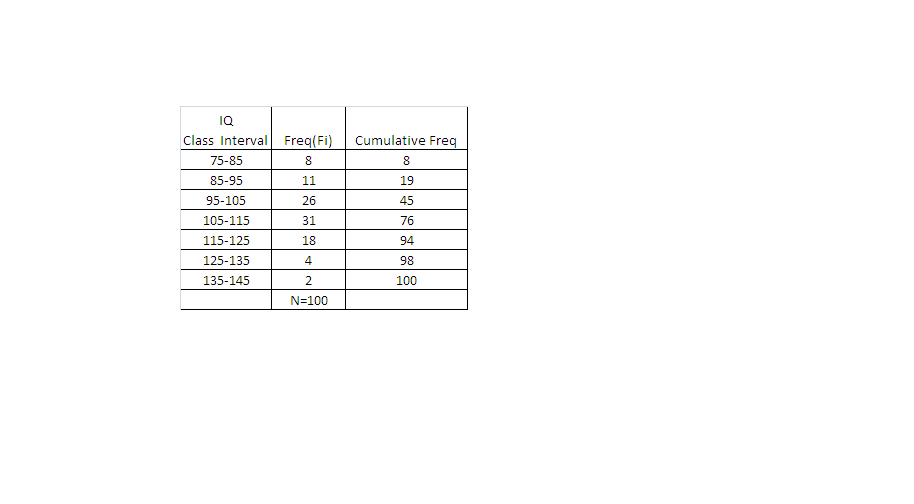
The.following table gives the distribution of IQ of 100 students. Find the median IQ.
| IQ | Frequency |
| 75-84 | 8 |
| 85-94 | 11 |
| 95-104 | 26 |
| 105-114 | 31 |
| 115-124 | 18 |
| 125-134 | 4 |
| 135-144 | 2 |
For\quad continuous\quad data,\quad median=\quad L\quad +\quad \left( \frac { \frac { N }{ 2 } -C }{ f } \right) \quad \times \quad H\\ Where\quad N\quad =\quad Total\quad cumulative\quad frequency\\ L\quad =\quad lower\quad limit\quad of\quad the\quad median\quad class\quad Interval\quad ;\quad Median\quad Class\quad =\quad the\quad class\quad interval $$
$$ Here\quad N=100\\ \frac { N }{ 2 } =50\quad ,\quad this\quad cumulative\quad freq\quad lies\quad within\quad interval\quad \left( 35-40 \right) ;\\ L=105\quad ;C=45\quad ;f=31;\quad H=5\\ Hence\quad median=\quad 105+\left( \frac { \frac { 100 }{ 2 } -45 }{ 31 } \times 10 \right) =\quad 105+\left( \frac { 50-45 }{ 31 } \times 10 \right) =\quad 105+\left( \frac { 5 }{ 31 } \times 10 \right) =\quad 105+\frac { 50 }{ 31 } $$
$$
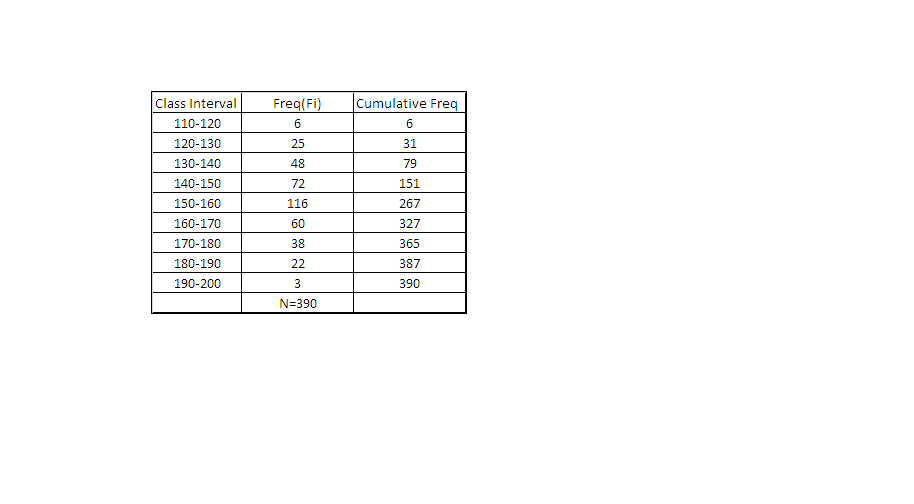
Find the median from the following data:
| Class groups | Frequency |
| 110-120 | 6 |
| 120-130 | 25 |
| 130-140 | 48 |
| 140-150 | 72 |
| 150-160 | 116 |
| 160-170 | 60 |
| 170-180 | 38 |
| 180-190 | 22 |
| 190-200 | 3 |
If true then enter $$1$$ and if false then enter $$0$$
For\quad continuous\quad data,\quad median=\quad L\quad +\quad \left( \frac { \frac { N }{ 2 } -C }{ f } \right) \quad \times \quad H\\ Where\quad N\quad =\quad Total\quad cumulative\quad frequency\\ L\quad =\quad lower\quad limit\quad of\quad the\quad median\quad class\quad Interval\quad ;\quad Median\quad Class\quad =\quad the\quad class $$
$$
The following table gives the marks obtained by 50 students in a class test :
| Marks | No. of students |
| 11-15 | 2 |
| 16-20 | 3 |
| 21-25 | 6 |
| 26-30 | 7 |
| 31-35 | 14 |
| 36-40 | 12 |
| 41-45 | 4 |
| 46-50 | 2 |
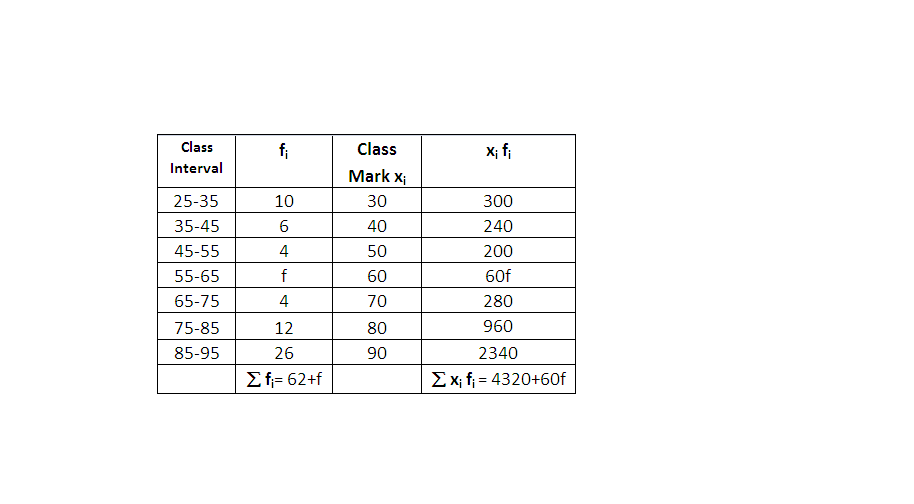
Find the value of, the missing frequency, If the mean of the following distribution is 67.
| Class Interval | Frequency |
| 25-35 | 10 |
| 35-45 | 6 |
| 45-55 | 4 |
| 55-65 | f |
| 65-75 | 4 |
| 75-85 | 12 |
| 85-95 | 26 |
If true then enter $$1$$ and if false then enter $$0$$
For\quad grouped\quad data\quad when\quad Class\quad Interval\quad \quad is\quad given,\quad we\quad find\quad the\quad Class\quad Mark.\\ Class\quad Mark\quad =\quad mid\quad point\quad of\quad an\quad interval\quad =\quad \dfrac { \left( Lower\quad limit\quad +\quad Upper\quad limit \right) }{ 2 } \\ Class\quad Mark\quad is\quad taken\quad as\quad { x }_{ i }\quad for\quad each\quad class\quad interval.\quad Find\quad { x }_{ i }{ f }_{ i }.\quad \\ From\quad the\quad table,\quad we\quad have\quad \Sigma { x }_{ i }{ f }_{ i }=4320+60f\quad \& \quad \quad \Sigma { f }_{ i }=62+f\\ Given\quad Mean\quad =\quad 67\\ Mean\quad =\quad \frac { \Sigma { x }_{ i }{ f }_{ i } }{ \Sigma { f }_{ i } } \quad \\ \Rightarrow \quad 67\quad =\quad \frac { 4320+60f }{ 62+f } \\ \Rightarrow \quad \left( 62+f \right) \quad \times \quad 67\quad =\quad 4320\quad +\quad 60f\\ \Rightarrow \quad 4154\quad +\quad 67f\quad =\quad 4320\quad +\quad 60f\\ \Rightarrow \quad 67f\quad -60f\quad =\quad 4320\quad -\quad 4154\\ \Rightarrow \quad 7f\quad =\quad 166\\ \Rightarrow \quad f\quad =\quad \frac { 166 }{ 7 } \\ \Rightarrow \quad f\quad =\quad 23.71
$$
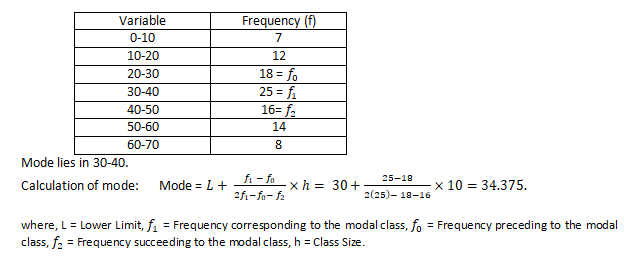
Calculate the mode for the following frequency distribution.
| Class | Frequency |
| 0-10 | 5 |
| 10-20 | 8 |
| 20-30 | 7 |
| 30-40 | 12 |
| 40-50 | 28 |
| 50-60 | 20 |
| 60-70 | 10 |
| 70-80 | 10 |
If true then enter $$1$$ and if false then enter $$0$$
Compute the mode of the following data:
| Class Interval | Frequency |
| 1-5 | 3 |
| 6-10 | 8 |
| 11-15 | 13 |
| 16-20 | 18 |
| 21-25 | 28 |
| 26-30 | 20 |
| 31-35 | 13 |
| 36-40 | 8 |
| 41-45 | 6 |
| 46-50 | 4 |
If true then enter $$1$$ and if false then enter $$0$$
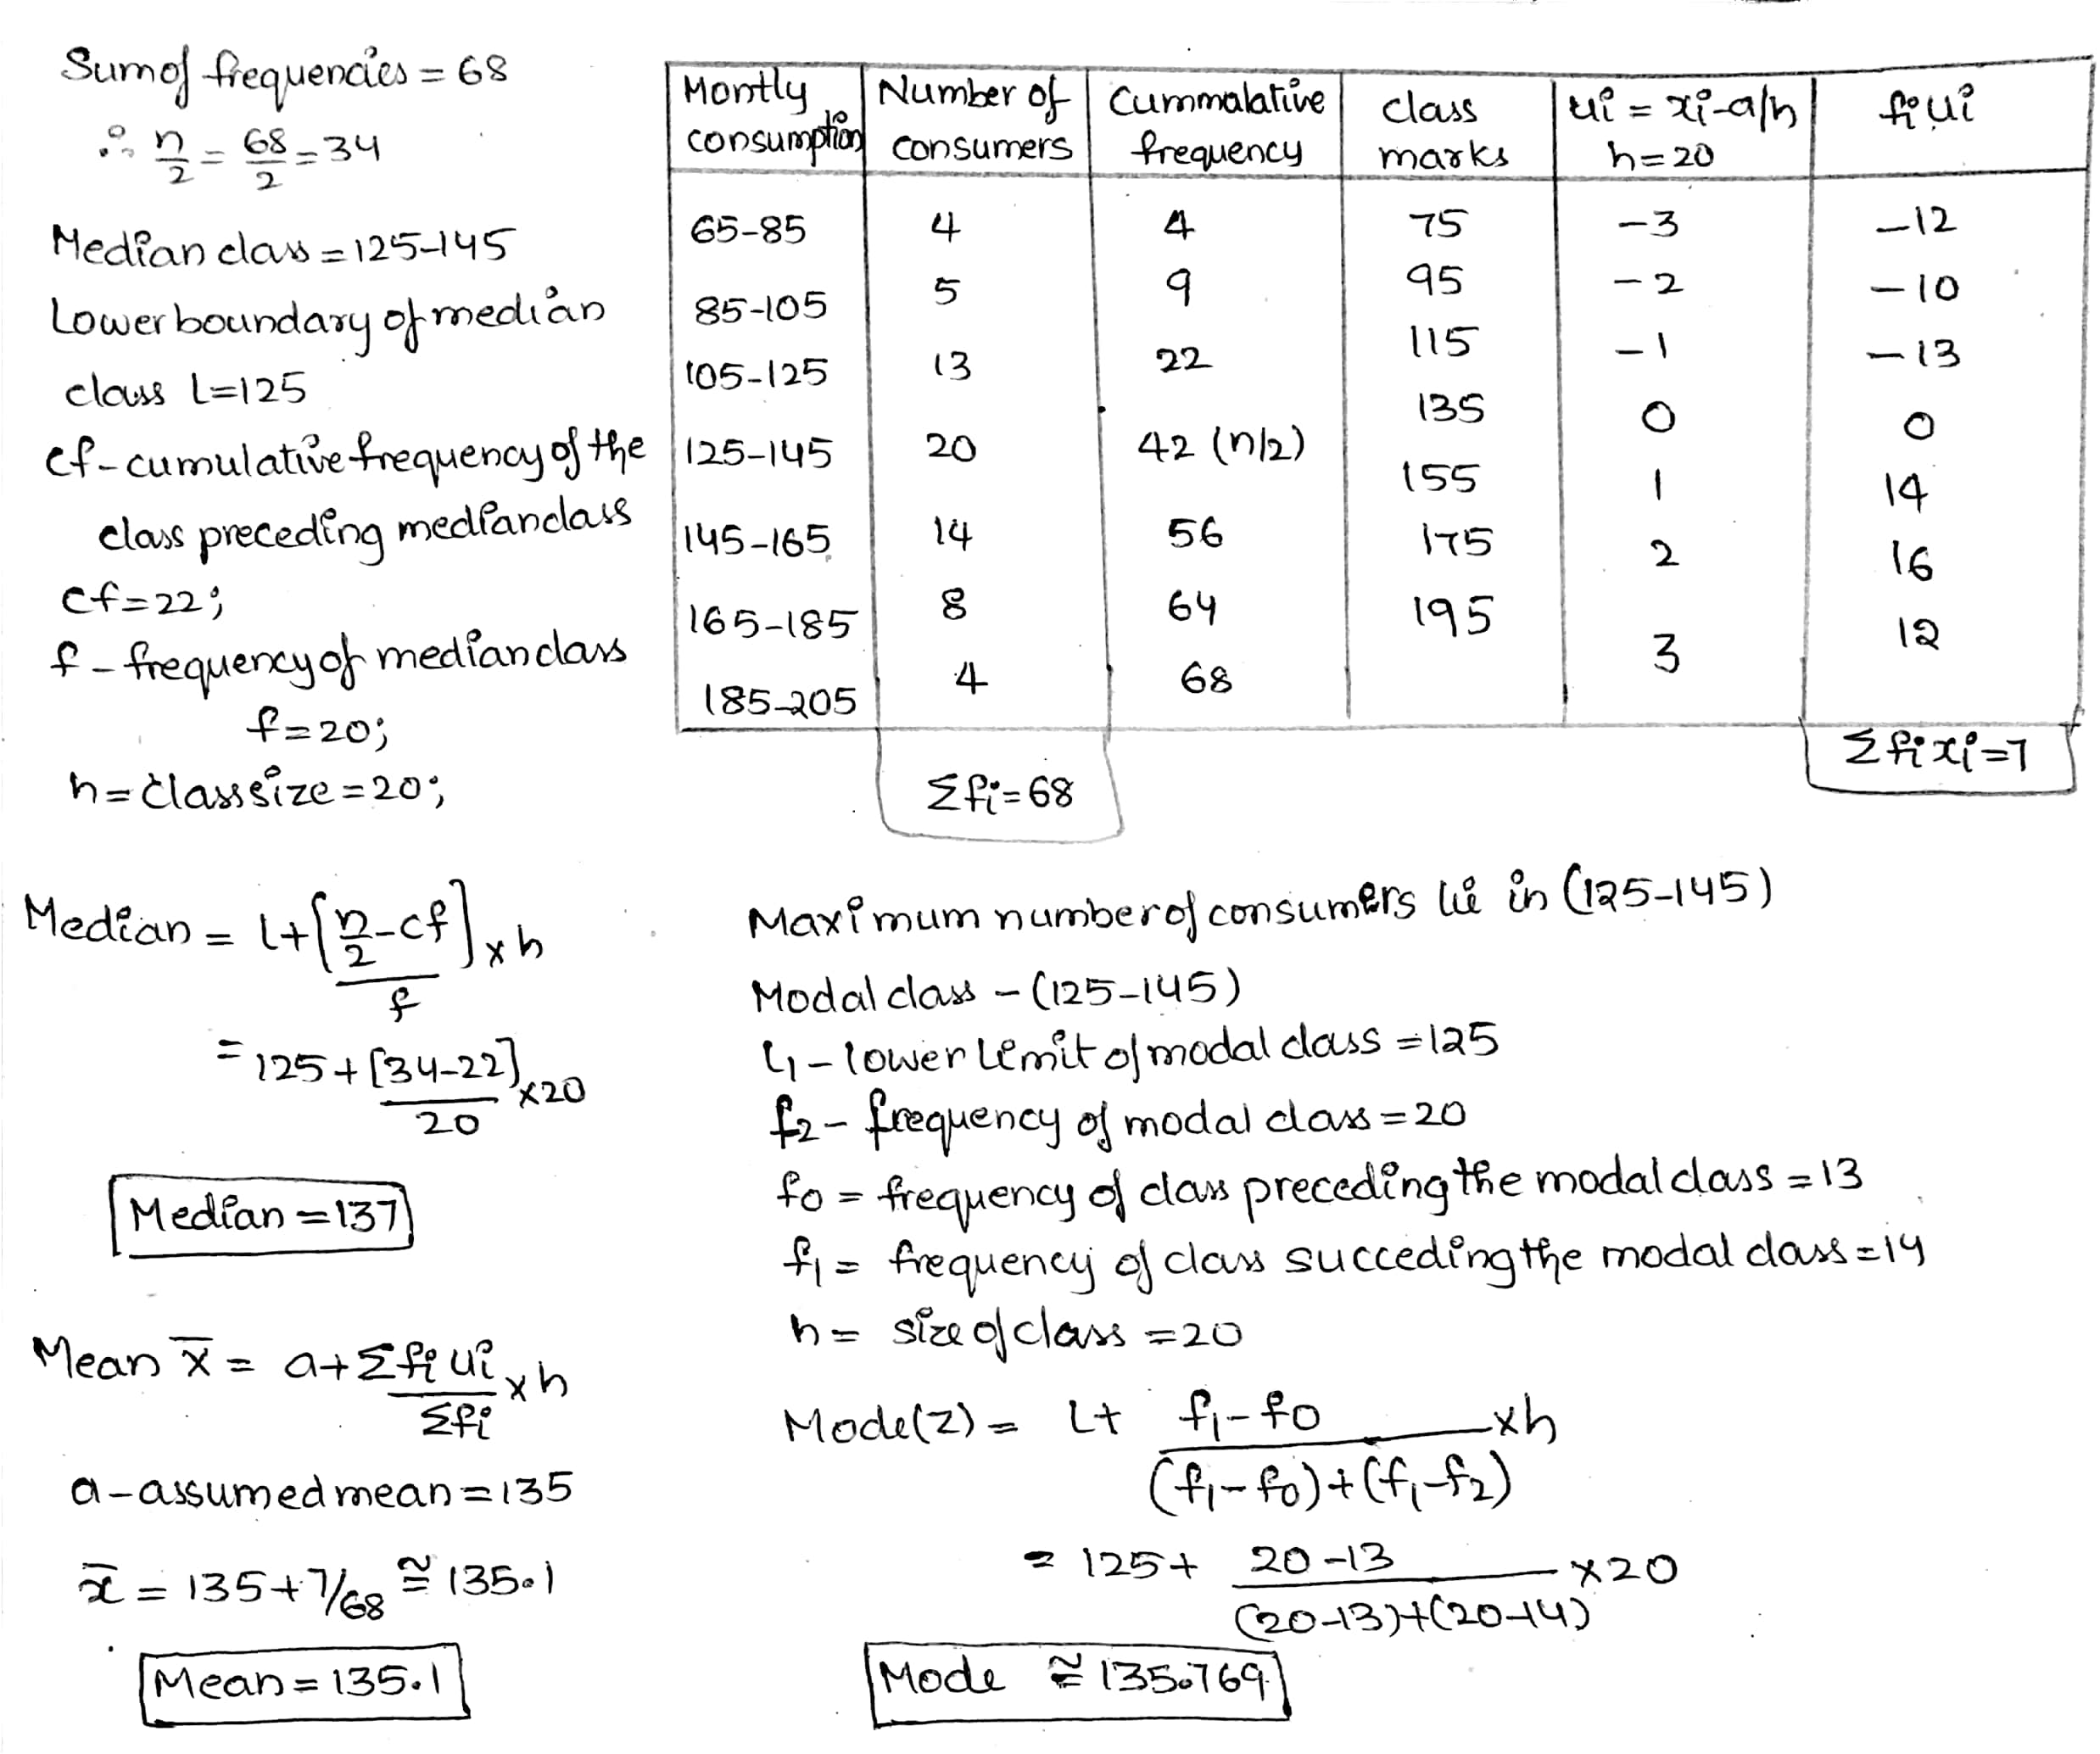
The following frequency distribution gives the monthly consumption of electricity of $$68$$ consumers of a locality. Find the median, mean and mode of the data and compare them.
| Monthly consumption (in units) | Number of consumers |
| 65-85 | 4 |
| 85-105 | 5 |
| 105-125 | 13 |
| 125-145 | 20 |
| 145-165 | 14 |
| 165-185 | 8 |
| 185-205 | 4 |
The following number of goals were scored by a team in a series of $$10$$ matches:
$$2$$,$$3$$,$$4$$,$$5$$,$$0$$,$$1$$,$$3$$,$$3$$,$$4$$,$$3$$
Find the mean, median and mode of these scores.
The following table shows the ages of the patients admitted in a hospital during a year.
| Age (in years) | No. of patients |
| 5-15 | 6 |
| 15-25 | 11 |
| 25-35 | 21 |
| 35-45 | 23 |
| 45-55 | 14 |
| 55-65 | 5 |
If the mode of the following distribution is given by $$M$$, then find the value of a nearest integer.
| Daily Wages | 31 - 36 | 37 - 42 | 43 - 48 | 49 - 54 | 55 - 60 | 61 - 66 |
| No.of workers | 6 | 12 | 20 | 15 | 9 | 4 |
The following table shows the age distribution of cases of a certain disease admitted during a year in a particular hospital
| Age (in Years) | 5 - 14 | 15 - 24 | 25 - 34 | 35 - 44 | 45 - 54 | 55 - 64 |
| No. of Cases | 6 | 11 | 21 | 23 | 14 | 5 |
The daily wages (in rupees) of $$100$$ workers in a factory are given below
| Daily wages (in Rs.) | $$125$$ | $$130$$ | $$135$$ | $$140$$ | $$145$$ | $$150$$ | $$160$$ | $$180$$ |
| No. of workers | $$6$$ | $$20$$ | $$24$$ | $$28$$ | $$15$$ | $$4$$ | $$2$$ | $$1$$ |
Calculate the median for the following distribution class
| Class | 0 - 10 | 10 - 20 | 20 - 30 | 30 - 40 | 40 - 50 | 50 - 60 |
| Frequency | 5 | 10 | 20 | 7 | 8 | 5 |
If the median of the following frequency distribution is $$46$$. find the absolute difference of missing frequencies
| Variable | $$10-20$$ | $$20-30$$ | $$30-40$$ | $$40-50$$ | $$50-60$$ | $$60-70$$ | $$70-80$$ | Total |
| Frequency | $$12$$ | $$30$$ | $$f_{1}$$ | $$65$$ | $$f_{2}$$ | $$25$$ | $$18$$ | $$229$$ |
Calculate the median from the following distribution
| Class | 5-10 | 10-15 | 15-20 | 20-25 | 25-30 |
| Frequency | 4 | 7 | 10 | 9 | 4 |
Calculate the mean deviation about median age for the age distribution of $$100$$ persons given below :
| Age | Number |
| 16-20 | 5 |
| 21-25 | 6 |
| 26-30 | 12 |
| 31-35 | 14 |
| 36-40 | 26 |
| 41-45 | 12 |
| 46-50 | 16 |
| 51-55 | 9 |
Find the mean deviation about the median for the data
| $$ \displaystyle X_{i} $$ | 15 | 21 | 27 | 30 | 35 |
| $$ \displaystyle f_{i} $$ | 3 | 5 | 6 | 7 | 8 |
Find the mean deviation about the median for the data
| $$ \displaystyle x_{i} $$ | 5 | 7 | 9 | 10 | 12 | 15 |
| $$ \displaystyle f_{i} $$ | 8 | 6 | 2 | 2 | 2 | 6 |
Find the mean deviation about median for the following data:
| Marks | Number of girls |
| 0-10 | 6 |
| 10-20 | 8 |
| 20-30 | 14 |
| 30-40 | 16 |
| 40-50 | 4 |
| 50-60 | 2 |
Find the median for the following frequency distribution table:
| Class-interval | $$0-5$$ | $$5-10$$ | $$10-15$$ | $$15-20$$ | $$20-25$$ | $$25-30$$ |
| Frequency | $$5$$ | $$3$$ | $$9$$ | $$10$$ | $$8$$ | $$5$$ |
Marks scored by Hari in $$5$$ test (out of $$25$$ marks) are given:
$$24, 22, 23, 23, 25$$. Find his average score
Find the median for the following frequency distribution table:
| Class Intervals | $$110-119$$ | $$120-129$$ | $$130-139$$ | $$140-149$$ | $$150-159$$ | $$160-169$$ |
| Frequency | $$6$$ | $$8$$ | $$15$$ | $$10$$ | $$6$$ | $$5$$ |
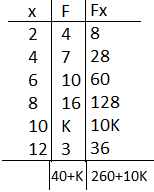
If the mean of the following frequency distribution is $$7.2$$ find value of $$'K'$$.
| $$x$$ | $$2$$ | $$4$$ | $$6$$ | $$8$$ | $$10$$ | $$12$$ |
| $$f$$ | $$4$$ | $$7$$ | $$10$$ | $$16$$ | $$K$$ | $$3$$ |
The heights of boys and girls of IX class of a school are given below.
| Height (cm) | $$135$$ | $$140$$ | $$147$$ | $$152$$ | $$155$$ | $$160$$ |
| Boys | $$2$$ | $$5$$ | $$12$$ | $$10$$ | $$7$$ | $$1$$ |
| Girls | $$1$$ | $$2$$ | $$10$$ | $$5$$ | $$6$$ | $$5$$ |
Find the mean for the given frequency distribution table.
| Class - Interval | Frequency |
| $$0 - 4$$ | $$3$$ |
| $$5 - 9$$ | $$5$$ |
| $$10 - 14$$ | $$7$$ |
| $$15 - 19$$ | $$4$$ |
| $$20 - 24$$ | $$6$$ |
| $$N = 24$$ |
Calculate the median for an exclusive (continuous) distribution given below.
| Class Interval | Frequency |
| $$10 - 20$$ | $$11$$ |
| $$20 - 30$$ | $$13$$ |
| $$30 - 40$$ | $$13$$ |
| $$40 - 50$$ | $$9$$ |
| $$50 - 60$$ | $$4$$ |
Find the median for the following grouped data.
| Class - Interval | Frequency |
| $$1 - 5$$ | $$4$$ |
| $$6 - 10$$ | $$3$$ |
| $$11 - 15$$ | $$6$$ |
| $$16 - 20$$ | $$5$$ |
| $$21 - 25$$ | $$2$$ |
| $$N = 20$$ |
Weights of parcels in a transport office are given below.
| Weight (kg) | $$50$$ | $$65$$ | $$75$$ | $$90$$ | $$110$$ | $$120$$ |
| No of parcels | $$25$$ | $$34$$ | $$38$$ | $$40$$ | $$47$$ | $$16$$ |
The maximum bowling speed $$(km/hr)$$ of $$33$$ players at a cricket coaching centre is given below:Bowling Speed $$(km/hr)$$ $$85-100$$ $$100-115$$ $$115-130$$ $$130-145$$ Number of players $$9$$ $$11$$ $$8$$ $$5$$
Find the modal bowling speed (in $$km/hr$$) of players.
| Bowling Speed $$(km/hr)$$ | $$85-100$$ | $$100-115$$ | $$115-130$$ | $$130-145$$ |
| Number of players | $$9$$ | $$11$$ | $$8$$ | $$5$$ |
Find the mode and median of the following frequency distribution:
| $$x$$ | $$10$$ | $$11$$ | $$12$$ | $$13$$ | $$14$$ | $$15$$ |
| $$f$$ | $$1$$ | $$4$$ | $$7$$ | $$5$$ | $$9$$ | $$8$$ |
For a certain frequency distribution, the value of Mean is $$101$$ and Median is $$100$$. Find the value of Mode.
The weight of coffee (in $$gms$$) in $$70$$ packets is given in the following table.
| Weight (in $$gms$$) | No. of Packets |
| $$200-201$$ | $$12$$ |
| $$201-202$$ | $$26$$ |
| $$202-203$$ | $$20$$ |
| $$203-204$$ | $$9$$ |
| $$204-205$$ | $$2$$ |
| $$205-206$$ | $$1$$ |
The marks obtained by $$30$$ students in a class assessment of $$5$$ marks is given below :
| Marks | 0 | 1 | 2 | 3 | 4 | 5 |
| Number of Students | 1 | 3 | 6 | 10 | 5 | 5 |
(Use a graph paper for this question.) The daily pocket expenses of $$200$$ students in a school are given below:
| Pocket expenses (in Rs) | $$0 - 5$$ | $$5 - 10$$ | $$10 - 15$$ | $$15 - 20$$ | $$20 - 25$$ | $$25 - 30$$ | $$30 - 35$$ | $$35 - 40$$ |
| Number of students (frequency) | $$10$$ | $$14$$ | $$28$$ | $$42$$ | $$50$$ | $$30$$ | $$14$$ | $$12$$ |
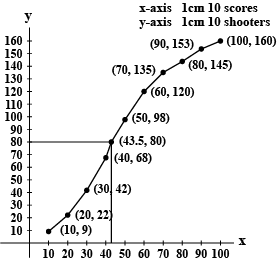
The table shows the distribution of the scores obtained by $$160$$ shooters in a shooting competition. Use a graph sheet and draw an ogive for the distribution.
| Scores | No. of shooters |
| $$0-10$$ | $$9$$ |
| $$10-20$$ | $$13$$ |
| $$20-30$$ | $$20$$ |
| $$30-40$$ | $$26$$ |
| $$40-50$$ | $$30$$ |
| $$50-60$$ | $$22$$ |
| $$60-70$$ | $$15$$ |
| $$70-80$$ | $$10$$ |
| $$80-90$$ | $$8$$ |
| $$90-100$$ | $$7$$ |
| Scores | No. of shooters | c.f. |
| $$0-10$$ | $$9$$ | $$9$$ |
| $$10-20$$ | $$13$$ | $$22$$ |
| $$20-30$$ | $$20$$ | $$42$$ |
| $$30-40$$ | $$26$$ | $$68$$ |
| $$40-50$$ | $$30$$ | $$98$$ |
| $$50-60$$ | $$22$$ | $$120$$ |
| $$60-70$$ | $$15$$ | $$135$$ |
| $$70-80$$ | $$10$$ | $$145$$ |
| $$80-90$$ | $$8$$ | $$153$$ |
| $$90-100$$ | $$7$$ | $$160$$ |
Since, no. of terms, $$n = 160$$ which is even
$$\therefore Median = \left (\dfrac {n}{2}\right )^{th} term$$
$$= \left (\dfrac {160}{2}\right )^{th} term = 80th\ term$$
From the graph, $$m_{e} = 43.5$$
| Age (in years) | $$10-20$$ | $$20-30$$ | $$30-40$$ | $$40-50$$ | $$50-60$$ | $$60-70$$ |
| No. of patients | $$60$$ | $$42$$ | $$55$$ | $$70$$ | $$53$$ | $$20$$ |
Find the mode of the following data.
1) $$74, 81, 62, 58, 77, 74$$.
2) $$43, 36, 27, 25, 36, 66, 20, 25$$.
3) $$55, 51, 62, 71, 50, 32$$.
4) $$24, 20, 27, 32, 20, 28, 20$$.
Calculate the arithmetic mean by assumed mean method for the data given below.
| Marks | $$0-10$$ | $$10-20$$ | $$20-30$$ | $$30-40$$ | $$40-50$$ | $$50-60$$ |
| No. of students | $$5$$ | $$10$$ | $$25$$ | $$30$$ | $$20$$ | $$10$$ |
Find the mode for the following frequency table.
| x | $$5$$ | $$10$$ | $$15$$ | $$20$$ | $$25$$ | $$30$$ |
| f | $$14$$ | $$25$$ | $$37$$ | $$16$$ | $$8$$ | $$5$$ |
Obtain the mean of the following data.
| $$x$$ | $$5$$ | $$10$$ | $$15$$ | $$20$$ | $$25$$ |
| $$f$$ | $$3$$ | $$10$$ | $$25$$ | $$7$$ | $$5$$ |
Find the median for marks of $$50$$ students.
| Marks | $$20$$ | $$27$$ | $$34$$ | $$43$$ | $$58$$ | $$65$$ | $$89$$ |
| Number of students | $$2$$ | $$4$$ | $$6$$ | $$11$$ | $$12$$ | $$8$$ | $$7$$ |
From the following table compute arithmetic mean by direct method.
| Marks | $$0-10$$ | $$10-20$$ | $$20-30$$ | $$30-40$$ | $$40-50$$ | $$50-60$$ |
| No. of students | $$5$$ | $$10$$ | $$25$$ | $$30$$ | $$20$$ | $$10$$ |
The mean mark of $$100$$ students was found to be $$40$$. Later on, it was found that a score of $$53$$ was misread as $$83$$. Find the correct mean corresponding to the correct score.
The hearts of $$60$$ patients were examined through X-ray and the observations obtained are given. Find the median.
| Diameter of heart(in mm) | $$130$$ | $$131$$ | $$132$$ | $$133$$ | $$134$$ | $$135$$ |
| Number of patients | $$7$$ | $$9$$ | $$15$$ | $$12$$ | $$6$$ | $$11$$ |
The height (in cm) of $$50$$ students in a particular class are given. Find the median.
| Height (in cm) | $$156$$ | $$155$$ | $$154$$ | $$153$$ | $$152$$ | $$151$$ | $$150$$ |
| Number of students | $$8$$ | $$4$$ | $$6$$ | $$10$$ | $$12$$ | $$3$$ | $$7$$ |
The salary of $$43$$ employees are given in the following table. Find the median.
| Salary (in Rs) | $$4000$$ | $$5500$$ | $$6000$$ | $$8250$$ | $$10,000$$ | $$17,000$$ | $$25,000$$ |
| Number of employees | $$7$$ | $$5$$ | $$4$$ | $$3$$ | $$13$$ | $$8$$ | $$3$$ |
Calculate the mode of the following data.
| Size of item | $$10-15$$ | $$15-20$$ | $$20-25$$ | $$25-30$$ | $$30-35$$ | $$35-40$$ | $$40-45$$ | $$45-50$$ |
| No. of items | $$4$$ | $$8$$ | $$18$$ | $$30$$ | $$20$$ | $$10$$ | $$5$$ | $$2$$ |
Find the median for the following distribution.
| Value | $$1$$ | $$2$$ | $$3$$ | $$4$$ | $$5$$ | $$6$$ |
| $$f$$ | $$1$$ | $$3$$ | $$2$$ | $$4$$ | $$8$$ | $$2$$ |
A shoe shop in Chennai sold hundred pairs of shoes of a particular brand in a certain day with the following distribution.
| Size of shoe | $$4$$ | $$5$$ | $$6$$ | $$7$$ | $$8$$ | $$9$$ | $$10$$ |
| No. of pairs sold | $$2$$ | $$5$$ | $$3$$ | $$23$$ | $$39$$ | $$27$$ | $$1$$ |
Calculate the median for the following data.
| Marks | $$20$$ | $$9$$ | $$25$$ | $$50$$ | $$40$$ | $$80$$ |
| No. of students | $$6$$ | $$4$$ | $$16$$ | $$7$$ | $$8$$ | $$2$$ |
Find the median for the following distribution.
| Wages (Rupees in hundreds) | $$0-10$$ | $$10-20$$ | $$20-30$$ | $$30-40$$ | $$40-50$$ |
| No. of workers | $$22$$ | $$38$$ | $$46$$ | $$35$$ | $$20$$ |
Calculate the mode of the following data.
| Size of shoe | $$4$$ | $$5$$ | $$6$$ | $$7$$ | $$8$$ | $$9$$ | $$10$$ |
| No. of pairs sold | $$15$$ | $$17$$ | $$13$$ | $$21$$ | $$18$$ | $$16$$ | $$11$$ |
The following table gives the distribution of the average weekly wages of $$800$$ workers in a factory. Calculate the median for the data given below.
| Wages ( in hundreds) | $$20-25$$ | $$25-30$$ | $$30-35$$ | $$35-40$$ | $$40-45$$ | $$45-50$$ | $$50-55$$ | $$55-60$$ |
| No. of persons | $$50$$ | $$70$$ | $$100$$ | $$180$$ | $$150$$ | $$120$$ | $$70$$ | $$60$$ |
Calculate the median for the following data
| Class interval | $$1 - 5$$ | $$6 - 10$$ | $$11 - 15$$ | $$16 - 20$$ | $$21 - 25$$ | $$26 - 30$$ | $$31 - 35$$ |
| Frequency | $$1$$ | $$18$$ | $$25$$ | $$26$$ | $$7$$ | $$2$$ | $$1$$ |
Find the median for the following data.
| Age group | $$0-9$$ | $$10-19$$ | $$20-29$$ | $$30-39$$ | $$40-49$$ | $$50-59$$ | $$60-69$$ |
| No. of persons | $$4$$ | $$6$$ | $$10$$ | $$11$$ | $$12$$ | $$6$$ | $$1$$ |
Find the median for the following data.
| Marks | $$11-15$$ | $$16-20$$ | $$21-25$$ | $$26-30$$ | $$31-35$$ | $$36-40$$ |
| Frequency | $$7$$ | $$10$$ | $$13$$ | $$26$$ | $$9$$ | $$5$$ |
The following is the distribution of the size of certain farms from a taluka (tehasil). Find median size of farms.
| Size of Farms(in acres) | Number of Farms |
| $$5-15$$ | $$7$$ |
| $$15-25$$ | $$12$$ |
| $$25-35$$ | $$17$$ |
| $$35-45$$ | $$25$$ |
| $$45-55$$ | $$31$$ |
| $$55-65$$ | $$5$$ |
| $$65-75$$ | $$3$$ |
Find the median of the following frequency distribution
| Class | $$4-8$$ | $$8-12$$ | $$12-16$$ | $$16-20$$ | $$20-24$$ | $$24-28$$ |
| Frequency | $$9$$ | $$16$$ | $$12$$ | $$7$$ | $$15$$ | $$1$$ |
In Hostel, one day reading hours of $$20$$ students was observed, whose result is mentioned in the table below. Form the table, find the Mode.
| No. of reading hours | 1-3 | 3-5 | 5-7 | 7-9 | 9-11 |
| Student's strength in the hostel | $$7$$ | $$2$$ | $$8$$ | $$2$$ | $$1$$ |
Find the median of the following frequency distribution:
| Class | 0-100 | 100-200 | 200-300 | 300-400 | 400-500 | 500-600 |
| Frequency | $$64$$ | $$62$$ | $$84$$ | $$72$$ | $$66$$ | $$52$$ |
Find the mean, mode and median of marks obtained by $$20$$ students in an examination. The marks are given below.
| Marks | $$0-10$$ | $$10-20$$ | $$20-30$$ | $$30-40$$ | $$40-50$$ |
| No. of students | $$1$$ | $$4$$ | $$5$$ | $$8$$ | $$2$$ |
Find the mode for the following frequency distribution.
| Class | $$4-8$$ | $$8-12$$ | $$12-16$$ | $$16-20$$ | $$20-24$$ | $$24-28$$ |
| Frequency | $$9$$ | $$6$$ | $$12$$ | $$7$$ | $$15$$ | $$3$$ |
The age (in years) of $$150$$ patients getting medical treatment in a hospital in a month are given below. Obtain its mode.
| Age (yrs) | $$10-20$$ | $$20-30$$ | $$30-40$$ | $$40-50$$ | $$50-60$$ | $$60-70$$ |
| No. of patients | $$12$$ | $$14$$ | $$36$$ | $$50$$ | $$20$$ | $$18$$ |
For the following data obtain the mode.
| Weight (in kg) | $$21-25$$ | $$26-30$$ | $$31-35$$ | $$36-40$$ | $$41-45$$ | $$46-50$$ | $$51-55$$ | $$56-60$$ |
| No. of students | $$5$$ | $$4$$ | $$3$$ | $$18$$ | $$20$$ | $$14$$ | $$8$$ | $$3$$ |
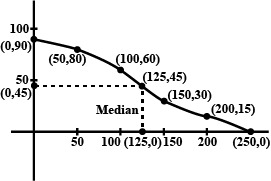
The cumulative frequency "more than type" is given in the following table.
Find the median of the following data.
| Wages | $$\geq 0$$ | $$\geq 50$$ | $$\geq 100$$ | $$\geq 150$$ | $$\geq 200$$ | $$\geq 250$$ |
| Cumulative Frequency | 90 | 80 | 60 | 30 | 15 | 0 |
| Wages | Frequency | Cumulative Frequency($$c.f$$) |
| $$\geq 0$$ | $$10$$ | $$90$$ |
| $$\geq 50$$ | $$20$$ | $$80$$ |
| $$\geq 100$$ | $$30$$ | $$60$$ |
| $$\geq 150$$ | $$15$$ | $$30$$ |
| $$\geq 200$$ | $$15$$ | $$15$$ |
| $$\geq 250$$ | $$0$$ | $$0$$ |
Therefore, $$\dfrac{100+150}{2}=125$$ is the median.
Find the Median from the following table-
| Class Interval | $$0-20$$ | $$20-40$$ | $$40-60$$ | $$60-80$$ | $$80-100$$ |
| Frequency | $$10$$ | $$17$$ | $$26$$ | $$22$$ | $$15$$ |
The table below shows the number of workers doing various jobs in a factory and their daily wages.
| Daily wages (Rupees) | Number of workers |
| 225 | 4 |
| 250 | 7 |
| 270 | 9 |
| 300 | 5 |
| 350 | 3 |
| 400 | 2 |
The table below shows the classification of people, participated in a medical camp, according to their weights.
| Weight (in kilogram) | Number of people |
| $$20-30$$ | $$16$$ |
| $$30-40$$ | $$21$$ |
| $$40-50$$ | $$28$$ |
| $$50-60$$ | $$24$$ |
| $$60-70$$ | $$11$$ |
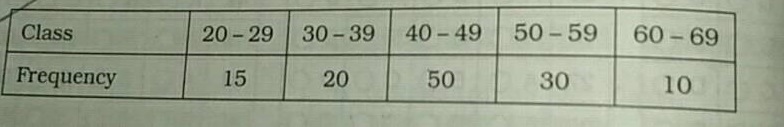
Find the mode of the given data:
Class 20-29 30-39 40-49 50-59 60-69 Frequency 15 20 50 30 10
| Class | 20-29 | 30-39 | 40-49 | 50-59 | 60-69 |
| Frequency | 15 | 20 | 50 | 30 | 10 |
The table below shows the number of students in the Maths Club of a school, classified according to their heights.
| Height (cm) | Number of students |
| 110-120 | 4 |
| 120-1330 | 24 |
| 130-140 | 20 |
| 140-150 | 32 |
| 150-160 | 20 |
The scores obtained by $$50$$ students in an examination is tabulated as shown below.
| Score | Number of students |
| below $$10$$ | $$3$$ |
| below $$20$$ | $$7$$ |
| below $$30$$ | $$13$$ |
| below $$40$$ | $$22$$ |
| below $$50$$ | $$32$$ |
| below $$60$$ | $$40$$ |
| below $$70$$ | $$46$$ |
| below $$80$$ | $$50$$ |
Find the mode of the following frequency table:
| Class Interval | Frequency |
| $$140-150$$ | $$4$$ |
| $$150-160$$ | $$6$$ |
| $$160-170$$ | $$10$$ |
| $$170-180$$ | $$12$$ |
| $$180-190$$ | $$9$$ |
| $$190-200$$ | $$3$$ |
Following are marks obtained in Mathematics by students of Class X.
| Marks obtained | 0-10 | 10-20 | 20-30 | 30-40 | 40-50 | 50-60 | 60-70 |
| No. of students | $$2$$ | $$10$$ | $$12$$ | $$15$$ | $$13$$ | $$8$$ | $$4$$ |
If median of the following frequency distribution is 35 then find the value of x.
| Class interval | 0-10 | 10-20 | 20-30 | 30-40 | 40-50 | 50-60 | 60-70 |
| Frequency | 2 | 3 | x | 6 | 5 | 3 | 2 |
Find mode for given data:
| Class | 20-29 | 30-39 | 40-49 | 50-59 | 60-69 |
| Frequency | 15 | 20 | 50 | 30 | 10 |
The table below shows the daily expenditure on food of $$25$$ households in a locality.
| Daily expenditure (in Rs.) | 100-150 | 150-200 | 200-250 | 250-300 | 300-350 |
| Number of households: | $$4$$ | $$5$$ | $$12$$ | $$2$$ | $$2$$ |
The marks obtained by $$50$$ students of class $$10$$ out of $$80$$ marks are given in the following frequency distribution. Find the median.
| Class | $$0-10$$ | $$10-20$$ | $$20-30$$ | $$30-40$$ | $$40-50$$ | $$50-60$$ | $$60-70$$ | $$70-80$$ |
| Frequency | $$2$$ | $$5$$ | $$8$$ | $$16$$ | $$9$$ | $$5$$ | $$3$$ | $$2$$ |
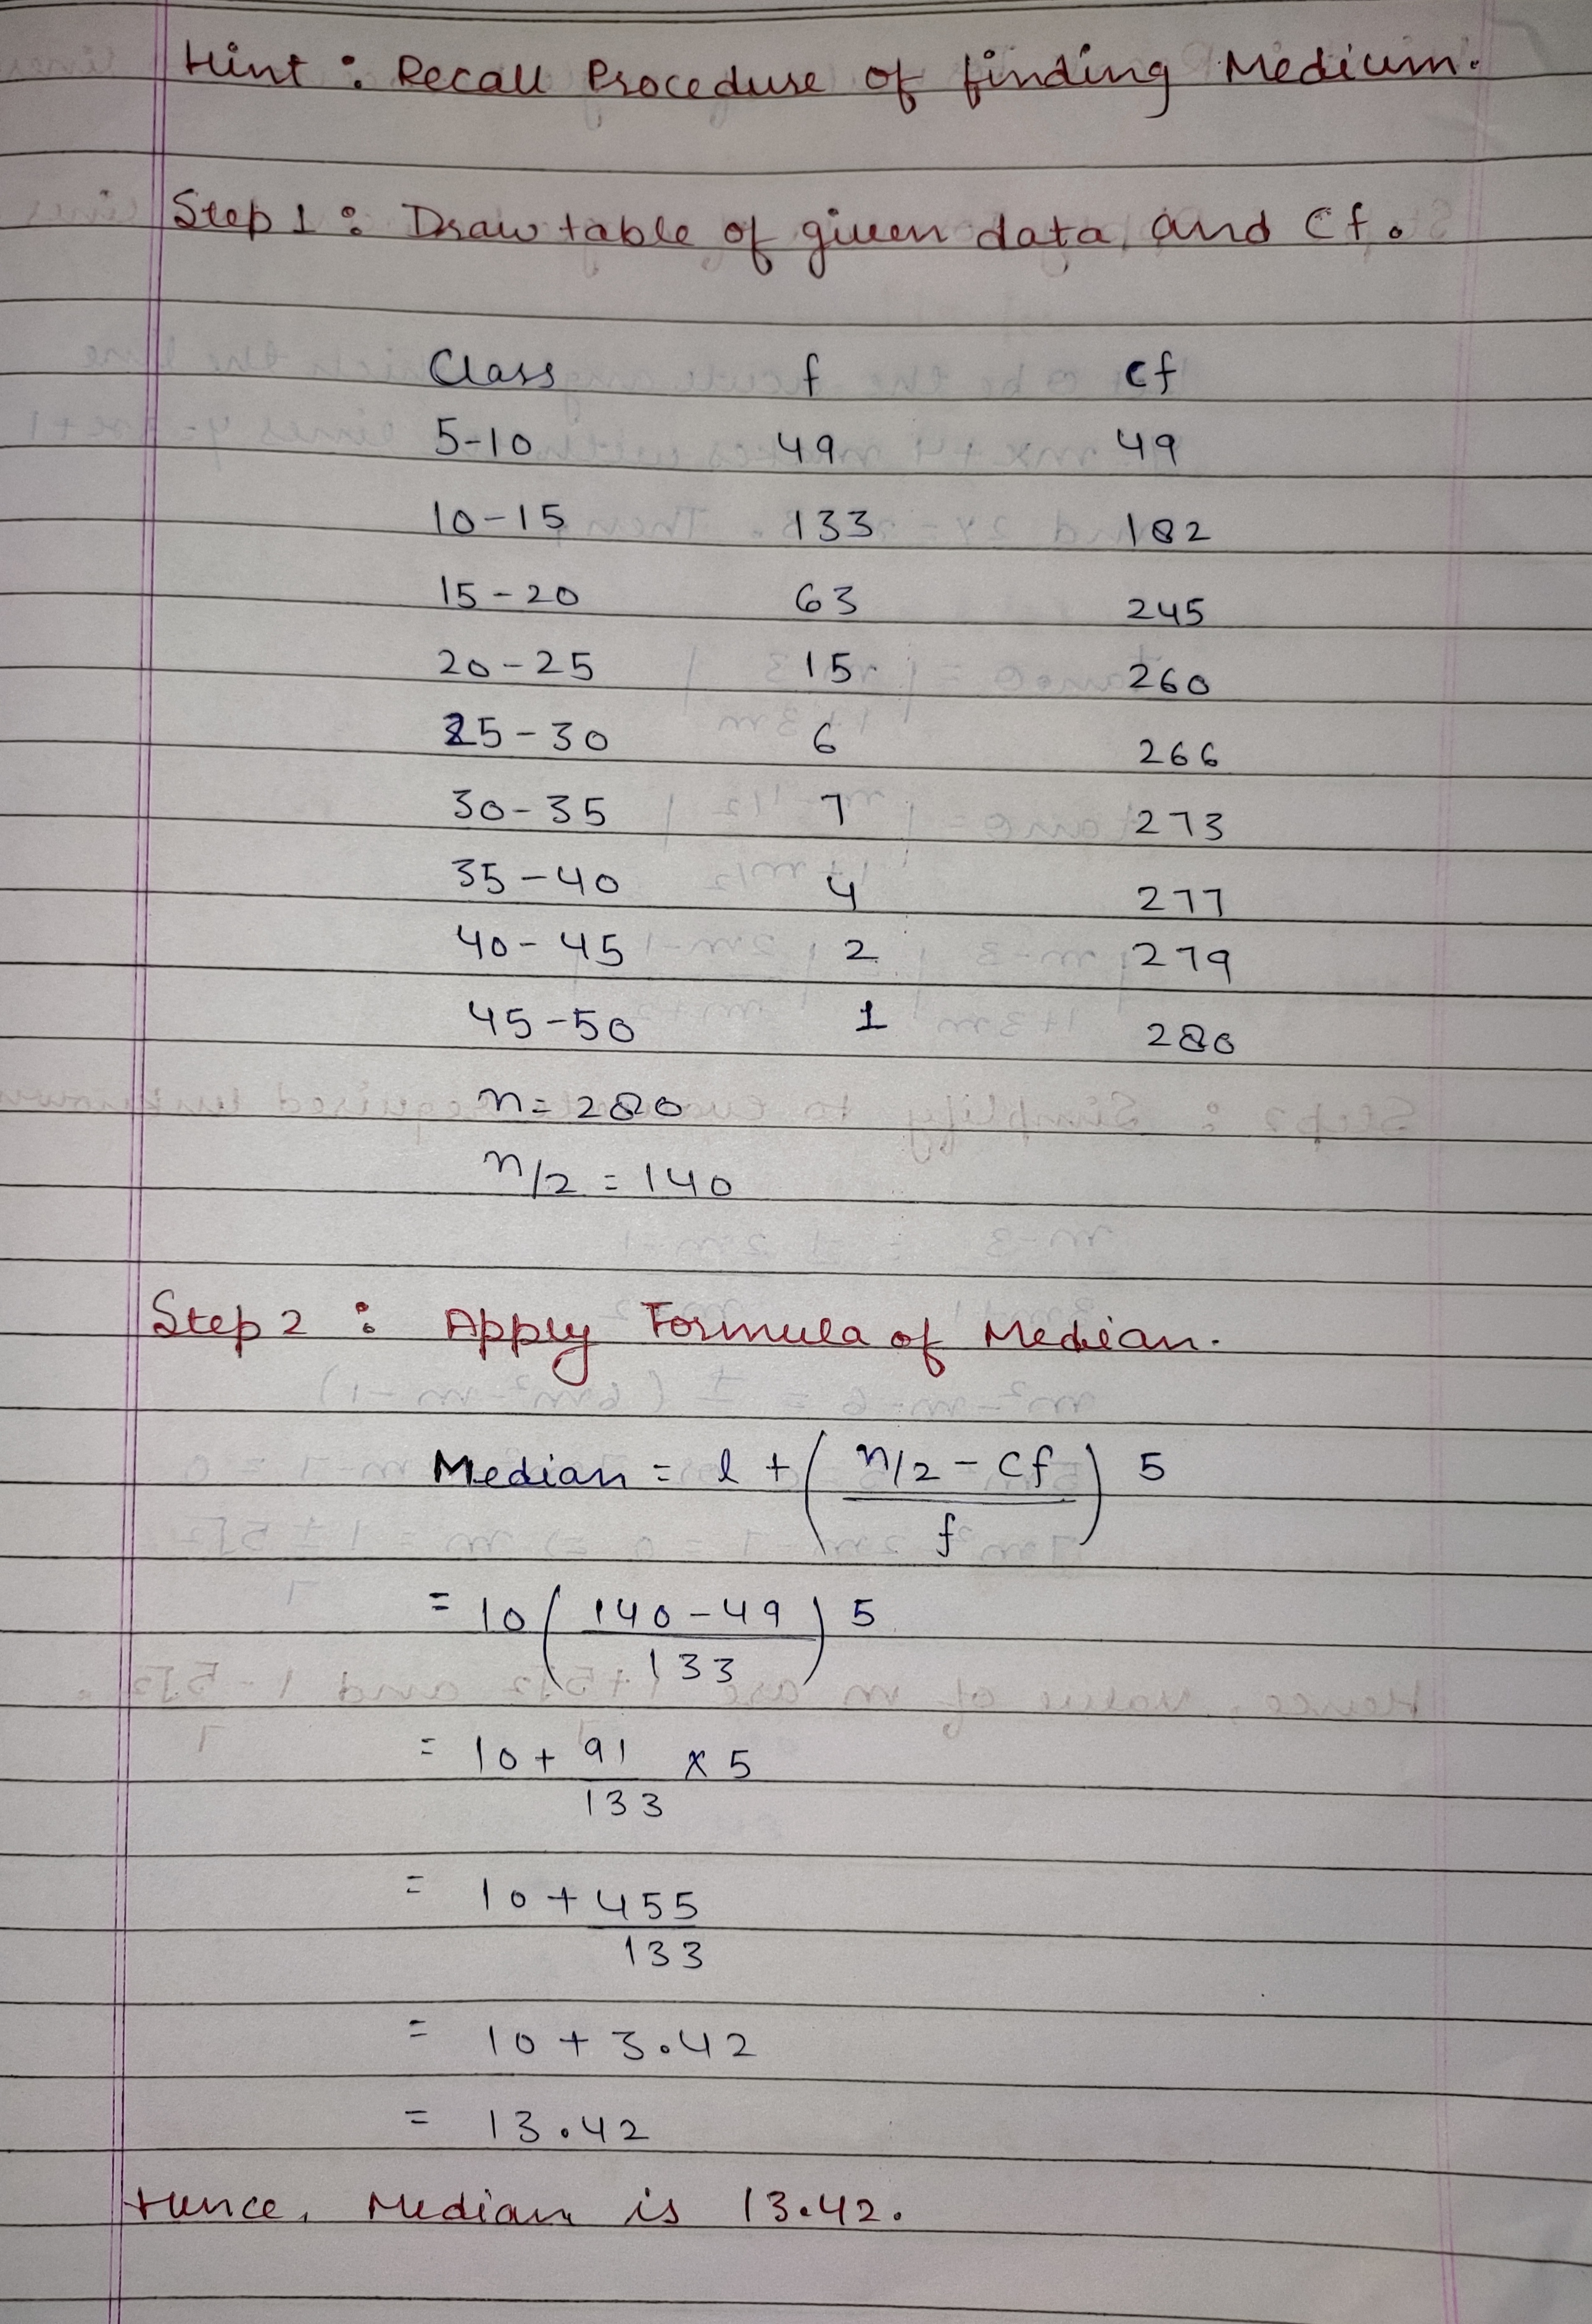
Calculate the median of the following frequency distribution.
| $$class $$ | $$f$$ | |
| $$5-10$$ | $$49$$ | |
| $$10-15$$ | $$133$$ | |
| $$15-20$$ | $$63$$ | |
| $$20-25$$ | $$15$$ | |
| $$25-30$$ | $$6$$ | |
| $$30-35$$ | $$7$$ | |
| $$35-40$$ | $$4$$ | |
| $$40-45$$ | $$2$$ | |
| $$45-50$$ | $$1$$ |
Compute the median for each of the following data:
| (i)Marks | No. of students | (ii)Marks | No. of students |
| Less than $$10$$ | $$0$$ | More than $$150$$ | $$0$$ |
| Less than $$30$$ | $$10$$ | More than $$140$$ | $$12$$ |
| Less than $$50$$ | $$25$$ | More than $$130$$ | $$27$$ |
| Less than $$70$$ | $$43$$ | More than $$120$$ | $$60$$ |
| Less than $$90$$ | $$65$$ | More than $$110$$ | $$105$$ |
| Less than $$110$$ | $$87$$ | More than $$100$$ | $$124$$ |
| Less than $$130$$ | $$96$$ | More than $$90$$ | $$141$$ |
| Less than $$150$$ | $$100$$ | More than $$80$$ | $$150$$ |
Calculate the missing frequency from the following distribution, it being given that the median of the distribution is $$24$$.
| Age in years | 0-10 | 10-20 | 20-30 | 30-40 | 40-50 |
| No. of persons | $$5$$ | $$25$$ | ? | $$18$$ | $$7$$ |
The following table gives the literacy rate (in percentage) of $$35$$ cities.
| Class interval | $$45-55$$ | $$55-65$$ | $$65-75$$ | $$75-85$$ | $$85-95$$ |
| No. of cities | $$3$$ | $$10$$ | $$11$$ | $$8$$ | $$3$$ |
The following is the distribution of height of students of a certain class in a certain city:
| Height (in cms): | 160-162 | 163-165 | 166-168 | 169-171 | 172-174 |
| No. of students: | $$15$$ | $$118$$ | $$142$$ | $$127$$ | $$18$$ |
Following is the distribution of I.Q. of $$100$$ students. Find the median I.Q.
| I.Q. | $$55-64$$ | $$65-74$$ | $$75-84$$ | $$85-94$$ | $$95-104$$ | $$105-114$$ | $$115-124$$ | $$125-134$$ | $$135-144$$ |
| No. of students | $$1$$ | $$2$$ | $$9$$ | $$22$$ | $$33$$ | $$22$$ | $$8$$ | $$2$$ | $$1$$ |
To find out the concentration of $${SO}_{2}$$ in the air (in parts per million, i.e., $$ppm$$), the data was collected for $$30$$ localities in certain city and is presented below:
| Concentration of $${SO}_{2}$$(in ppm) | Frequency |
| $$0.00-0.04$$ | $$4$$ |
| $$0.04-0.08$$ | $$9$$ |
| $$0.08-0.12$$ | $$9$$ |
| $$0.12-0.16$$ | $$2$$ |
| $$0.16-0.20$$ | $$4$$ |
| $$0.20-0.24$$ | $$2$$ |
Calculate the median from the following data:
| Rent In Rs. | 15-25 | 25-35 | 35-45 | 45-55 | 55-65 | 65-75 | 75-85 | 85-95 |
| No. of Houses | $$8$$ | $$10$$ | $$15$$ | $$25$$ | $$40$$ | $$20$$ | $$15$$ | $$7$$ |
A class teacher has the following absentee record of $$40$$ students of a class for the whole term. Find the mean number of days a student was absent.
| Number of days: | 0-6 | 6-10 | 10-14 | 14-20 | 20-28 | 28-38 | 38-40 |
| Number of students: | $$11$$ | $$10$$ | $$7$$ | $$4$$ | $$4$$ | $$3$$ | $$1$$ |
The following table gives the frequency distribution of married women by age at marriage:
| Age (in years) | Frequency | Age (in years) | Frequency |
| $$15-19$$ | $$53$$ | $$40-44$$ | $$9$$ |
| $$20-24$$ | $$140$$ | $$45-49$$ | $$5$$ |
| $$25-29$$ | $$98$$ | $$50-54$$ | $$3$$ |
| $$30-34$$ | $$32$$ | $$55-59$$ | $$3$$ |
| $$35-39$$ | $$12$$ | $$60$$ and above | $$2$$ |
Calculate the median from the following data:
| Marks below: | 10 | 20 | 30 | 40 | 50 | 60 | 70 | 80 |
| No. of students | $$15$$ | $$35$$ | $$60$$ | $$84$$ | $$96$$ | $$127$$ | $$198$$ | $$250$$ |
For the following grouped frequency distribution find the mode:
| Class: | $$3-6$$ | $$6-9$$ | $$9-12$$ | $$12-15$$ | $$15-18$$ | $$18-21$$ | $$21-24$$ |
| Frequency: | $$2$$ | $$5$$ | $$10$$ | $$23$$ | $$21$$ | $$12$$ | $$3$$ |
The given distribution shows the number of runs scored by some top batsmen of the world in one-day international cricket matches.
| Runs scored | Number of batsman | Runs scored | Number of batsman |
| $$3000-4000$$ | $$4$$ | $$7000-8000$$ | $$6$$ |
| $$4000-5000$$ | $$18$$ | $$8000-9000$$ | $$3$$ |
| $$5000-6000$$ | $$9$$ | $$9000-10000$$ | $$1$$ |
| $$6000-7000$$ | $$7$$ | $$10000-11000$$ | $$1$$ |
Compute the value of mode for the following frequency distribution.
| Class: | 100-110 | 110-120 | 120-130 | 130-140 | 140-150 | 150-160 | 160-170 |
| Frequency: | 4 | 6 | 20 | 32 | 33 | 8 | 2 |
If the mean of the following distribution is 6, find the value of p.
| x: | $$2$$ | $$4$$ | $$6$$ | $$10$$ | $$p+5$$ |
| f: | $$3$$ | $$2$$ | $$3$$ | $$1$$ | $$2$$ |
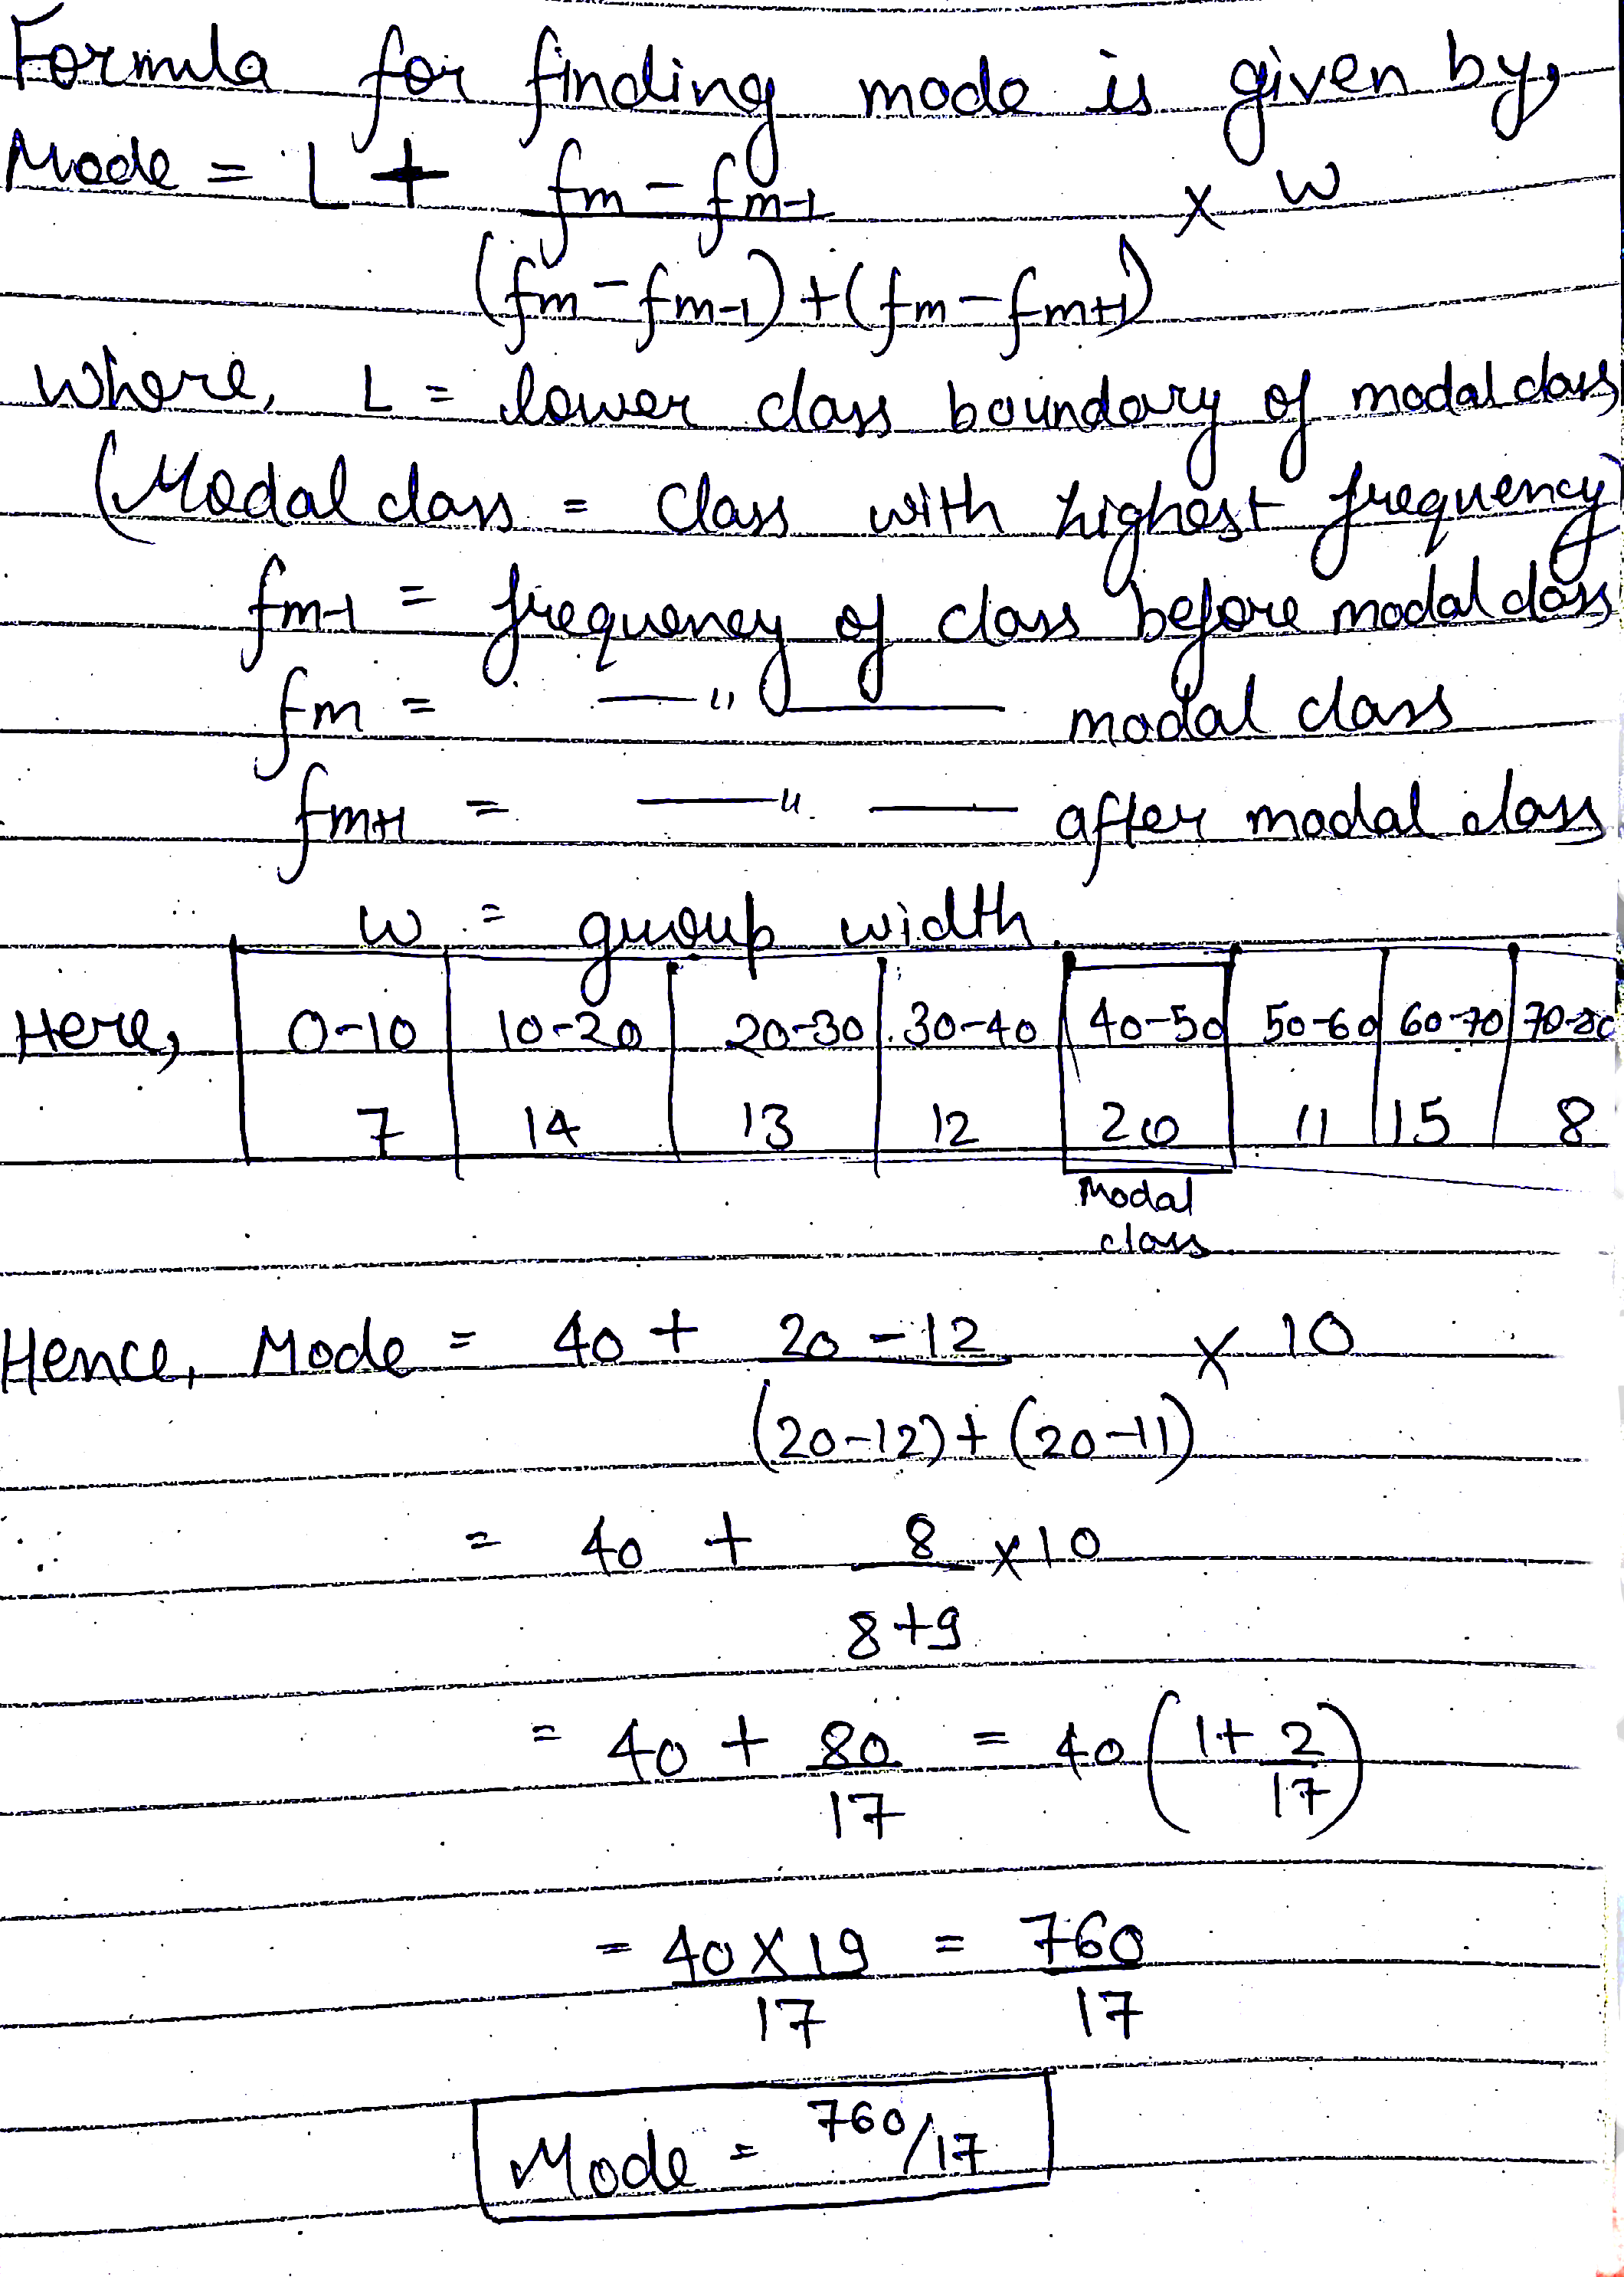
A student noted the number of cars passing through a spot on a road for $$100$$ periods each of $$3$$ minutes and summarised it in the table given below. Find the mode of the data
| Number of cars | 0-10 | 10-20 | 20-30 | 30-40 | 40-50 | 50-60 | 60-70 | 70-80 |
| Frequency | $$7$$ | $$14$$ | $$13$$ | $$12$$ | $$20$$ | $$11$$ | $$15$$ | $$8$$ |
$${1, 2, 3, 6, 8}$$ is a set of five positive integers whose mean is 4 and median isWrite down two other sets of five positive integers, each having the same mean and median as this set.
Compute the mode for the following frequency distribution:
| Size of items: | 0-4 | 4-8 | 8-12 | 12-16 | 16-20 | 20-24 | 24-28 | 28-32 | 32-36 | 36-40 |
| Frequency: | 5 | 7 | 9 | 17 | 12 | 10 | 6 | 3 | 1 | 0 |
The table below
shows the daily expenditure on food of 30 households in a locality
Daily expenditure (in Rs.) | $$100 -150$$ | $$150 - | $$200 - | $$250 - | $$300 - |
No. of households | $$6$$ | $$7$$ | $$12$$ | $$3$$ | $$2$$ |
Find the mean and the median daily expenditure on food.
Calculate the median from the following data:
| Marks: | 0-10 | 10-30 | 30-60 | 60-80 | 80-90 |
| No. of students: | 5 | 15 | 30 | 8 | 2 |
Find mode for the following data.
| Employees salary | $$0-10$$ | $$10-20$$ | $$20-30$$ | $$30-40$$ | $$40-50$$ | $$50-60$$ | $$60-70$$ | $$70-80$$ |
| No. of employees | $$10$$ | $$12$$ | $$18$$ | $$8$$ | $$9$$ | $$5$$ | $$6$$ | $$4$$ |
Weight of $$40$$ eggs were recorded as given below
| Weight in grams | $$85-90$$ | $$90-95$$ | $$95-100$$ | $$100-105$$ | $$105-110$$ |
| Number of eggs | $$4$$ | $$12$$ | $$14$$ | $$8$$ | $$2$$ |
The height (in cm) of the volly ball players from term $$A$$ and $$B$$ were recorded as
Team A:$$180,178,176,181,190,175,187$$
,Team B: $$174,175,190,179,178,185,177.$$
Which team had the greater average height?
Find the mediam of team $$A$$ and Team $$B$$
Find the mean, median and mode of the given data
| No. of Centuries | 5 | 10 | 15 | 20 | 25 |
| No. of Cricketers | 56 | 23 | 39 | 13 | 8 |
Find the mode for the following data: ($$4$$ and $$5$$)
| Class | $$0-7$$ | $$7-14$$ | $$14-21$$ | $$21-28$$ | $$28-35$$ | $$35-42$$ | $$42-49$$ | $$49-56$$ |
| Area | $$26$$ | $$31$$ | $$35$$ | $$42$$ | $$82$$ | $$71$$ | $$54$$ | $$19$$ |
Write the formula to find median from grouped frequency distribution
Weekly income of $$600$$ families is given below. Find the median.
| Income in $$Rs$$. | $$0-1000$$ | $$1000-2000$$ | $$2000-3000$$ | $$3000-4000$$ | $$4000-5000$$ | $$5000-6000$$ |
| Frequency | $$250$$ | $$190$$ | $$100$$ | $$40$$ | $$15$$ | $$5$$ |
| Class Interval | Frequency |
| $$1 - 5$$ | $$3$$ |
| $$6 - 10$$ | $$8$$ |
| $$11 - 15$$ | $$13$$ |
| $$16 - 20$$ | $$18$$ |
| $$21 - 25$$ | $$28$$ |
| $$26 - 30$$ | $$20$$ |
| $$31 - 35$$ | $$13$$ |
| $$36 - 40$$ | $$8$$ |
| $$41 - 45$$ | $$6$$ |
| $$46 - 50$$ | $$4$$ |
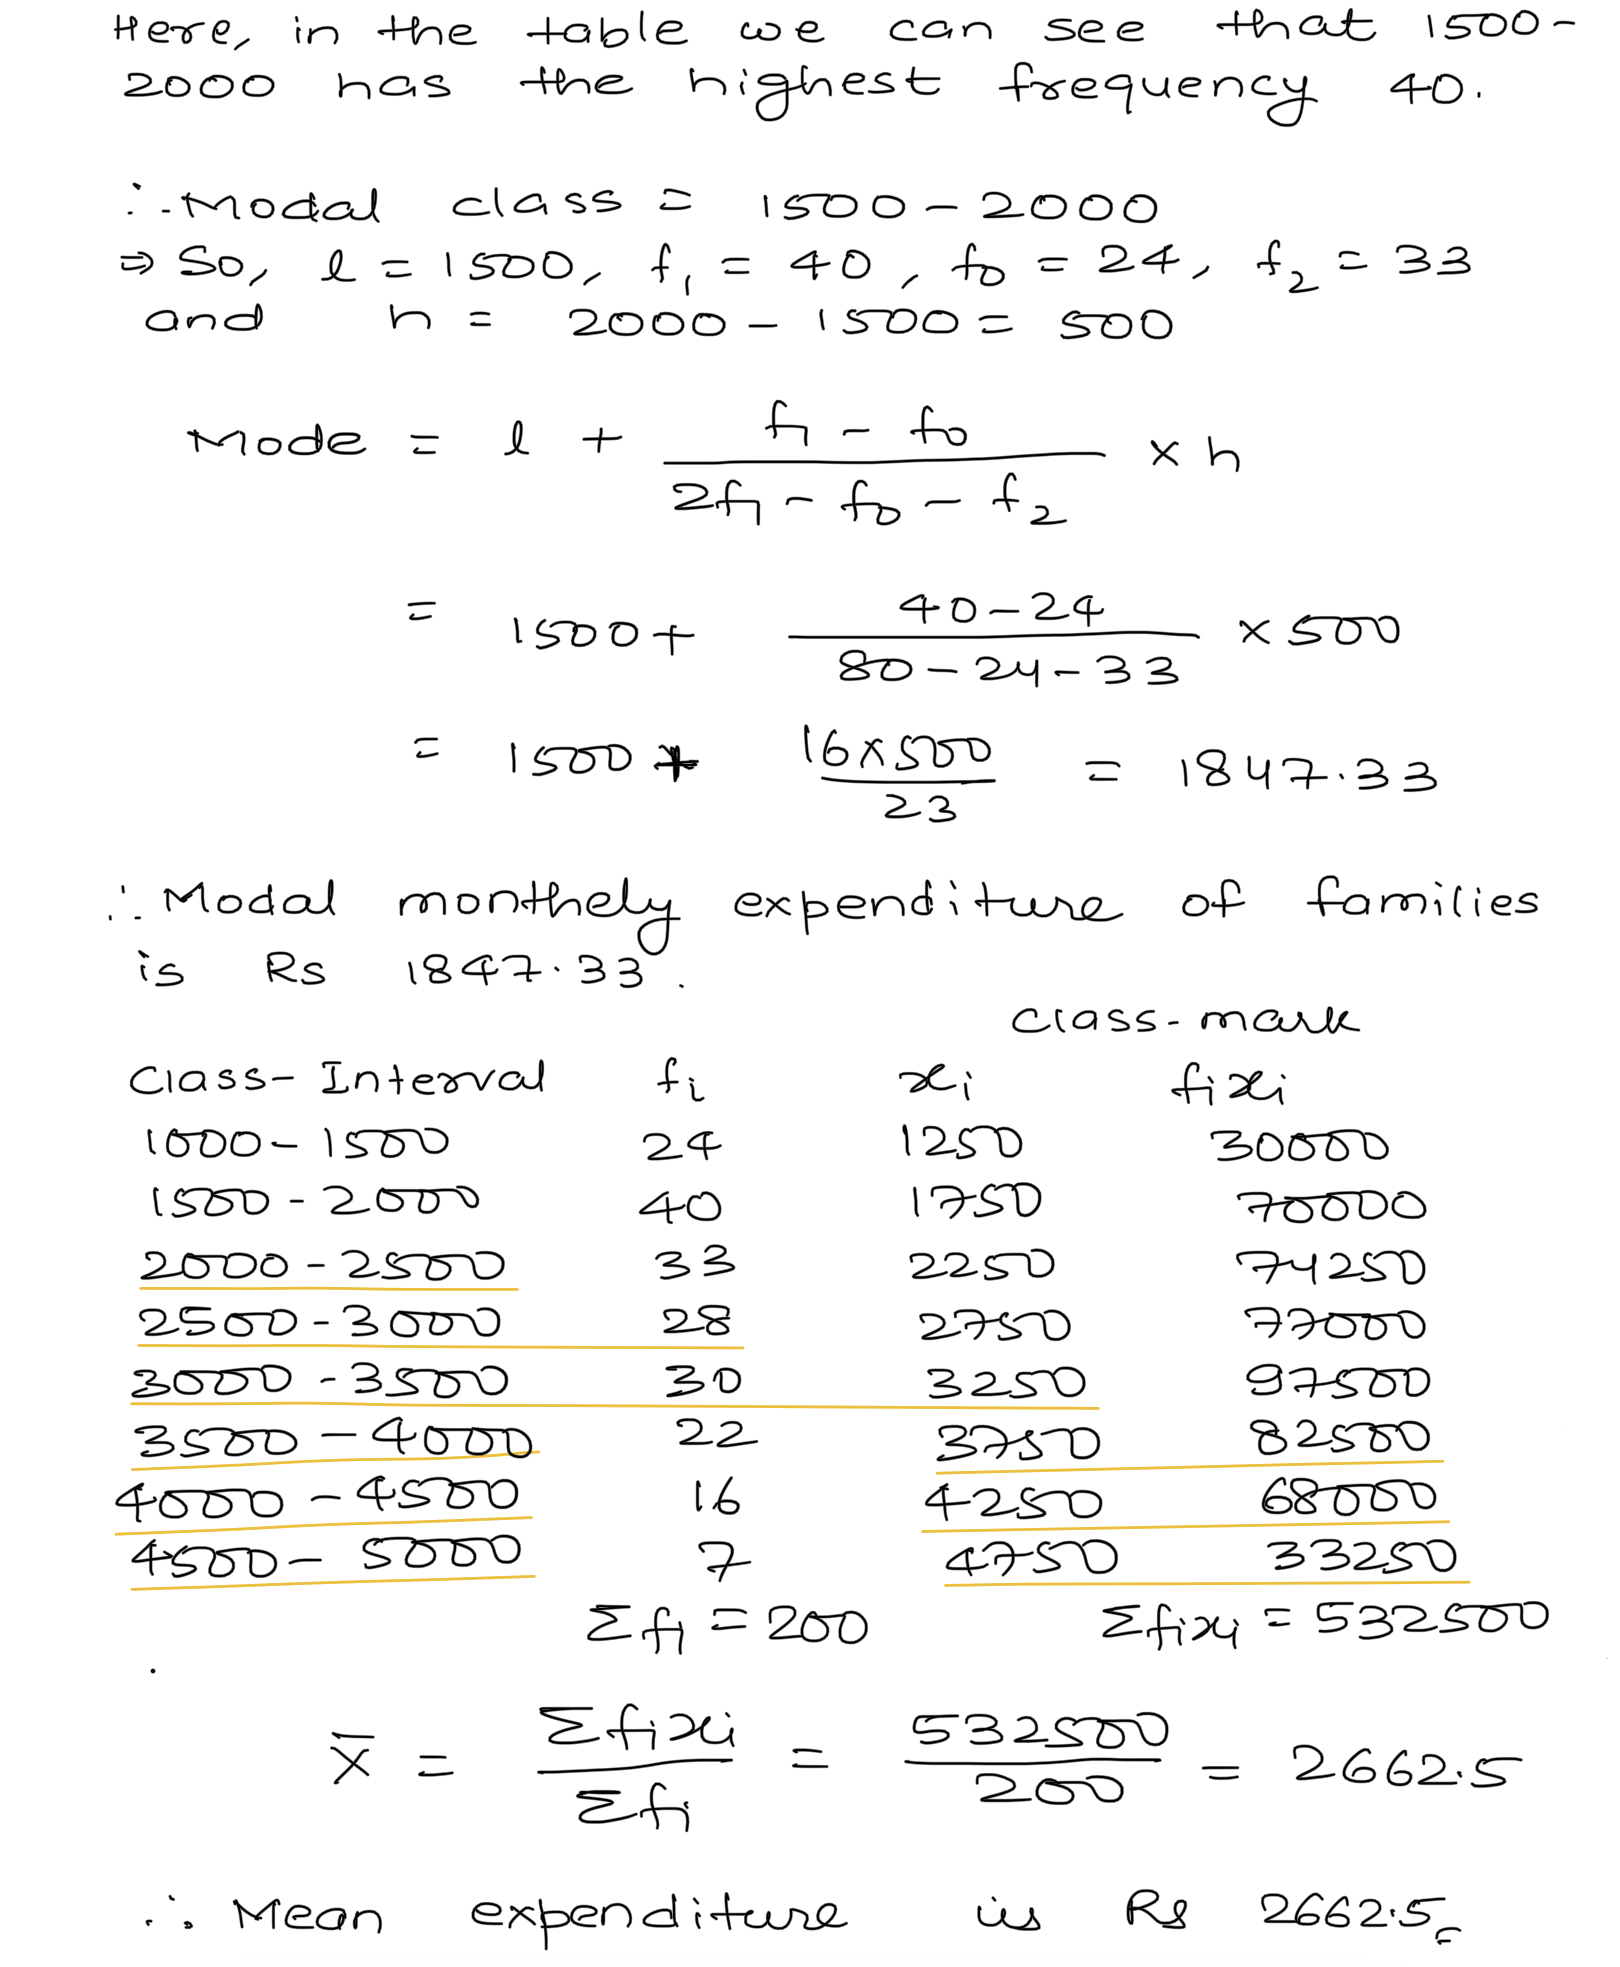
The following data gives the distribution of total monthly household expenditures of $$200$$ families of a village. Find the modal monthly expenditure of the families. Also, find the mean monthly expenditure.
$$Expenditure$$ (In Rs) Number of families
$$1000-1500$$ $$24$$ $$1500-2000$$ $$40$$ $$2000-2500$$ $$33$$ $$2500-3000$$ $$28$$ $$3000-3500$$ $$30$$ $$3500-4000$$ $$22$$ $$4000-4500$$ $$16$$ $$4500-5000$$ $$7$$
| $$Expenditure$$ (In Rs) | Number of families |
| $$1000-1500$$ | $$24$$ |
| $$1500-2000$$ | $$40$$ |
| $$2000-2500$$ | $$33$$ |
| $$2500-3000$$ | $$28$$ |
| $$3000-3500$$ | $$30$$ |
| $$3500-4000$$ | $$22$$ |
| $$4000-4500$$ | $$16$$ |
| $$4500-5000$$ | $$7$$ |
The lengths of $$40$$ leaves of a plant are measured correct to the nearest millimetre, and the data obtained is represented in the following table:
| Length (in mm) | Number of leaves |
| $$118-126$$ $$127-135$$ $$136-144$$ $$145-153$$ $$154-162$$ $$163-171$$ $$172-180$$ | $$3$$ $$5$$ $$9$$ $$12$$ $$5$$ $$4$$ $$2$$ |
A student noted the number of cars passing through a spot on a road for $$100$$ periods each of $$2$$ minutes and complied data in the following table :
| Number of cars | $$0-10$$ | $$10-20$$ | $$20-30$$ | $$30-40$$ | $$40-50$$ | $$50-60$$ | $$60-70$$ | $$70-80$$ |
| Number of period | $$7$$ | $$x$$ | $$13$$ | $$15$$ | $$y$$ | $$10$$ | $$14$$ | $$8$$ |
The age group and number of persons, who donated blood in a blood duration camp is given. Find the mode of ages of persons.
| Age group(years) | $$20-25$$ | $$25-30$$ | $$30-35$$ | $$35-40$$ |
| No. of persons | $$60$$ | $$80$$ | $$35$$ | $$25$$ |
Find the mode of the following distribution table:
| Class Interval | 0 - 10 | 10 - 20 | 20 - 30 | 30 - 40 | 40 - 50 | 50 - 60 | 60 - 70 | 70 - 80 |
| Frequency | 7 | 14 | 13 | 12 | 20 | 11 | 15 | 8 |
| 0-10 | 10-20 | 20-30 | 30-40 | 40-50 | 50-60 | 60-70 | 70-80 |
| 7 | 14 | 13 | 12 | 20 | 11 | 15 | 8 |
Find the mode of the following frequency distribution of marks obtained by $$50$$ students.
| Marks obtained | $$0 - 10$$ | $$10 - 20$$ | $$20 - 30$$ | $$30 - 40$$ | $$40 - 50$$ |
| No. of students | $$5$$ | $$12$$ | $$20$$ | $$10$$ | $$3$$ |
Calculate mean deviation about Median for the following data :
| Class | 0-10 | 10-20 | 20-30 | 30-40 | 40-50 | 50-60 |
| Frequency | 6 | 7 | 15 | 16 | 4 | 2 |
Mode of the following data.
| Interval | 0-20 | 20-40 | 40-60 | 60-80 | 80-100 |
| Frequency | 6 | 8 | 12 | 10 | 6 |
The median of $$230$$ observations of the following frequency distribution is $$46$$. Find $$a$$ and $$b$$:
| Class | 10-20 | 20-30 | 30-40 | 40-50 | 50-60 | 60-70 | 70-80 |
| Frequency | 12 | 30 | a | 65 | b | 25 | 18 |
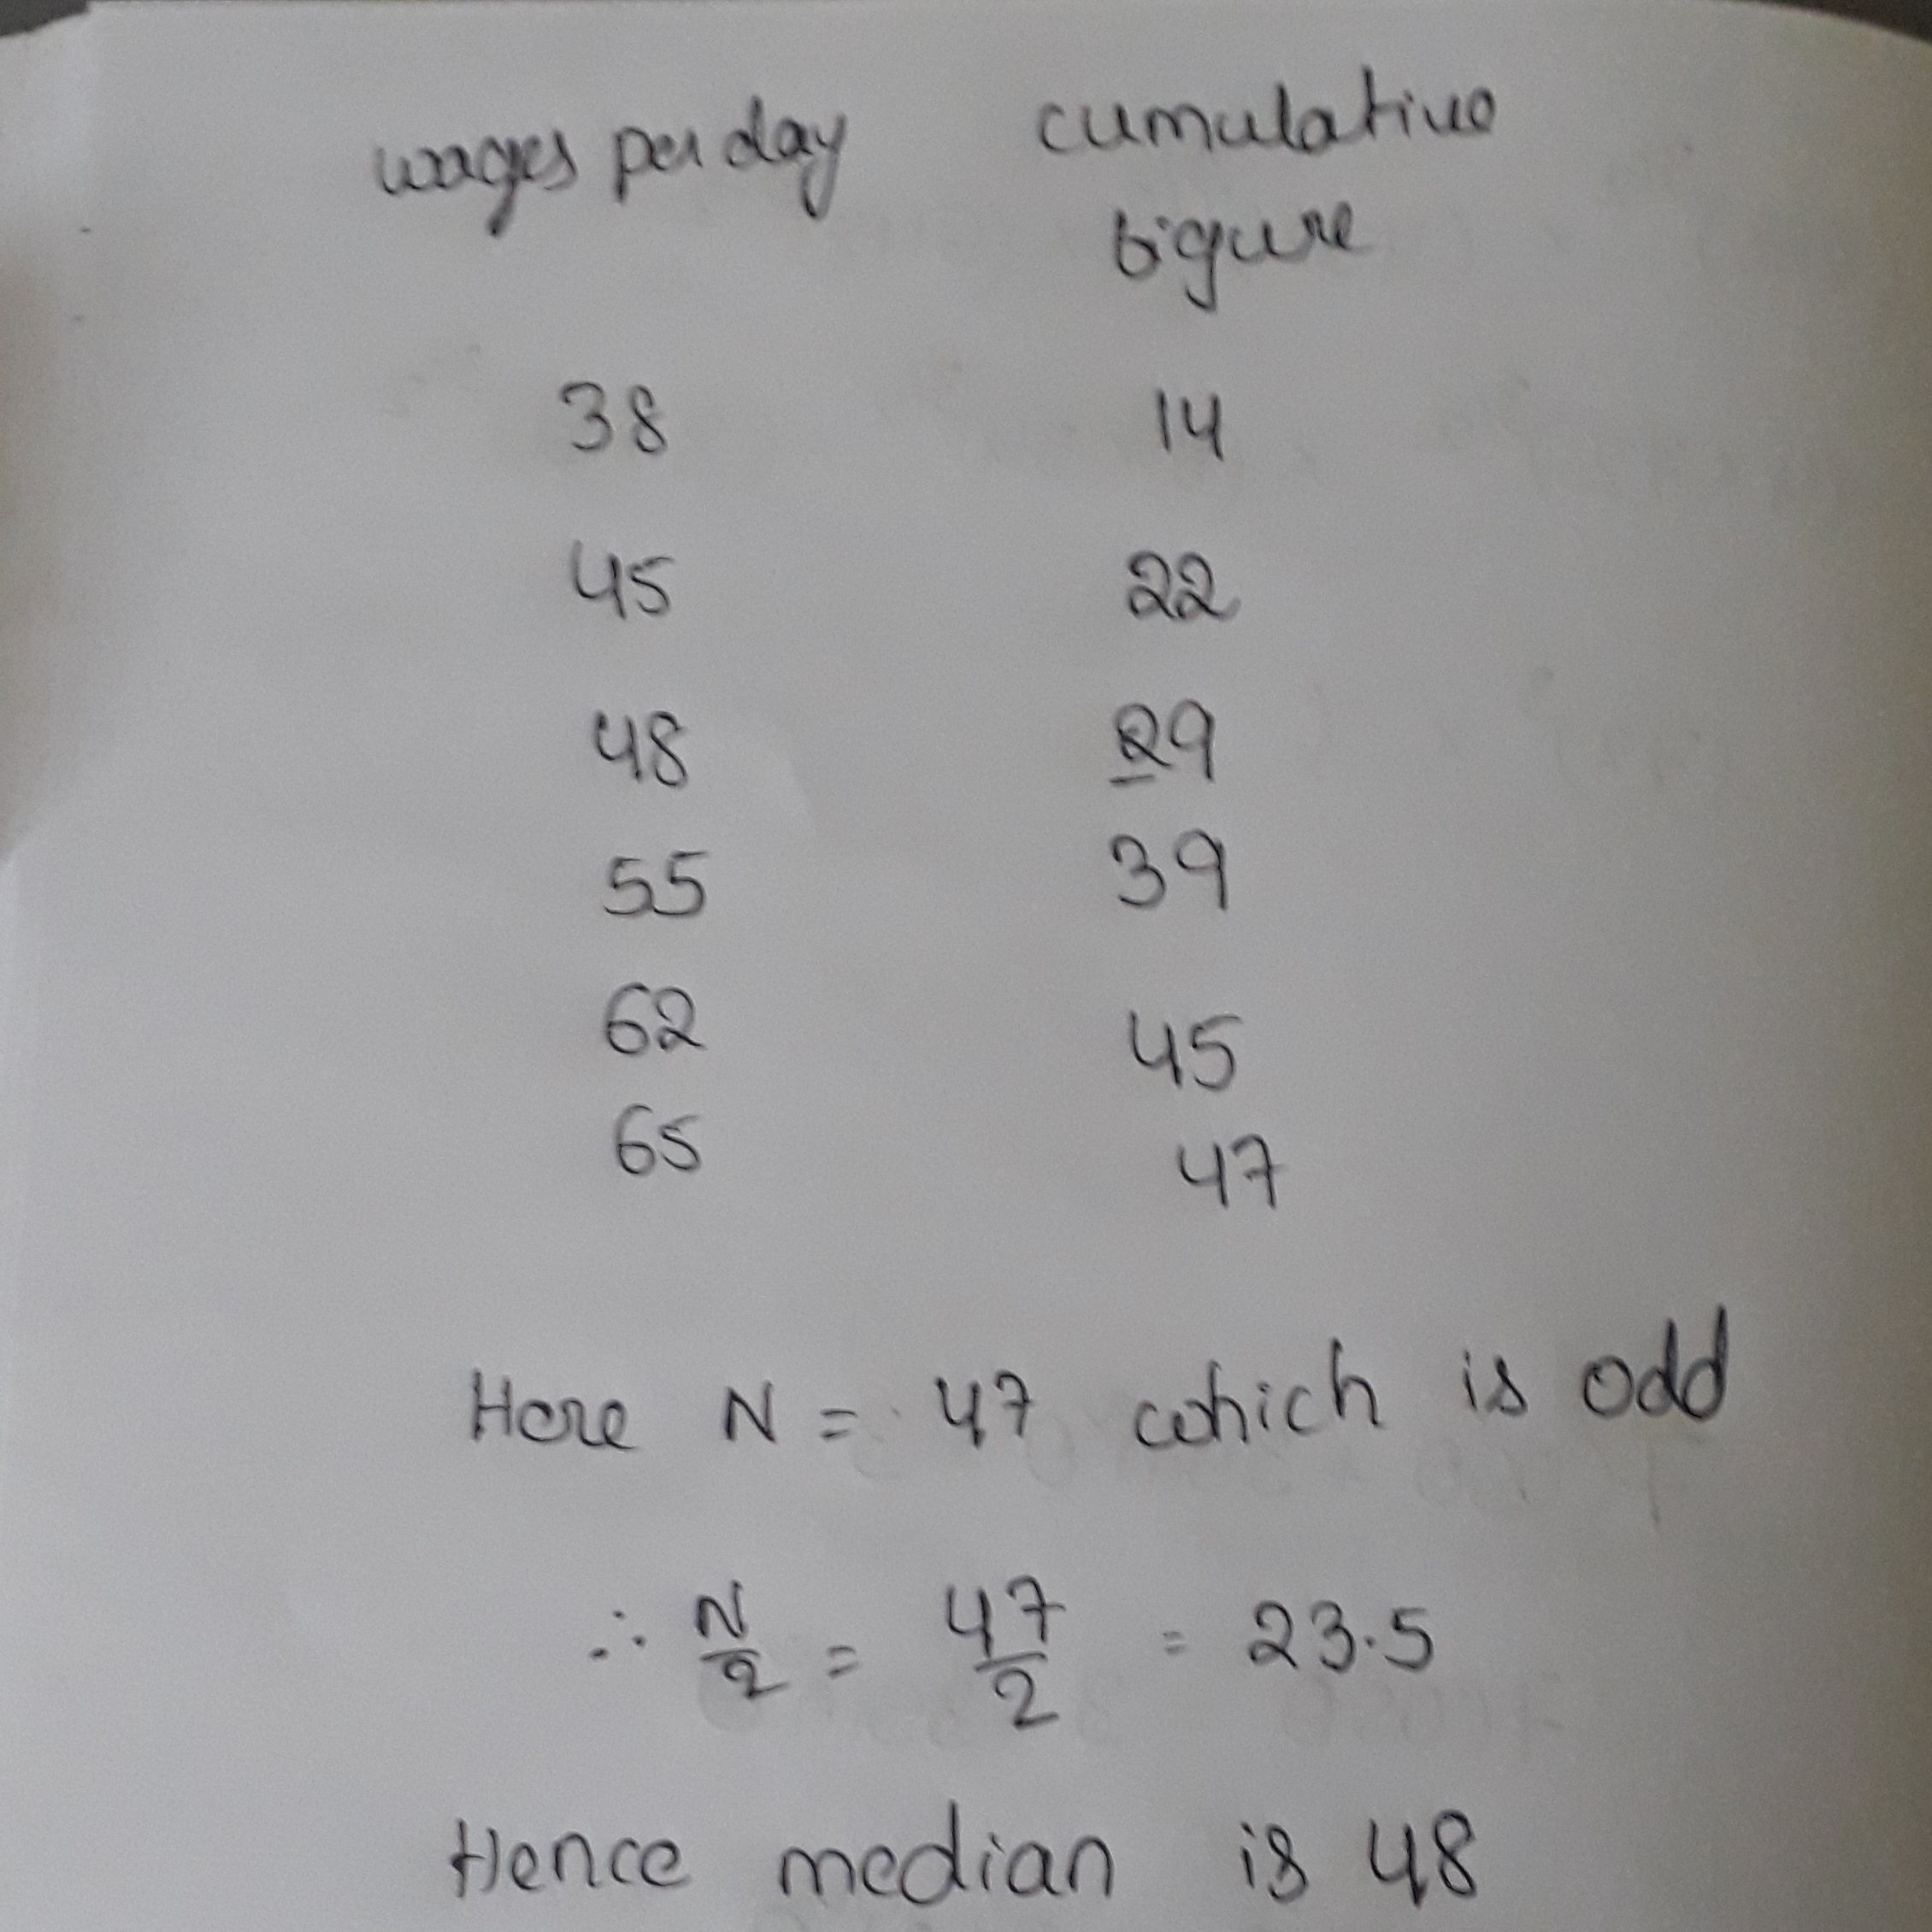
Find median:
| Wages per day | $$38$$ | $$45$$ | $$48$$ | $$55$$ | $$62$$ | $$65$$ |
| Cumulative figure | $$14$$ | $$22$$ | $$29$$ | $$39$$ | $$45$$ | $$47$$ |
Here $$N =47$$ which is odd.
Find the mode of given data.
| Marks | $$0-10$$ | $$10-20$$ | $$20-30$$ | $$30-40$$ | $$40-50$$ |
| Frequency | $$20$$ | $$24$$ | $$40$$ | $$36$$ | $$20$$ |
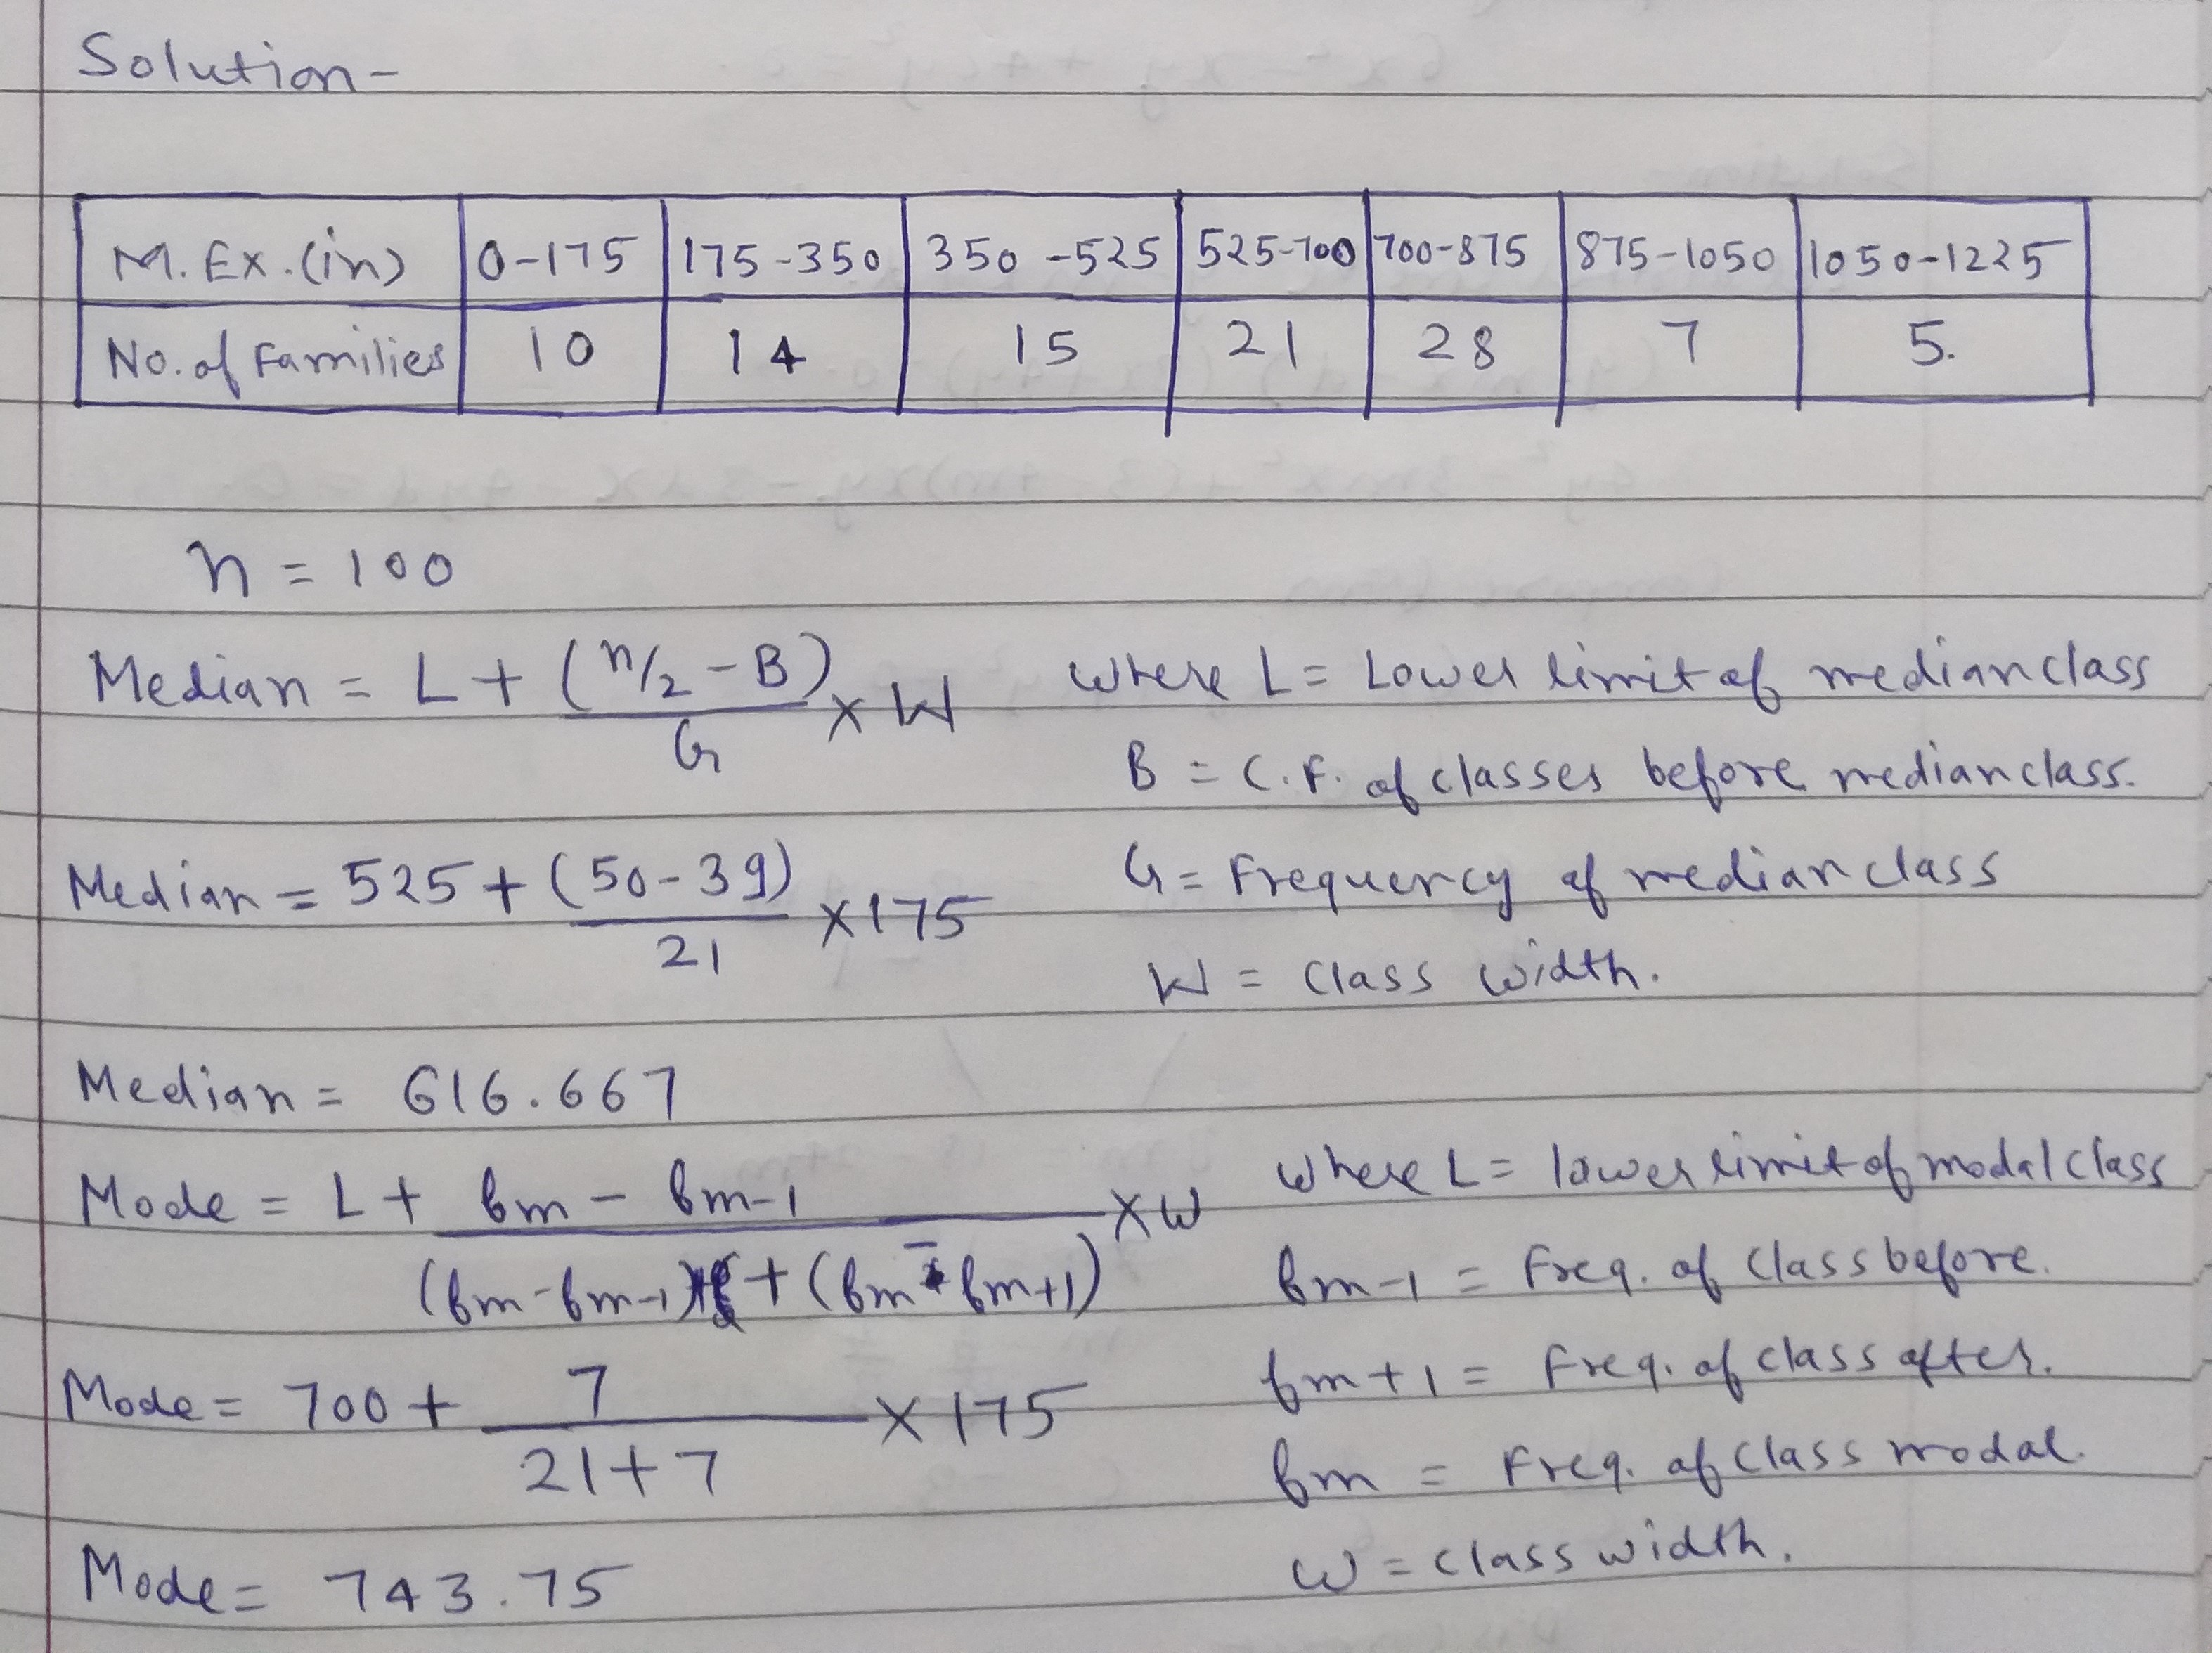
Monthly expenditure of milk of $$100$$ families in a housing society are given in the following frequency distribution
| Monthly expenditure(in) | 0-175 | 175-350 | 350-525 | 525-700 | 700-875 | 875-1050 | 1050-1225 |
| Number of families | 10 | 14 | 15 | 21 | 28 | 7 | 5 |
| M.Ex.(in) | 0-175 | 175-350 | 350-525 | 525-700 | 700-875 | 875-1050 | 1050-1225 |
| No.of Families | 10 | 14 | 15 | 21 | 28 | 7 | 5 |
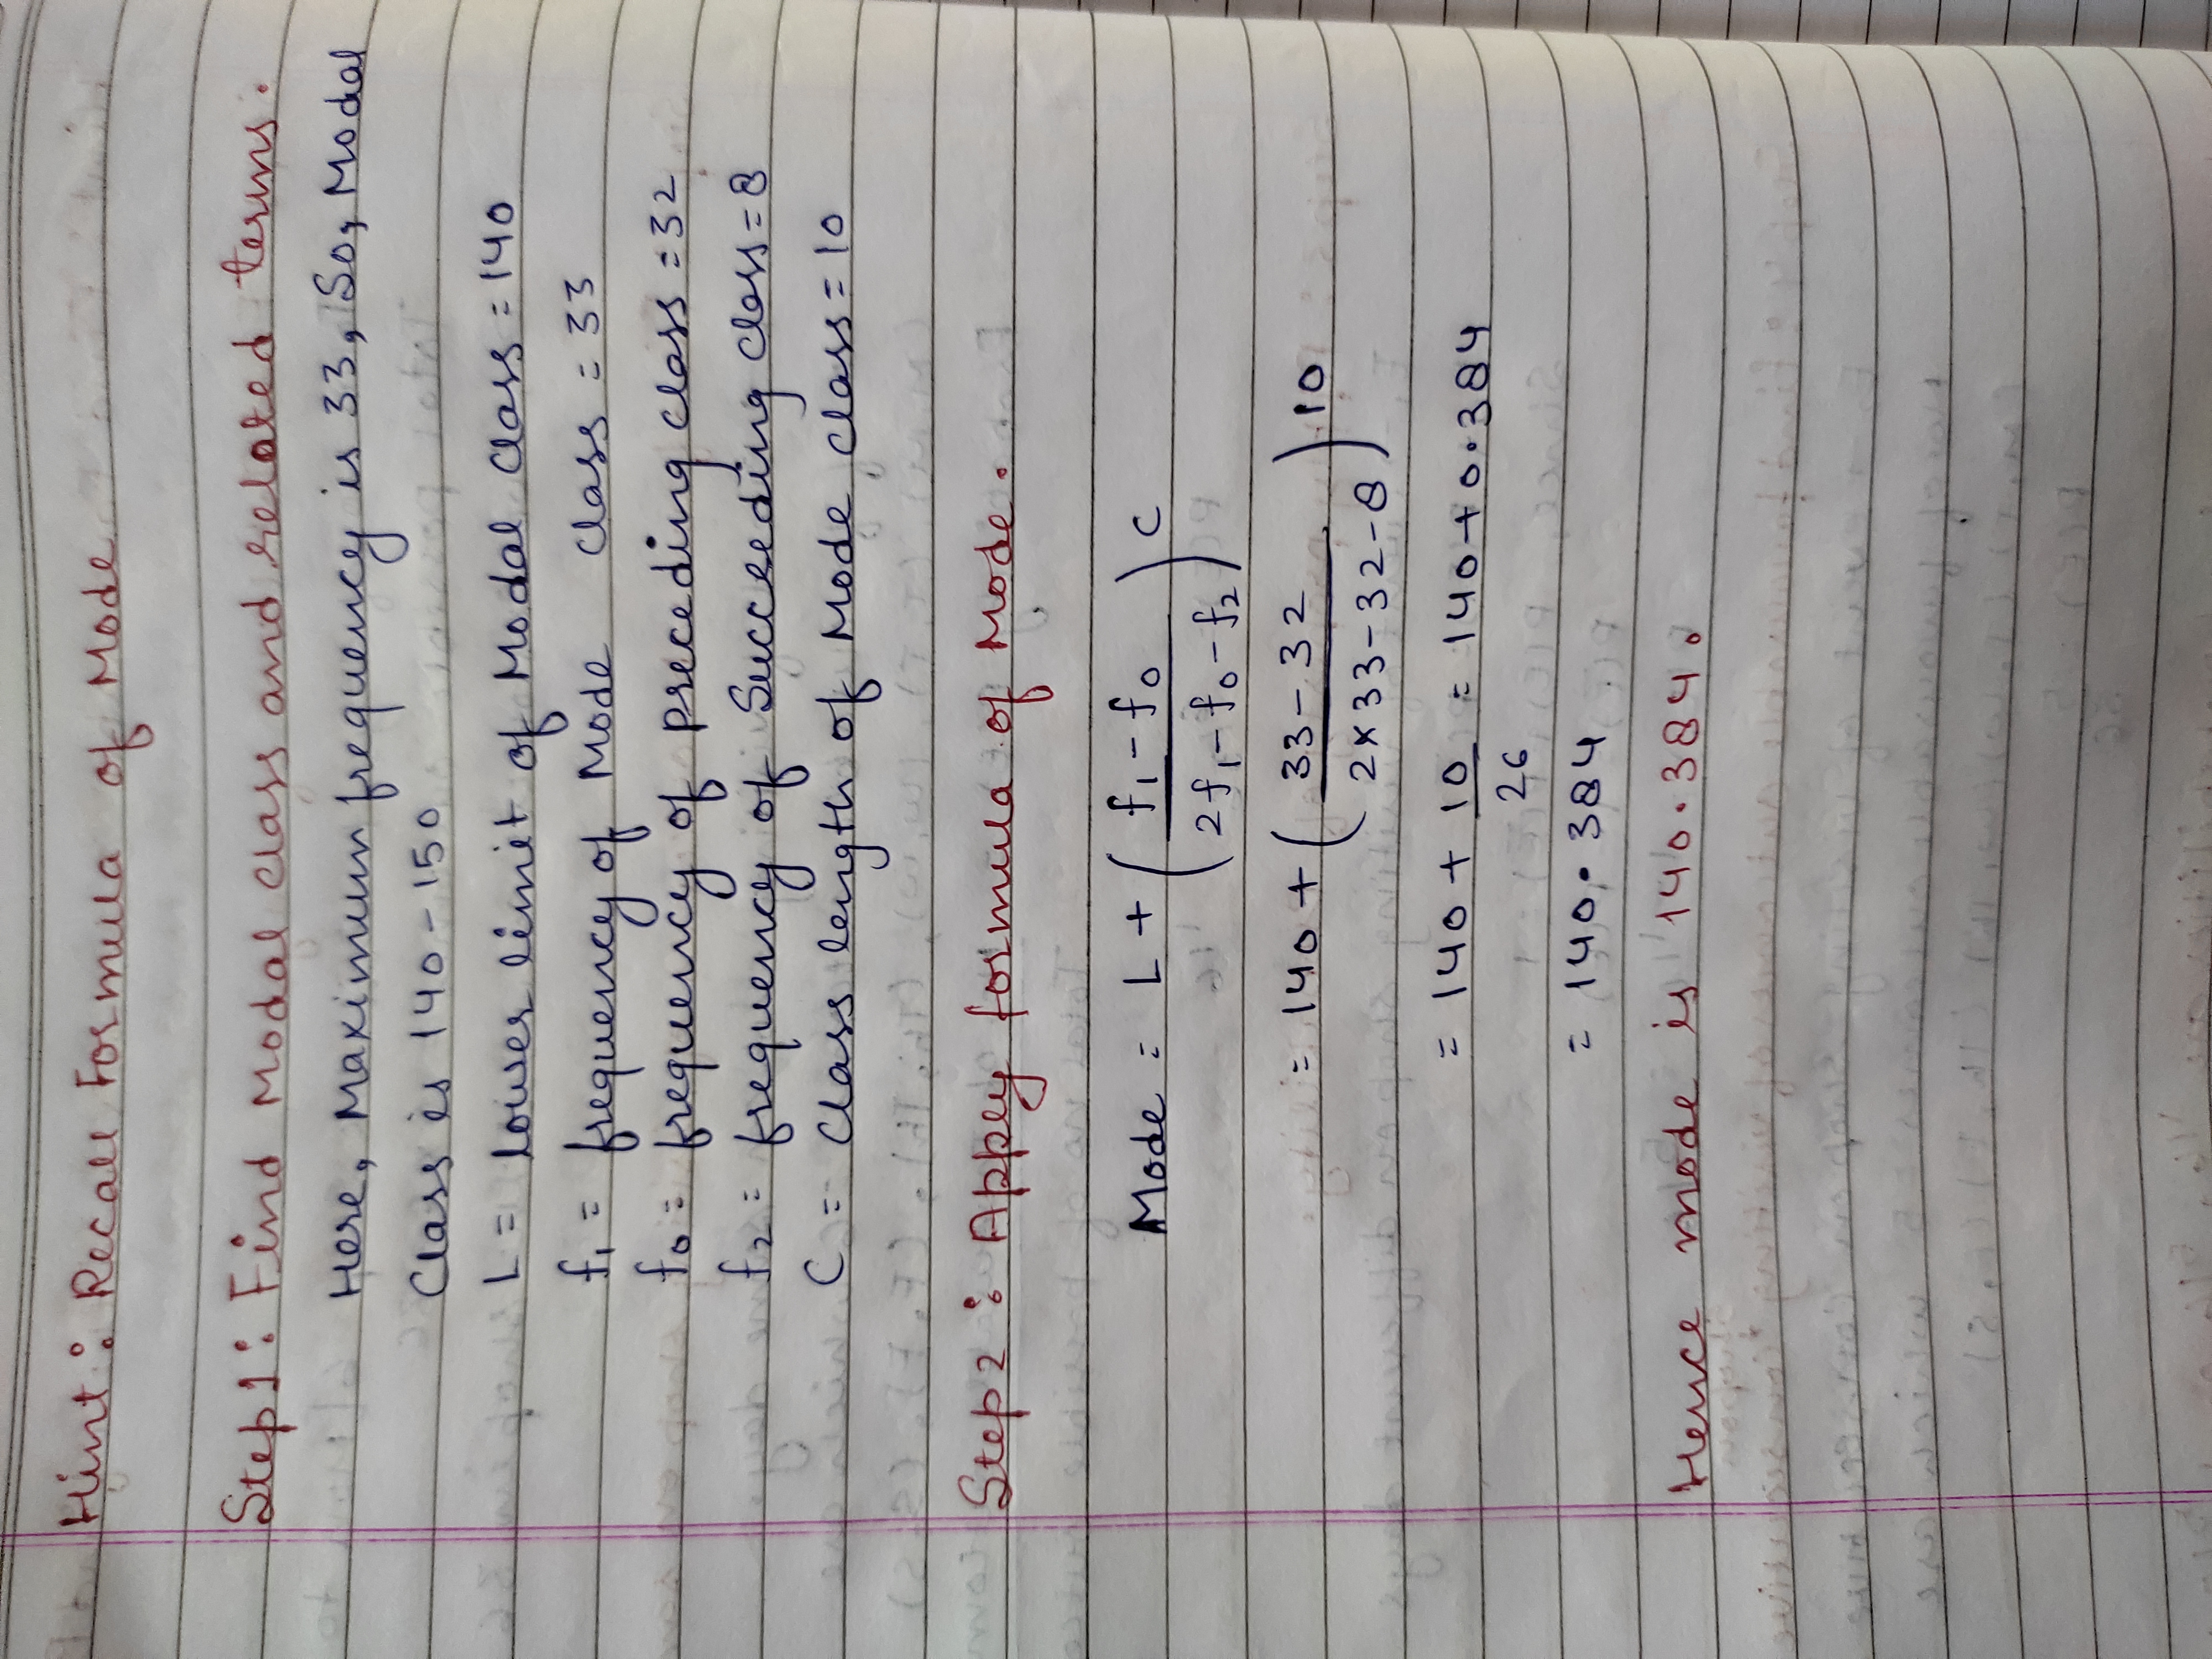
The following frequency distribution table shows the number of mango trees in a grove and their yield of mangoes, and also the cumulative frequencies. Find the median of the data.
| Class (No. of mangoes) | Frequency (No. of trees) | Cumulative frequency (less than) |
| $$50-100$$ | $$33$$ | $$33$$ |
| $$100-150$$ | $$30$$ | $$63$$ |
| $$150-200$$ | $$90$$ | $$153$$ |
| $$200-250$$ | $$80$$ | $$233$$ |
| $$250-300$$ | $$17$$ | $$250$$ |
If the median for the following frequency distribution is 28.5, find the values of x and y.
| Class Intervals | frequency |
| 0-10 | 5 |
| 10-20 | x |
| 20-30 | 20 |
| 30-40 | 15 |
| 40-50 | y |
| 50-60 | 5 |
| Total | 60 |
The following data gives the information of life of 300 electric bulbs (in Hours)
Life (in Hrs.) | 0-20 | 20-40 | 40-60 | 60-80 | 80-100 | 100-120 |
No. of electric bulbs | 31 | 36 | 38 | 42 | 82 | 71 |
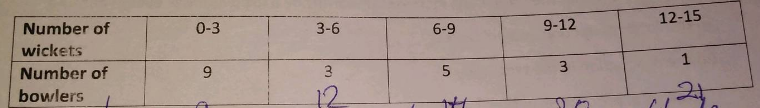
The given distribution shows the number of wickets taken by bowlers in inter-school competitions:
Find the median.
Monthly expenditures on milk in $$100$$ familes of a housing is given in the table.
| Monthly expenditure (in Rs) | $$0-175$$ | $$175-350$$ | $$350-525$$ | $$525-700$$ | $$700-875$$ | $$875-1050$$ | $$1050-1225$$ |
| Number of familes | $$10$$ | $$14$$ | $$15$$ | $$21$$ | $$28$$ | $$7$$ | $$5$$ |
Determine the mean, mode and the median of the data:
$$23,2,42,6,36,11,29,9,15$$
For the following distribution:
| Marks | Below $$10$$ | Below $$20$$ | Below $$30$$ | Below $$40$$ | Below $$50$$ | Below $$60$$ |
| No. of students | $$3$$ | $$12$$ | $$27$$ | $$57$$ | $$75$$ | $$80$$ |
During the medical checkup of 35 students of a class, their weights were recorded as followings:
Weight (in kg) Number of student Less than 38
Less than 40
Less than 42
Less than 44
Less than 46
Less than 48
Less than 50
Less than 52
0
3
5
9
14
28
32
35
Draw a less than type 0 give for the given data.Hence obtain the weight from
| Weight (in kg) | Number of student |
| Less than 38 Less than 40 Less than 42 Less than 44 Less than 46 Less than 48 Less than 50 Less than 52 | 0 14 |
Find the mode of the data given below:
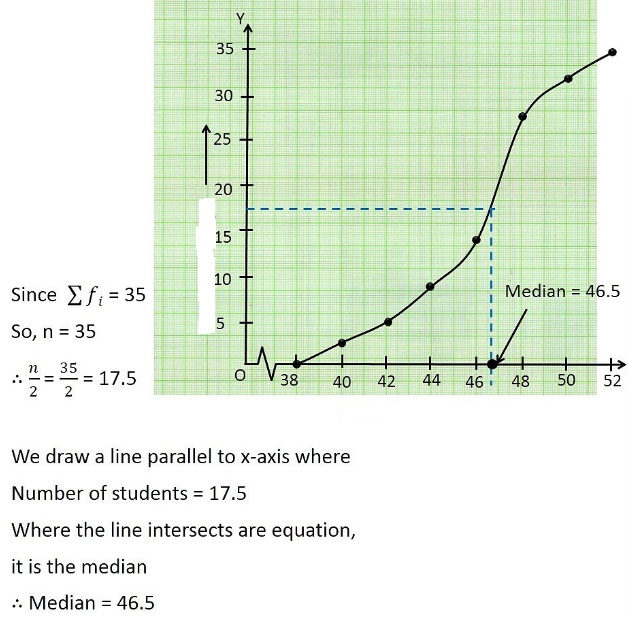
The median of the data
| Mid value | 115 | 125 | 135 | 145 | 155 | 165 | 175 | 185 | 195 |
| Frequency | 6 | 25 | 48 | 72 | 116 | 60 | 38 | 22 | 3 |
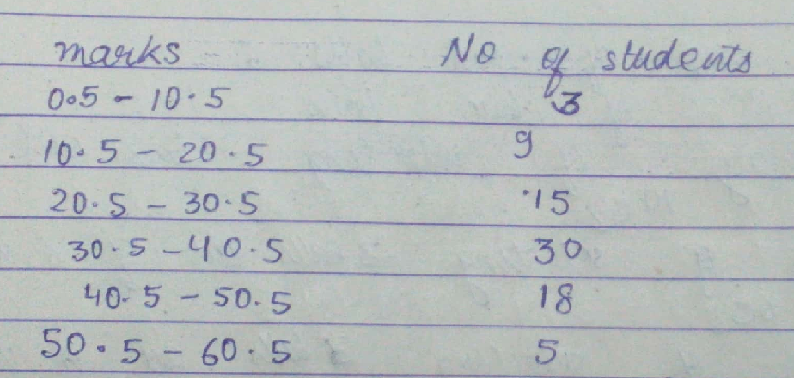
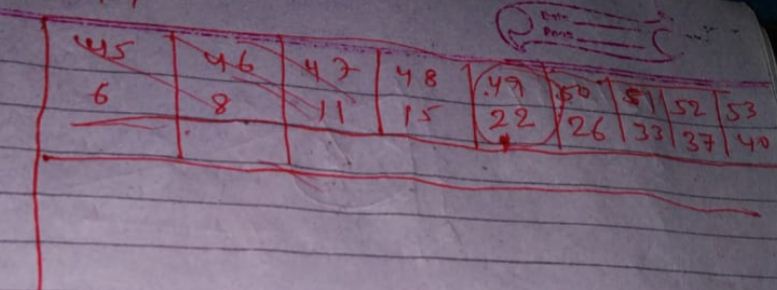
Find the median if total students are $$40$$
| Weight | $$45$$ | $$46$$ | $$47$$ | $$48$$ | $$49$$ | $$50$$ | $$51$$ | $$52$$ | $$53$$ |
| Median | $$6$$ | $$2$$ | $$3$$ | $$4$$ | $$7$$ | $$4$$ | $$7$$ | $$4$$ | $$3$$ |
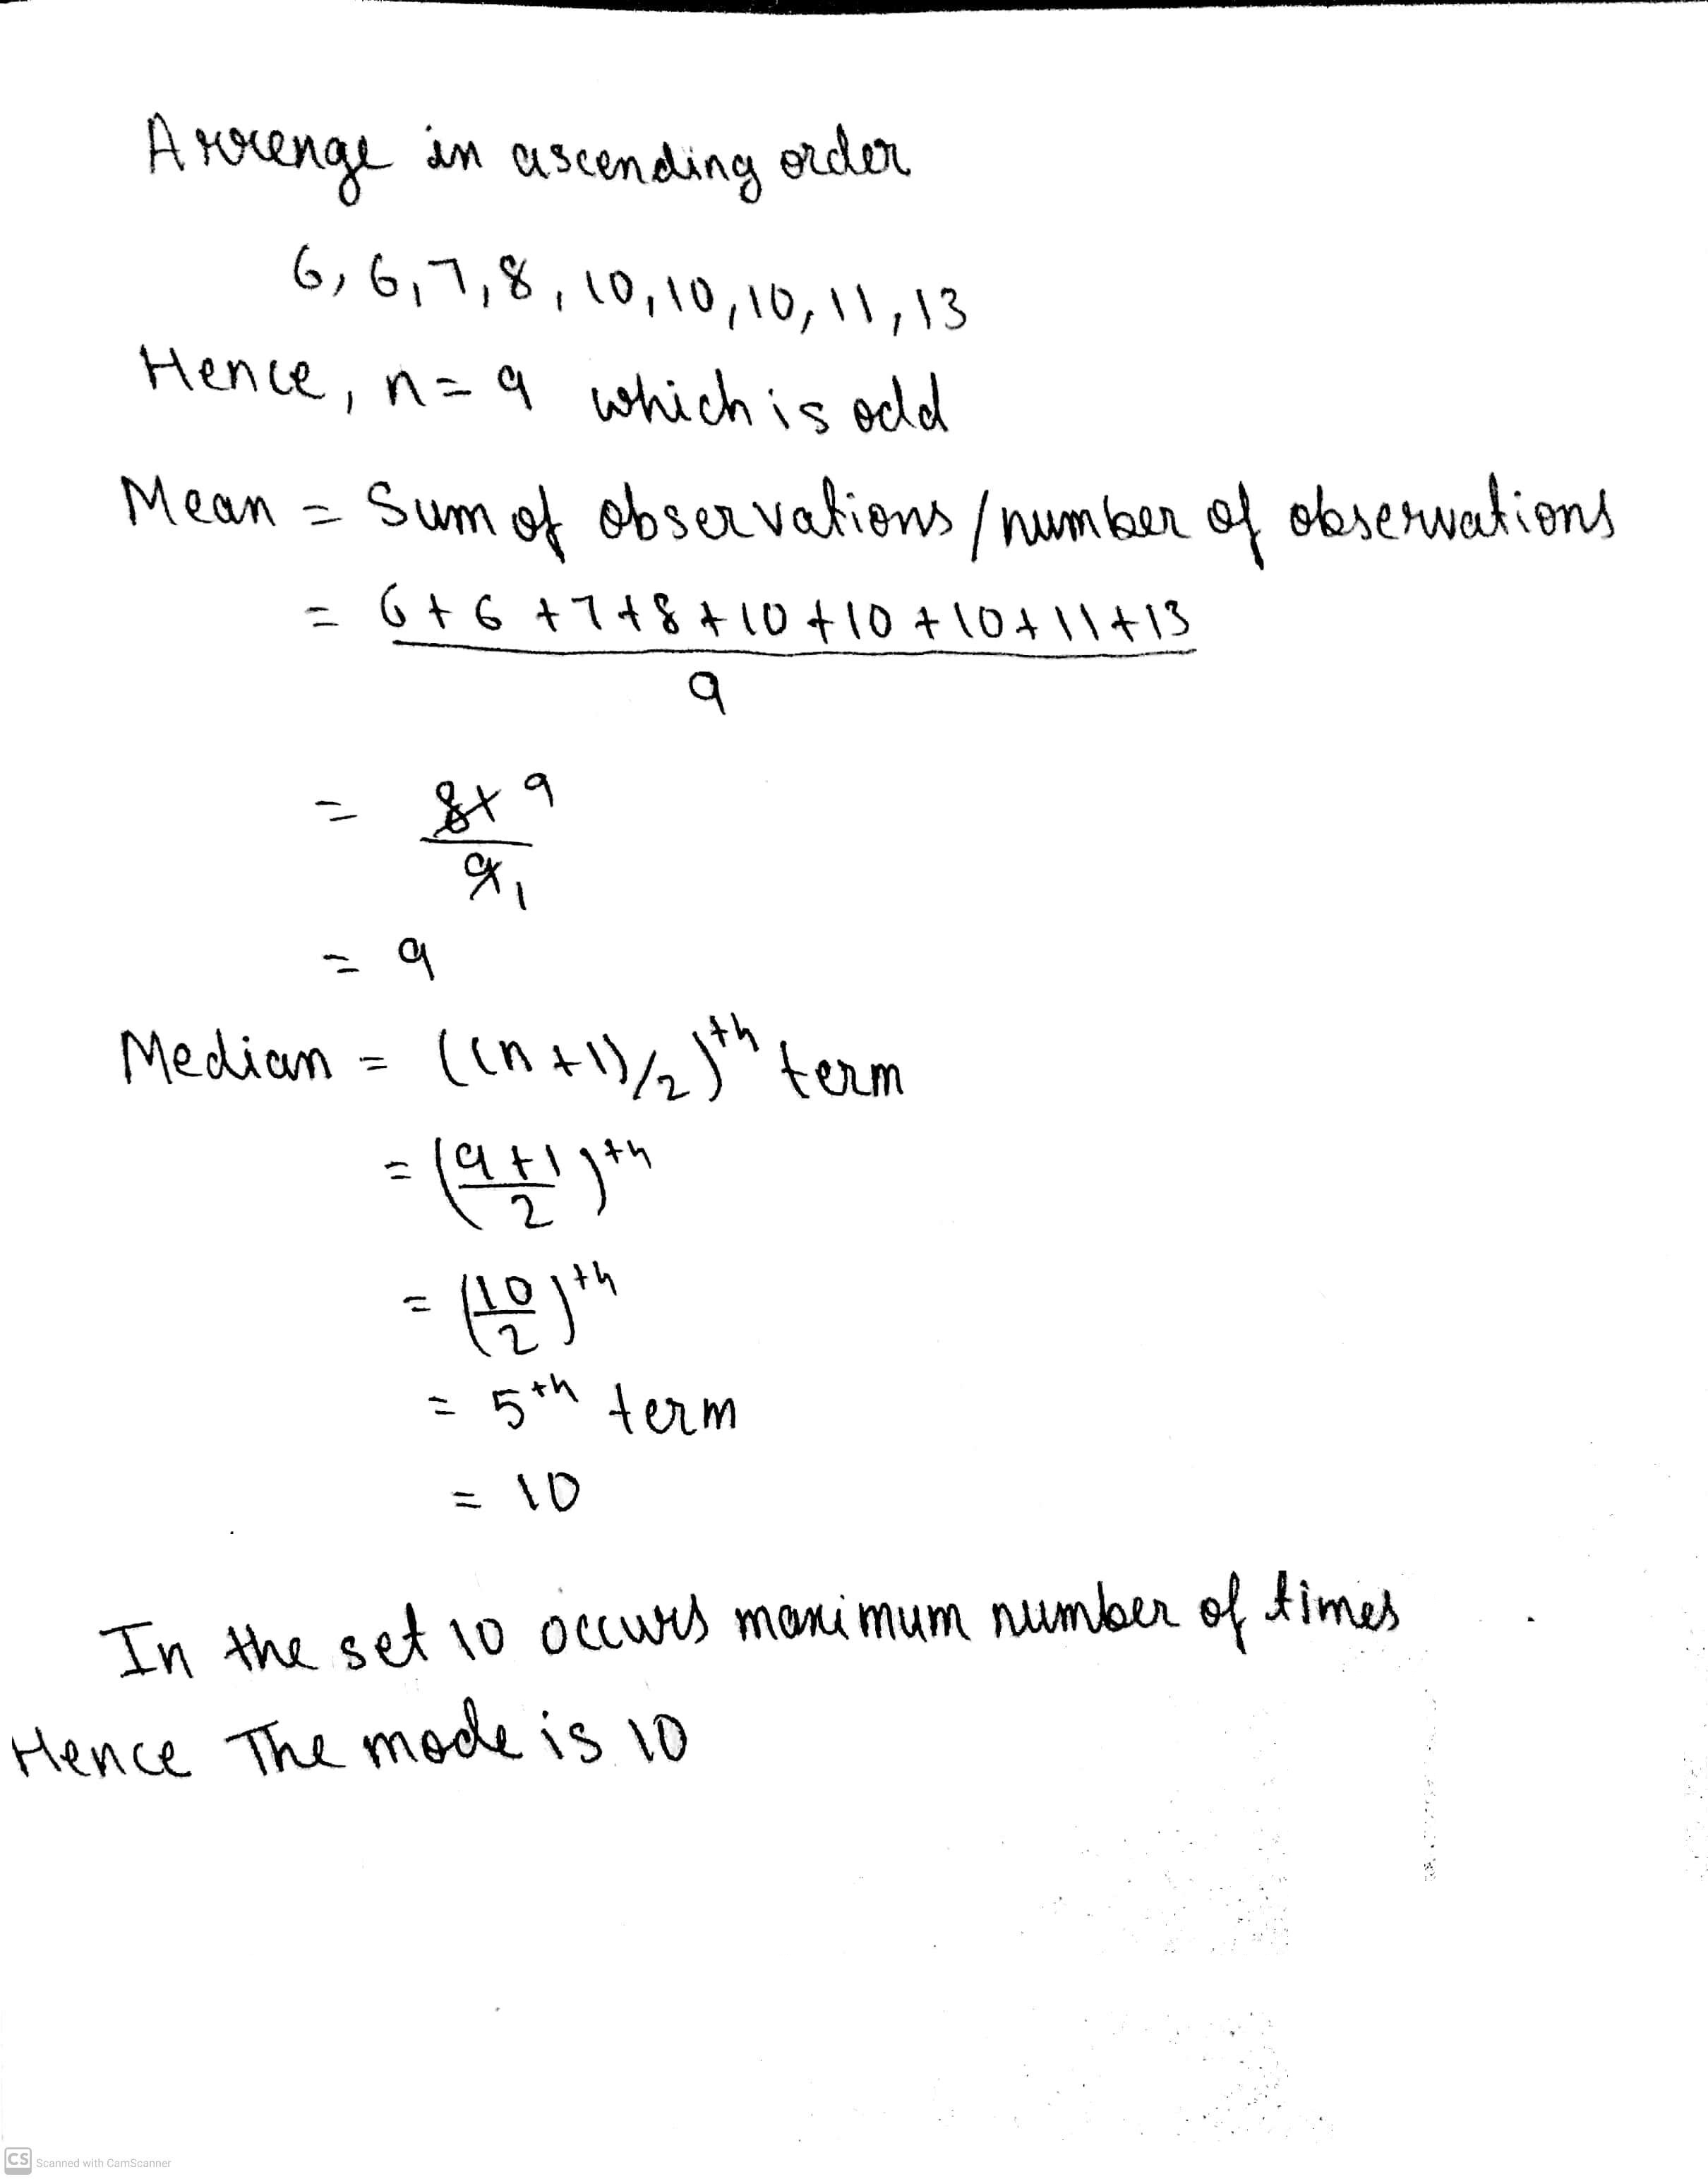
Find the mean, median and mode of the following distribution : 8, 10, 7, 6 , 10, 11, 6, 13, 10
Marks obtained by $$50$$ students in a unit test are given below:
| Marks | 0-20 | 20-40 | 40-60 | 60-80 | 80-100 |
| Numbers of students | 6 | 11 | 17 | 12 | 4 |
Incomes of the families in a locality are given. Find the mode of the data.
| Income (in Rs.) | 1 - 200 | 201 - 400 | 401 - 600 | 600 - 800 | 801 - 1000 |
| Number of families | 7 | 10 | 16 | 12 | 3 |
Size of the agriculture holding in a survey of 200 families is given in the following table:
| Size of Agriculture | 0-5 | 5-10 | 10-15 | 15-20 | 20-25 | 25-30 | 30-35 |
| Number of family | 10 | 15 | 30 | 80 | 40 | 20 | 5 |
Find the median for the following frequency distribution table :
| Class- interval | 0 - 5 | 5 - 10 | 10 - 15 | 15 - 20 | 20 - 25 | 25 - 30 |
| frequency | 5 | 3 | 9 | 10 | 8 | 5 |
The following are the marks of $$9$$ students in the class. Find the median
$$34,32,48,38,24,30,27,21$$ and $$35$$
The table below shows the members in "Stree-Sakti Kudambasree" Sorted according to their ages.
| Age group | Number of members |
| $$20-30$$ | $$4$$ |
| $$30-40$$ | $$8$$ |
| $$40-50$$ | $$10$$ |
| $$50-60$$ | $$7$$ |
| $$60-70$$ | $$4$$ |
| $$70-80$$ | $$2$$ |
| Total | $$35$$ |
b. What is assumed to be age of the member at the 13th position?
c. Find the median of the ages.
Heights of the pupils of a particular school are given. Draw greater than cumulative curve and find the median height from it.
| Height (in cm) | 90-100 | 100-110 | 110-120 | 120-130 | 130-140 | 140-150 |
| Number of pupils | 5 | 2 | 3 | 8 | 8 | 6 |
Find the mean and median for the following data:
$$i) 13 , 17 , 16 , 14 , 11 , 13 , 10 , 16 , 11 , 18 , 12 , 17$$
$$ii) 36 , 72 , 46 , 42 , 60 , 45 , 53 , 46 , 51 , 49$$
Find the mode of the following data.

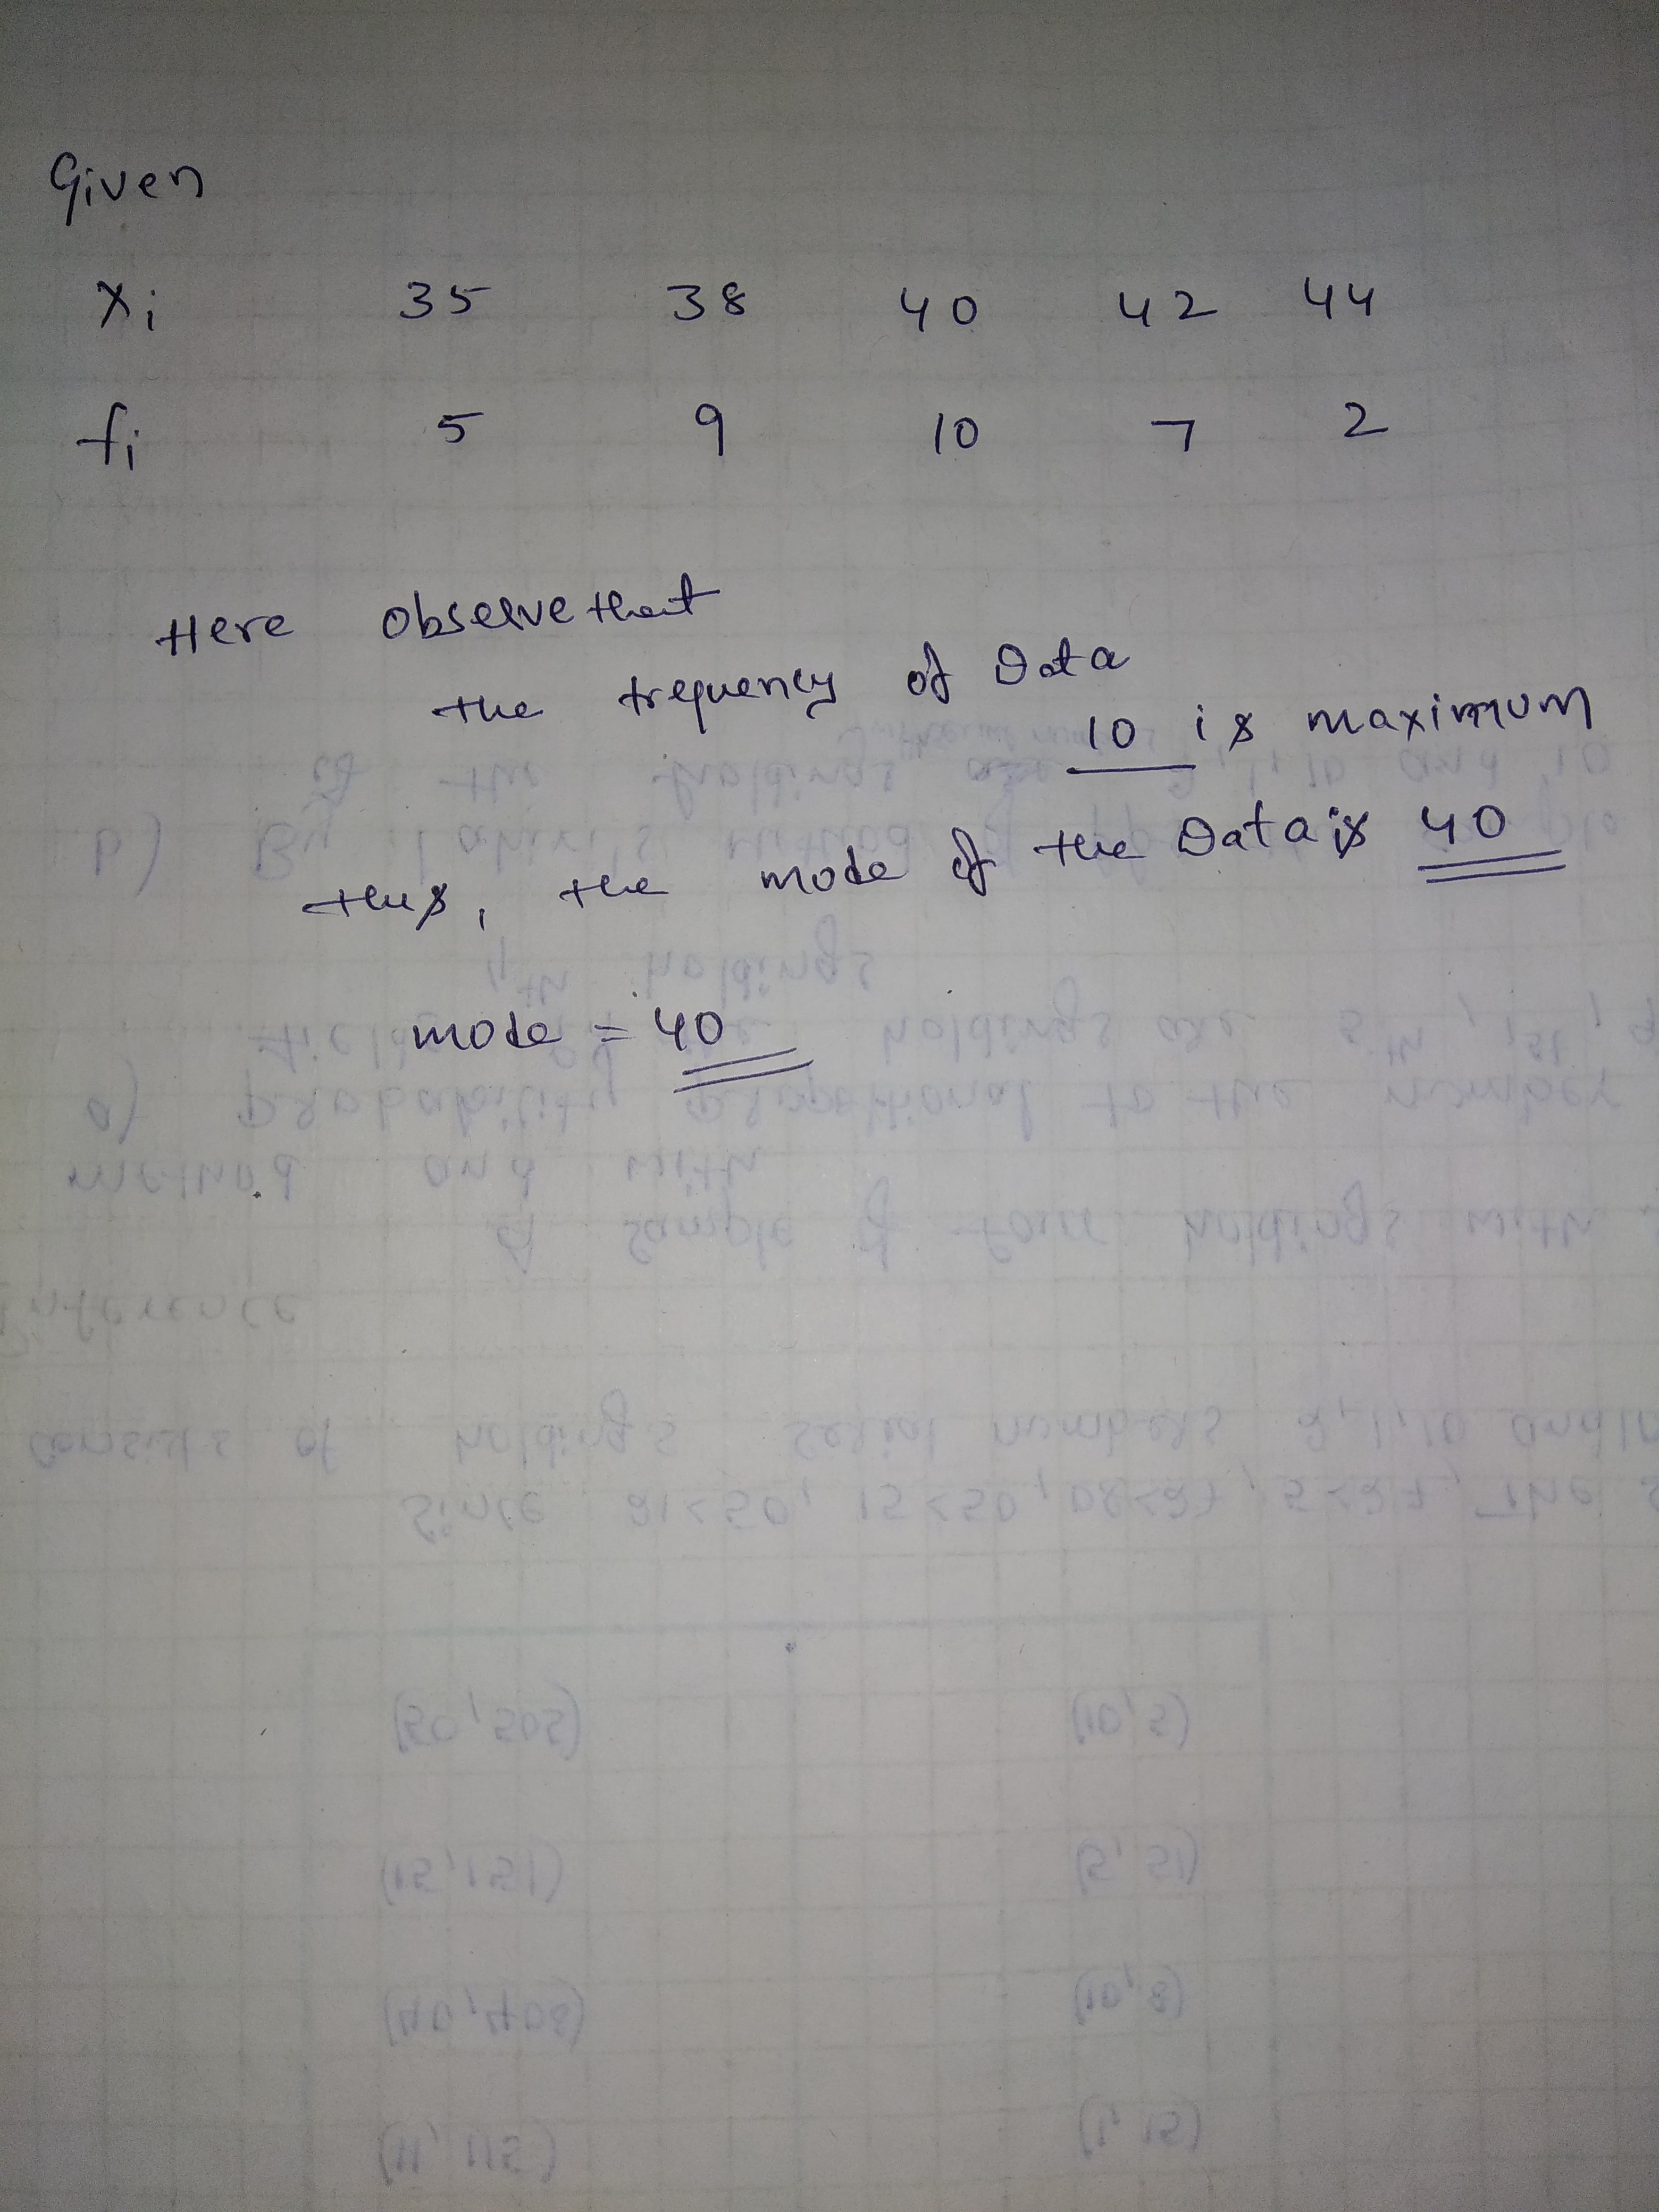
Find the mean of the following distribution :
| x : | 10 | 12 | 20 | 25 | 35 |
| f : | 3 | 10 | 15 | 7 | 5 |
Find the mean of the following data:
| $$x_i$$ | $$19$$ | $$21$$ | $$23$$ | $$25$$ | $$27$$ | $$29$$ | $$31$$ |
| $$f_i$$ | $$13$$ | $$15$$ | $$16$$ | $$18$$ | $$16$$ | $$15$$ | $$13$$ |
The ages (in years) of 50 students of a class in a school are below:
| Age (in years): | 14 | 15 | 16 | 17 | 18 |
| Numbers of students: | 15 | 14 | 10 | 8 | 3 |
Find the mode of the following data:
| Class: | $$0-20$$ | $$20-40$$ | $$40-60$$ | $$60-80$$ | $$80-100$$ | $$100-120$$ | $$120-140$$ |
| Frequency: | $$6$$ | $$8$$ | $$10$$ | $$12$$ | $$6$$ | $$5$$ | $$3$$ |
Solve the following :
If $$L = 10 , f_1 = 70 , f_0 = 58, f_2 = 42, h = 2$$, then find the mode by using formula.
Find the mode of the following frequency distribution:
| Marks | $$10-20$$ | $$20-30$$ | $$30-40$$ | $$40-50$$ | $$50-60$$ |
| Frequency | $$12$$ | $$35$$ | $$45$$ | $$25$$ | $$13$$ |
Find mode for given data:
| Class | $$20-29$$ | $$30-39$$ | $$40-49$$ | $$50-59$$ | $$60-69$$ |
| Frequency | $$15$$ | $$20$$ | $$50$$ | $$30$$ | $$10$$ |
Calculate the mean for the following distribution :
| x : | 5 | 6 | 7 | 8 | 9 |
| f : | 4 | 8 | 14 | 11 | 3 |
The following tables shows the daily wages of works in a factory:
| Daily wages (in $$Rs$$) | $$0-100$$ | $$100-200$$ | $$200-300$$ | $$300-400$$ | $$400-500$$ |
| Number of workers | $$40$$ | $$32$$ | $$48$$ | $$22$$ | $$8$$ |
Find Median daily wages.
Daily Wages | Frequency $$f_i$$ | $$cf$$ |
$$0-100$$ | $$40$$ | $$40$$ |
$$100-200$$ | $$32$$ | $$72$$ |
$$200-300$$ | $$48$$ | $$120$$ |
$$300-400$$ | $$22$$ | $$142$$ |
$$400-500$$ | $$8$$ | $$150$$ |
$$\displaystyle \sum f_i =150$$ |
Here
$$N=150$$
$$\dfrac{N}{2}=75$$
$$cf$$ just greater than $$75$$ to $$120$$
Median class $$200-300$$
So, $$I=200,\ h=100,\ f=48$$ and
$$cf=cf$$ of preceding class i.e $$72$$
Substitute all the value in the above formula, we get
Median $$=200+\left\{100\times \dfrac{(75-72)}{48} \right\}$$
$$=200+6.25$$
$$=206.25$$
Median of daily wages is $$Rs.\ 206.25$$
Given below is the distribution of total household expenditure of $$200$$ manual workers in a city:
| Expenditure (in Rs) | $$1000-\\ 1500$$ | $$1500-\\ 2000$$ | $$2000-\\ 2500$$ | $$2500-\\ 3000$$ | $$3000-\\ 3500$$ | $$3500-\\ 4000$$ | $$4000-\\ 4500$$ | $$4500-\\ 5000$$ |
| No. of manual workers | $$24$$ | $$40$$ | $$31$$ | $$28$$ | $$32$$ | $$23$$ | $$17$$ | $$5$$ |
Compute the mode of the following data:
| Class | $$0-20$$ | $$20-40$$ | $$40-60$$ | $$60-80$$ | $$80-100$$ |
| Frequency | $$25$$ | $$16$$ | $$28$$ | $$20$$ | $$5$$ |
Find the mode of the following distribution:
| Class interval | $$10-14$$ | $$14-18$$ | $$18-22$$ | $$22-26$$ | $$26-30$$ | $$30-34$$ | $$34-38$$ | $$38-42$$ |
| Frequency | $$8$$ | $$6$$ | $$11$$ | $$20$$ | $$25$$ | $$22$$ | $$10$$ | $$4$$ |
Calculate the median from the following frequency distribution:
| Class | $$5-10$$ | $$10-15$$ | $$15-20$$ | $$20-25$$ | $$25-30$$ | $$30-35$$ | $$35-40$$ | $$40-45$$ |
| Frequency | $$5$$ | $$6$$ | $$15$$ | $$10$$ | $$5$$ | $$4$$ | $$2$$ | $$2$$ |
Compute the median from the following data:
| Marks | $$0-7$$ | $$7-14$$ | $$14-21$$ | $$21-28$$ | $$28-35$$ | $$35-42$$ | $$42-49$$ |
| Number of students | $$3$$ | $$4$$ | $$7$$ | $$11$$ | $$0$$ | $$16$$ | $$9$$ |
In a hospital, the ages of diabetic patients were recorded as follows. Find the median age.
| Age (in year) | $$0-15$$ | $$15-30$$ | $$30-45$$ | $$45-60$$ | $$60-75$$ |
| Number of patients | $$5$$ | $$20$$ | $$40$$ | $$50$$ | $$25$$ |
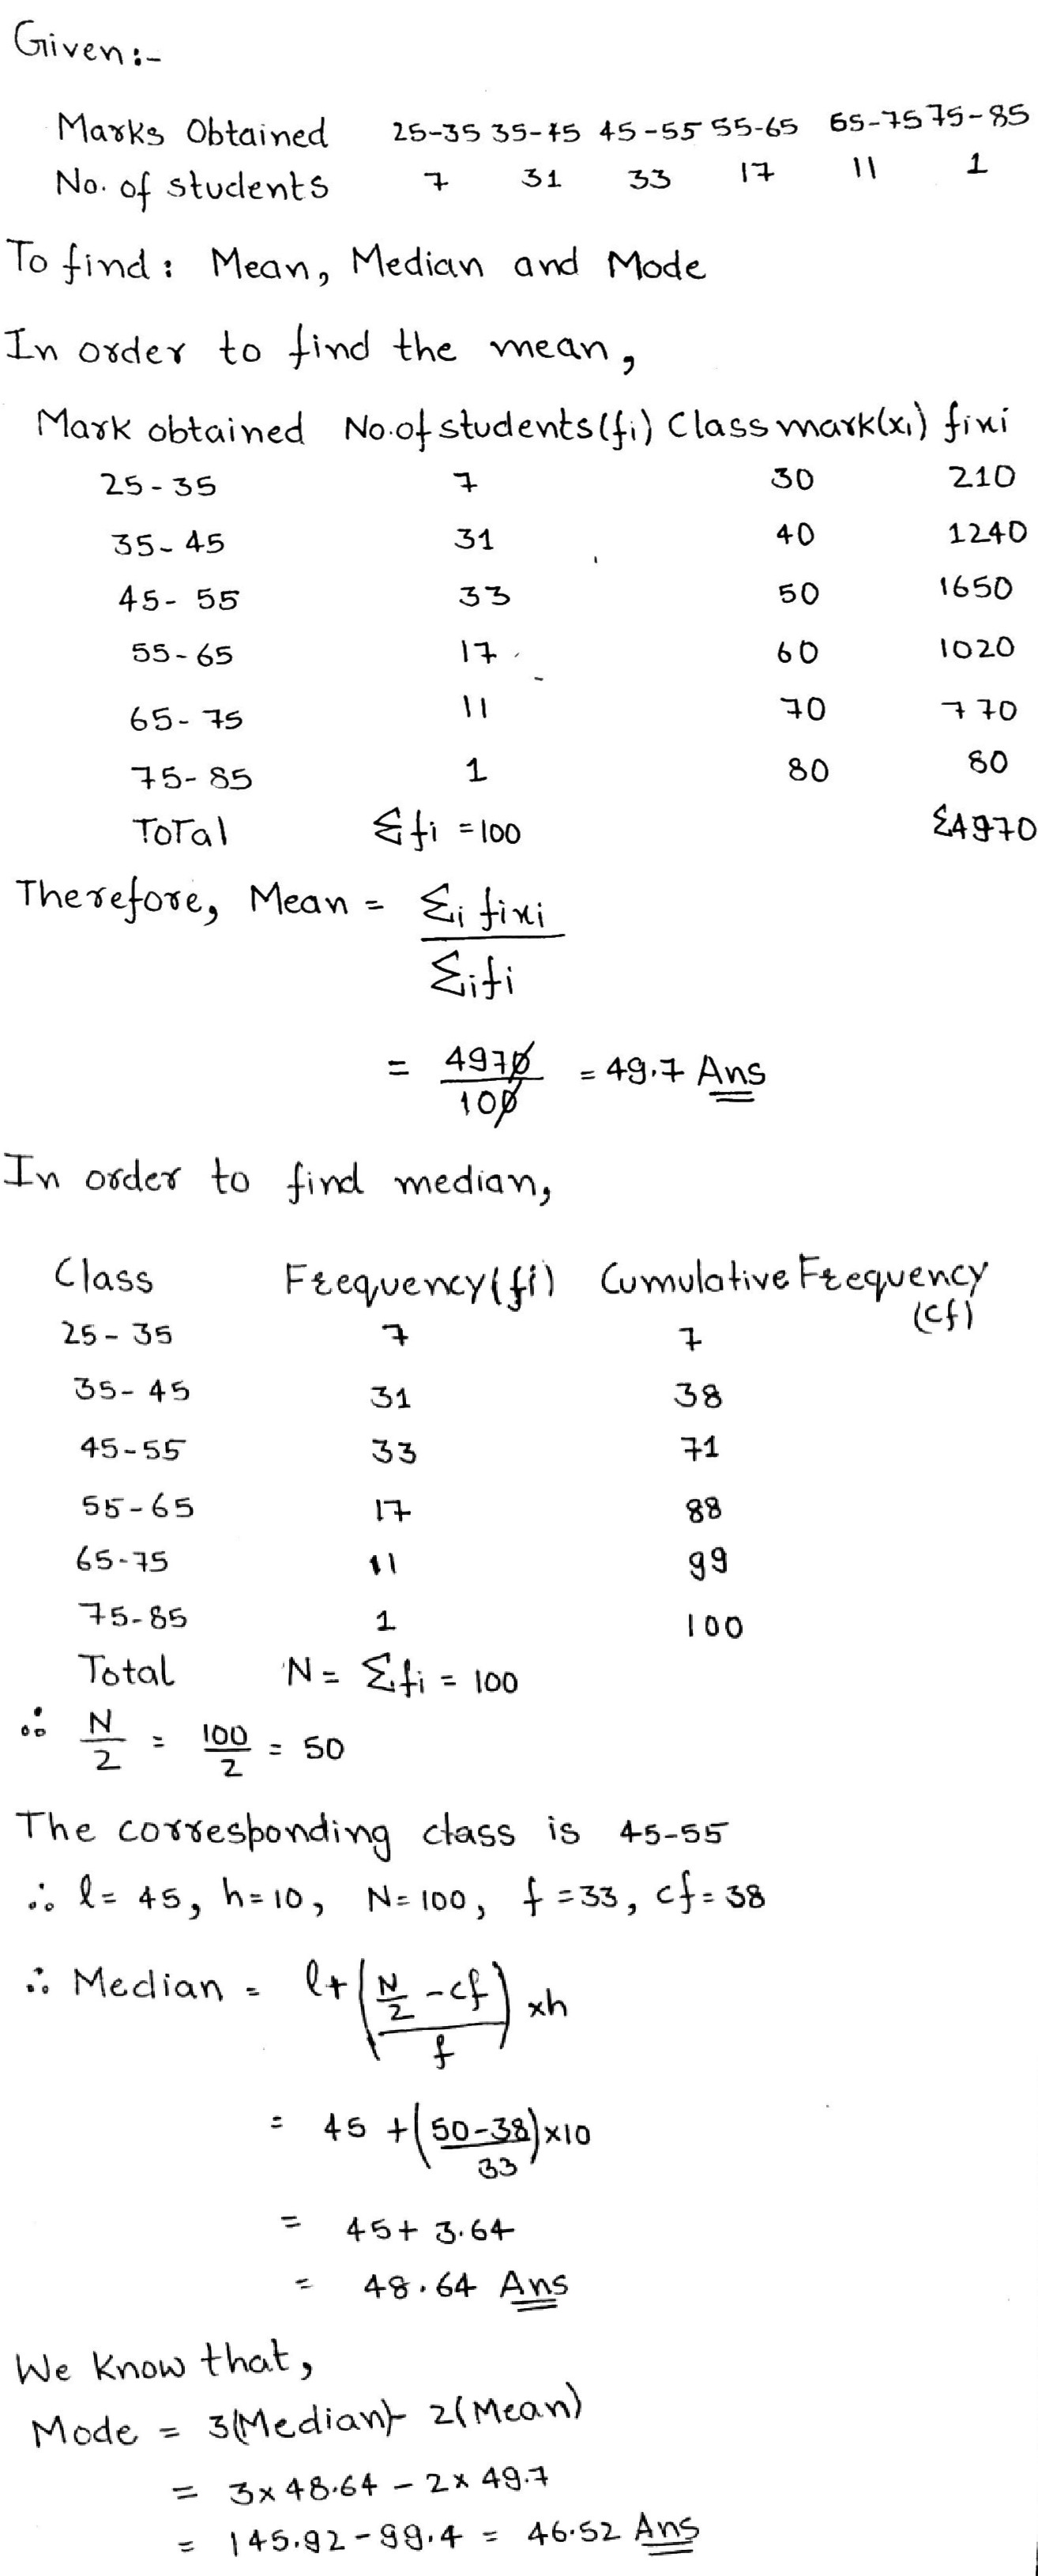
Find the mean, mode and median of the following data:
| Marks obtained | $$25-35$$ | $$35-45$$ | $$45-55$$ | $$55-65$$ | $$65-75$$ | $$75-85$$ |
| Number of students | $$7$$ | $$31$$ | $$33$$ | $$17$$ | $$11$$ | $$1$$ |
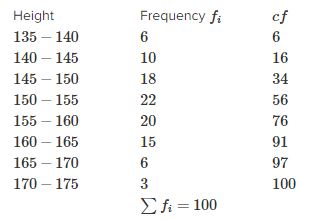
Given bellows is the number of units of electricity consumed in a week in a certain locality:
| Consumption (in unit) | $$65-85$$ | $$85-105$$ | $$105-125$$ | $$125-145$$ | $$145-165$$ | $$165-185$$ | $$185-205$$ |
| Number of consumers | $$4$$ | $$5$$ | $$13$$ | $$20$$ | $$14$$ | $$7$$ | $$4$$ |
Find Median value of Electricity Consumption.
Calculate the median from the following data:
| Height (in $$cm$$) | $$135-140$$ | $$140-145$$ | $$145-150$$ | $$150-155$$ | $$155-160$$ | $$160-165$$ | $$165-170$$ | $$170-175$$ |
| No of boys | $$6$$ | $$10$$ | $$18$$ | $$22$$ | $$20$$ | $$15$$ | $$6$$ | $$3$$ |
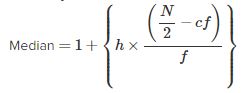
Median $$=1+\left\{h\times \dfrac {\left(\dfrac {N}{2}-cf \right)}{f}\right\}$$
Here
$$N=100$$
$$N/2=50$$
$$cf$$ just greater than $$50$$ is $$56$$
Median class $$=150-155$$
So, $$I=150,\ h=5,\ f=22$$ and
$$cf=cf$$ of preceding class i.e $$34$$
Substitute all the value in the above formula, we get
Median $$=150+\left\{5\times (50-34)/ 22\right\}$$
$$=150+3.64$$
$$=153.64$$
A survey reading the heights (in $$cm$$) of $$50$$ girls of a class was conducted and the following data was obtained:
| Height (in $$cm$$) | $$120-130$$ | $$130-140$$ | $$140-150$$ | $$150-160$$ | $$160-170$$ | Total |
| Number of girls | $$2$$ | $$8$$ | $$12$$ | $$20$$ | $$8$$ | $$50$$ |
If the median of the following frequency distribution is $$32.5$$, find the values of $$f1$$ and $$f2$$.
| Class interval | $$0-10$$ | $$10-20$$ | $$20-30$$ | $$30-40$$ | $$40-50$$ | $$50-60$$ | $$60-70$$ | Total |
| Frequency | $$f_1$$ | $$5$$ | $$9$$ | $$12$$ | $$f_2$$ | $$3$$ | $$2$$ | $$40$$ |
Calculate the mean and the median of the numbers: $$2, 1, 0, 3, 1, 2, 3, 4, 3, 5$$.
The mean of the numbers 1, 7, 5, 3, 4, and 4 is m. The numbers 3, 2, 4, 2, 3, 3, p have mean m$$-1$$ and median q. Find:
(i) p
(ii) q
(iii) the mean of p and q.
At a shooting competition, the scores of a competitor were as given below :
Score | 0 | 1 | 2 | 3 | 4 | 5 |
No. of shots | 0 | 3 | 6 | 4 | 7 | 5 |
State the modal class.
Class interval | 50-55 | 55-60 | 60-65 | 65-70 | 70-75 | 75-80 | 80-85 | 85-90 |
Frequency | 5 | 20 | 10 | 10 | 9 | 6 | 12 | 8 |
At a shooting competition, the scores of a competitor were as given below :
Score | 0 | 1 | 2 | 3 | 4 | 5 |
No. of shots | 0 | 3 | 6 | 4 | 7 | 5 |
For the given data below, calculate the mean, mode, and median.
$$6,2,5,4,3,4,4,2,3$$
Find the median of the given data if the mean is 4.5
$$5,7,7,8,x,5,4,3,1,2$$
A die was thrown 15 times and the outcomes recorded were
$$5,3,4,1,2,6,4,2,2,3,1,5,6,1,2$$
Find the mean, median and mode of the data.
Calculate the Mean, Median and Mode of the following data:
$$5,10,10,12,13$$
Are these three equal?
In calculating the mean of grouped data, grouped in classes of equal width, we may use the formula
$$\overline{x}=a+ \dfrac{f_i d_i}{f_i}$$
where $$a$$ is the assumed mean. a must be one of the mid-points of the classes. Is the last statement correct? Justify your answer.
The monthly income of 100 families are given as below:
| Income (in Rs) | Number of families |
| 0-5000 | 8 |
| 5000-10000 | 26 |
| 10000-15000 | 41 |
| 15000-20000 | 16 |
| 20000-25000 | 3 |
| 25000-30000 | 3 |
| 30000-35000 | 2 |
| 35000-40000 | 1 |
The daily income of a sample of 50 employees are tabulated as follows:
| Income (in Rs) | 1-200 | 201-400 | 401-600 | 601-800 |
| Number of employees | 14 | 15 | 14 | 7 |
Calculate the mean of the following data:
| Class | 4-7 | 8-11 | 12-15 | 16-19 |
| Frequency | 5 | 4 | 9 | 10 |
In calculating the mean of grouped data, grouped in classes of equal width, we may use the formula
$$\overline{x}=a+ \dfrac{f_i d_i}{f_i}$$
where $$a$$ is the assumed mean. a must be one of the mid-points of the classes. Is the last statement correct? Justify your answer.
The weights (in kg) of 50 wrestlers are recorded in the following table:
| Weight (in kg) | 100-110 | 110-120 | 120-130 | 130-140 | 140-150 |
| Number of wrestlers | 4 | 14 | 21 | 8 | 3 |
Calculate the mean, the median and the mode of the following numbers:
$$3, 7, 2, 5, 3, 4, 1, 5, 3, 6$$
Calculate the mean, the median and the mode of the numbers:
$$1, 3, 2, 6, 2, 3, 1, 3$$
Will the median class and modal class of grouped data always be different? Justify your answer.
Find the mean and the median of the following data:
$$5, 3, 12, 0, 7, 11, 4, 3, 9$$
Find the mean and the median of :
$$10,12,12,15,15,17,18,18,18$$ and $$19$$
Find the mean and the median of :
$$1,3,4,5,9,9,$$ and $$11$$
Find the mean and the median of :
$$1.2,1.9,2.2,2.6$$ and $$2.9$$
Find the mean and the median of :
$$5,8,10,11,13,16,19$$ and $$20$$
The mean of $$1, 7, 5, 3, 4$$ and $$4$$ is $$m.$$ The numbers $$3, 2, 4, 2, 3, 3$$ and $$p$$ have mean $$m 1$$ and median $$q.$$ Find $$p$$ and $$q$$
Find the median of the given data.
The marks of $$20$$ students in a test were as follows:
$$2, 6, 8, 9, 10, 11, 11, 12, 13, 13, 14, 14, 15, 15, 15, 16, 16, 18, 19$$ and $$20.$$
Calculate:
(i) the mean (ii) the median (iii) the mode
A frequency distribution table for the production of oranges of some farm owners in given below. Find the mean production of oranges by 'assured mean' method.
| Production (Thousand rupees) | 25 - 30 | 30 - 35 | 35 - 40 | 40 - 45 | 45 - 50 |
| No of farm owners | 20 | 25 | 15 | 10 | 10 |
Find the mean and the median of all the positive factors of 72.
Find the mean and median of the data:
35, 48, 92, 76, 64, 52, 51, 63 and 71.
If 51 is replaced by 66, what will be the new median?
Find the mean and median of the data:
35, 48, 92, 76, 64, 52, 51, 63 and 71.
The following data gives the information on the observed lifetimes (in hours) of 225 electrical components:
| Lifetimes (in hours) | 0 - 20 | 20 - 40 | 40 - 60 | 60 - 80 | 80 - 100 | 100 - 120 |
| Frequency | 10 | 35 | 52 | 61 | 38 | 29 |
The following table shows the ages of the patients admitted in a hospital during a year :
| Ages (in years) | 5 - 15 | 15 - 25 | 25 - 35 | 35 - 45 | 45 - 55 | 55 - 65 |
| No. of patients | 6 | 11 | 21 | 23 | 14 | 5 |
The following distribution gives the state-wise teacher-student ratio in higher secondary schools of India. Find the mode and mean of this data. interpret the two measures.
| No. of Students per Teacher | No. of States/U.T |
| 15 - 20 | 3 |
| 20 - 25 | 8 |
| 25 - 30 | 9 |
| 30 - 35 | 10 |
| 35 - 40 | 3 |
| 40 - 45 | 0 |
| 45 - 50 | 0 |
| 50 - 55 | 2 |
Write the modal class for the given frequency distribution
| Class interval | 1 - 5 | 5 - 10 | 10 - 15 | 15 - 20 | 20 - 25 | 25 - 30 |
| Frequency | 5 | 12 | 09 | 15 | 14 | 3 |
Write the median class for the given frequency distribution.
| Class mark | 10 - 15 | 15 - 20 | 20 - 25 | 25 - 30 | 30 - 35 |
| Cumulative frequency | 5 | 12 | 18 | 25 | 40 |
The following data gives the distribution of total monthly household expenditure of 200 families of a village. Find the modal monthly expenditure of the families. Also, and the mean monthly expenditure:
| Expenditure (?) | No. of families |
| 1000 - 1500 | 24 |
| 1500 - 2000 | 40 |
| 2000 - 2500 | 33 |
| 2500 - 3000 | 28 |
| 3000 - 3500 | 30 |
| 3500 - 4000 | 22 |
| 4000 - 4500 | 16 |
| 4500 - 5000 | 7 |
find the mean from mode for data
| $$x_{i}$$ | 10 | 20 | 30 | 40 | 50 | 60 | 70 | 80 |
| $$f_{i}$$ | 2 | 8 | 16 | 26 | 20 | 16 | 7 | 5 |
find the mean from mode for data
| $$x{i}$$ | 3 | 4 | 5 | 6 | 7 | 8 |
| $$fv$$ | 2 | 4 | 6 | 3 | 2 | 1 |
find the mean from mode for data
| Income (daily) | Number |
| 0-10 | 4 |
| 10-20 | 8 |
| 20-30 | 9 |
| 30-40 | 10 |
| 40-50 | 7 |
| 50-60 | 5 |
| 60-70 | 4 |
| 70-80 | 3 |
find the mean from mode for data
| Height (cm) | 95-10 | 105-115 | 115-125 | 125-135 | 135-145 | 145-155 |
| Number | 9 | 13 | 26 | 30 | 12 | 10 |
find the mean from mode for data
| Age | Number |
| 16-20 | 5 |
| 21-35 | 6 |
| 26-30 | 12 |
| 31-35 | 14 |
| 36-40 | 26 |
| 41-45 | 12 |
| 46-50 | 16 |
| 51-55 | 9 |
find the mean from mode for data
| Marks | Number |
| 10-20 | 3 |
| 20-30 | 4 |
| 30-40 | 7 |
| 40-50 | 8 |
| 50-60 | 2 |
| 60-70 | 1 |
Runs scored by players of a cricket team are as follows:
57, 17, 26, 91, 115, 26, 83, 41, 57, 0, 26
Find their arithmetic mean, median and mode.
Following frequency distribution represents electricity cost 0f 68 users in a colony. Find mean, median and mode from these data.
| Monthly consumption | 65-85 | 85-105 | 105-125 | 125-145 | 145-165 | 165-185 | 185-205 |
| Number of users | 4 | 5 | 13 | 20 | 14 | 8 | 4 |
The following number of goals were scored by a football team in a series of $$10$$ matches : $$2, 3, 4, 5,1, 3, 3, 4, 3$$
Find the mean, median and mode of these scores.
Find the mode from the following data:
| Variable | 0-10 | 10-20 | 20-30 | 30-40 | 40-50 | 50-60 | 60-70 |
| Frequency | 7 | 12 | 18 | 25 | 16 | 14 | 8 |
Find the mean for the following frequency distribution:
|
Class |
Frequency (f) |
|
0-10 |
5 |
|
10-20 |
8 |
|
20-30 |
15 |
|
30-40 |
16 |
|
40-50 |
6 |
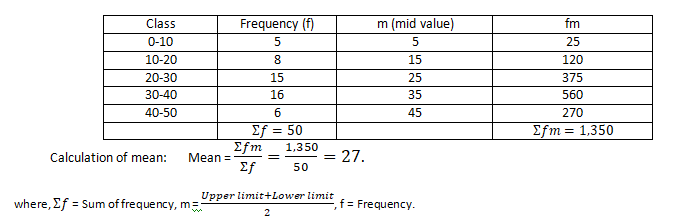
Find out missing frequency Iif the arithmetic mean of the following series is8.
| X | 20 | 30 | 40 | 50 | 60 | 70 |
| F | 5 | ? | 15 | 10 | 8 | 5 |
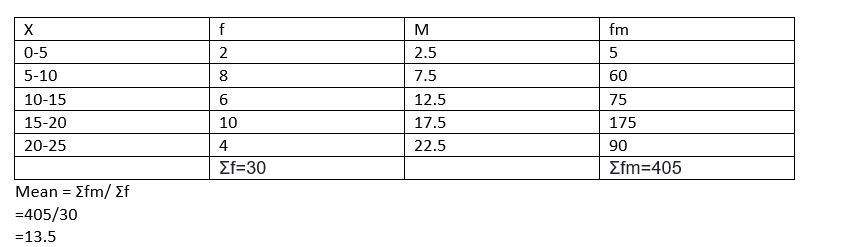
Calculate the arithmetic mean of the marks secured by students of a class in their weekly test.
| Marks | 0-5 | 5-10 | 10-15 | 15-20 | 20-25 |
| No. of students | 2 | 8 | 6 | 10 | 4 |
The following frequency distribution gives the monthly consumption of electricity of $$70$$ customers of a certain locality:
| Monthly consumptions of Electricity (in units) | Frequency No. of consumers |
| $$65 - 85$$ | $$4$$ |
| $$85 - 105$$ | $$5$$ |
| $$105 - 125$$ | $$13$$ |
| $$125 - 145$$ | $$22$$ |
| $$145 - 165$$ | $$14$$ |
| $$165 - 185$$ | $$8$$ |
| $$185 - 205$$ | $$4$$ |
The distribution below gives the weights of $$30$$ students of a class. Find the median weight of the students.
| Weight (in $$kg$$) | $$40-45$$ | $$45-50$$ | $$50-55$$ | $$55-60$$ | $$60-65$$ | $$65-70$$ | $$70-75$$ |
| Number of students | $$2$$ | $$3$$ | $$8$$ | $$6$$ | $$6$$ | $$3$$ | $$2$$ |
The following frequency distribution gives the monthly consumption of electricity of $$70$$ consumers of a locality.
| Monthly Consumption(Units) | No. of Consumers |
| $$65-85$$ | $$04$$ |
| $$85-105$$ | $$05$$ |
| $$105-125$$ | $$13$$ |
| $$125-145$$ | $$22$$ |
| $$145-165$$ | $$14$$ |
| $$265-185$$ | $$08$$ |
| $$185-205$$ | $$04$$ |
Obtain the mean number of bags sold by a shopkeeper on $$6$$ consecutive days from the following table.
| Days | Monday | Tuesday | Wednesday | Thursday | Friday | Saturday |
| No. of bags sold | $$55$$ | $$32$$ | $$30$$ | $$25$$ | $$10$$ | $$20$$ |
The following table shows the age distribution of cases of a certain disease reported during a year in a particular city.
| Age in years | $$5-14$$ | $$15-24$$ | $$25-34$$ | $$35-44$$ | $$45-54$$ | $$55-64$$ |
| No. of cases | $$6$$ | $$11$$ | $$12$$ | $$10$$ | $$7$$ | $$4$$ |
Find the median for the following frequency table.
| Value | $$12$$ | $$13$$ | $$15$$ | $$19$$ | $$22$$ | $$23$$ |
| Frequency | $$4$$ | $$2$$ | $$4$$ | $$4$$ | $$1$$ | $$5$$ |
The median of 230 observations isFind $$a$$ and $$b$$.
| Class | 10-20 | 20-30 | 30-40 | 40-50 | 50-60 | 60-70 |
| Frequency | 12 | 30 | $$a$$ | 65 | $$b$$ | 25 |
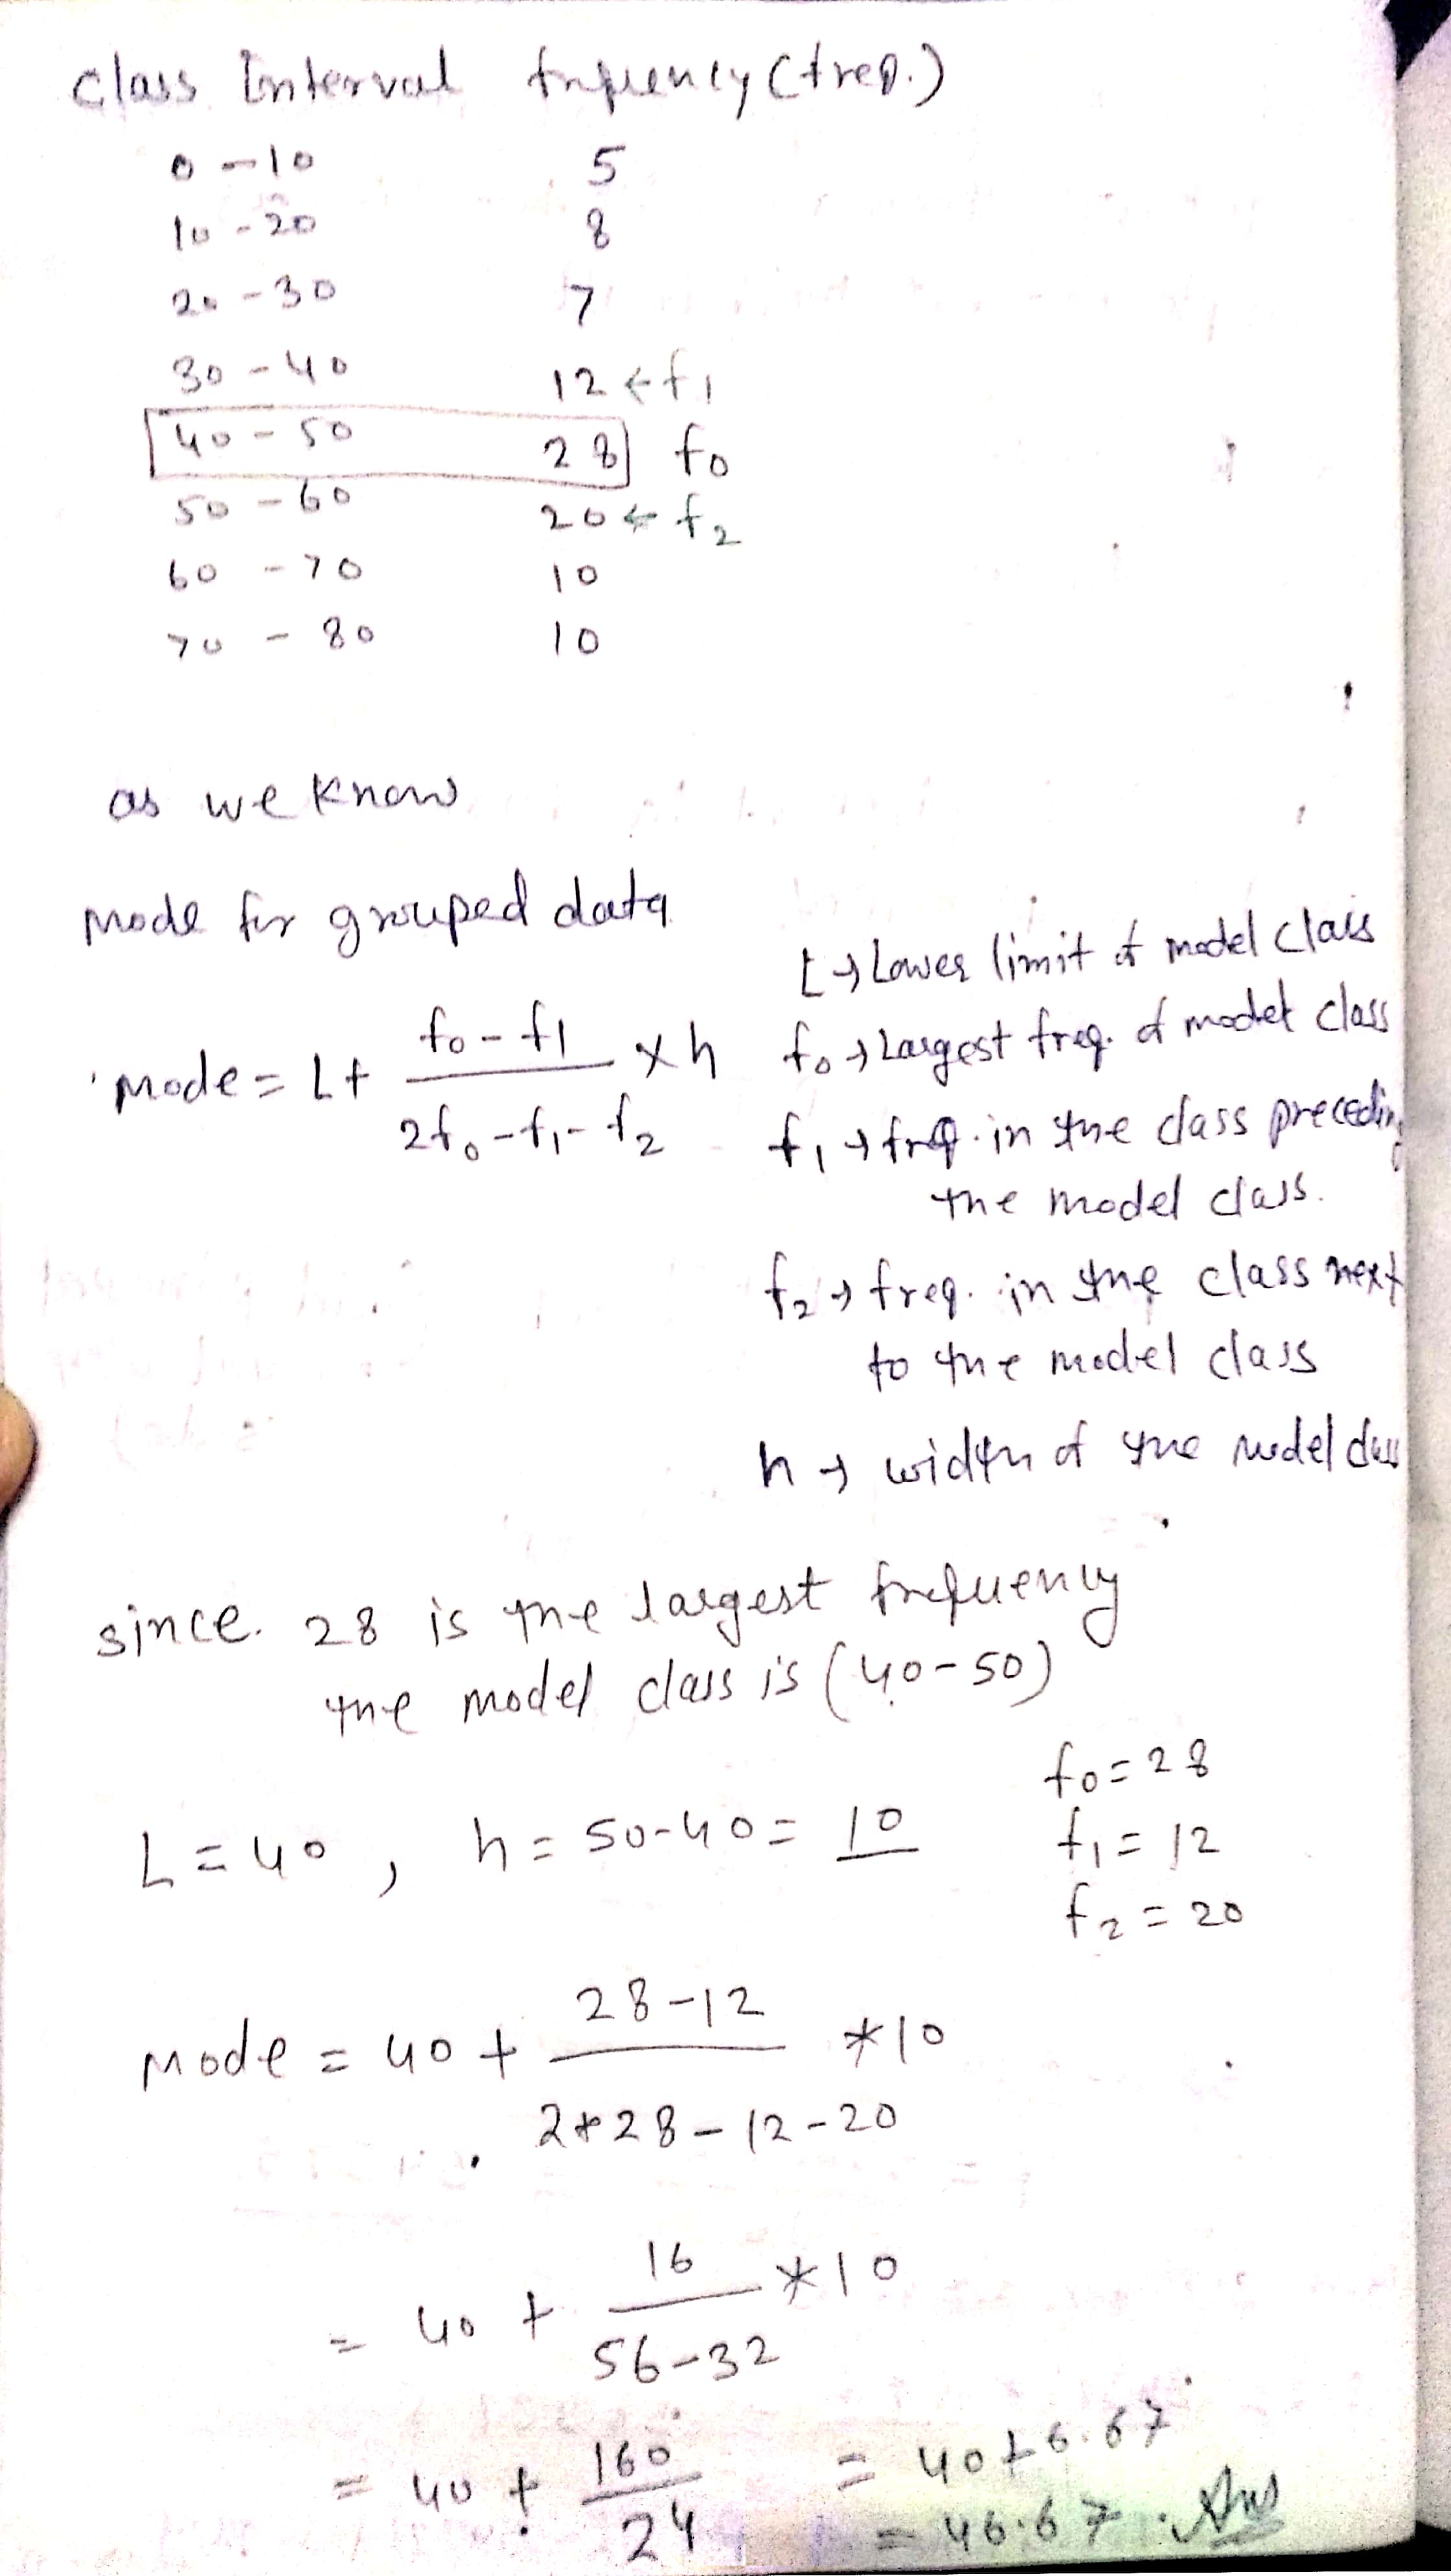
Find the mode for the following distribution:
| Class-interval | Frequency |
| 0-10 | 5 |
| 10-20 | 8 |
| 20-30 | 7 |
| 30-40 | 12 |
| 40-50 | 28 |
| 50-60 | 20 |
| 60-70 | 10 |
| 70-80 | 10 |
1)Numbers $$50,42,35,2 x + 10,2 x - 8,12,11,8$$ are written in descending order and their median is $$25$$ find $$x$$.
2)Find the median of data: $$15,6,16,8,22,21,9,18,25$$.
3)Find the mean,median and mode of the data: $$10,15,18,10,10,20,10,20,15,21,15,25$$.
The following table gives the numbers of branches and number plants in a garden of a school.
| No. of branches | $$2$$ | $$3$$ | $$4$$ | $$5$$ | $$6$$ |
| No. of plants | $$14$$ | $$21$$ | $$28$$ | $$20$$ | $$17$$ |
The table below classifies $$60$$ students in a class according to their heights.
| Height (cm) | Number of students |
| 140-145 | 5 |
| 145-150 | 8 |
| 150-155 | 12 |
| 155-160 | 16 |
| 160-165 | 11 |
| 165-170 | 5 |
| 170-175 | 3 |
Find the median for the following data.
| Height (ft) | $$5-10$$ | $$10-15$$ | $$15-20$$ | $$20-25$$ | $$25-30$$ |
| No. of trees | $$4$$ | $$3$$ | $$10$$ | $$8$$ | $$5$$ |
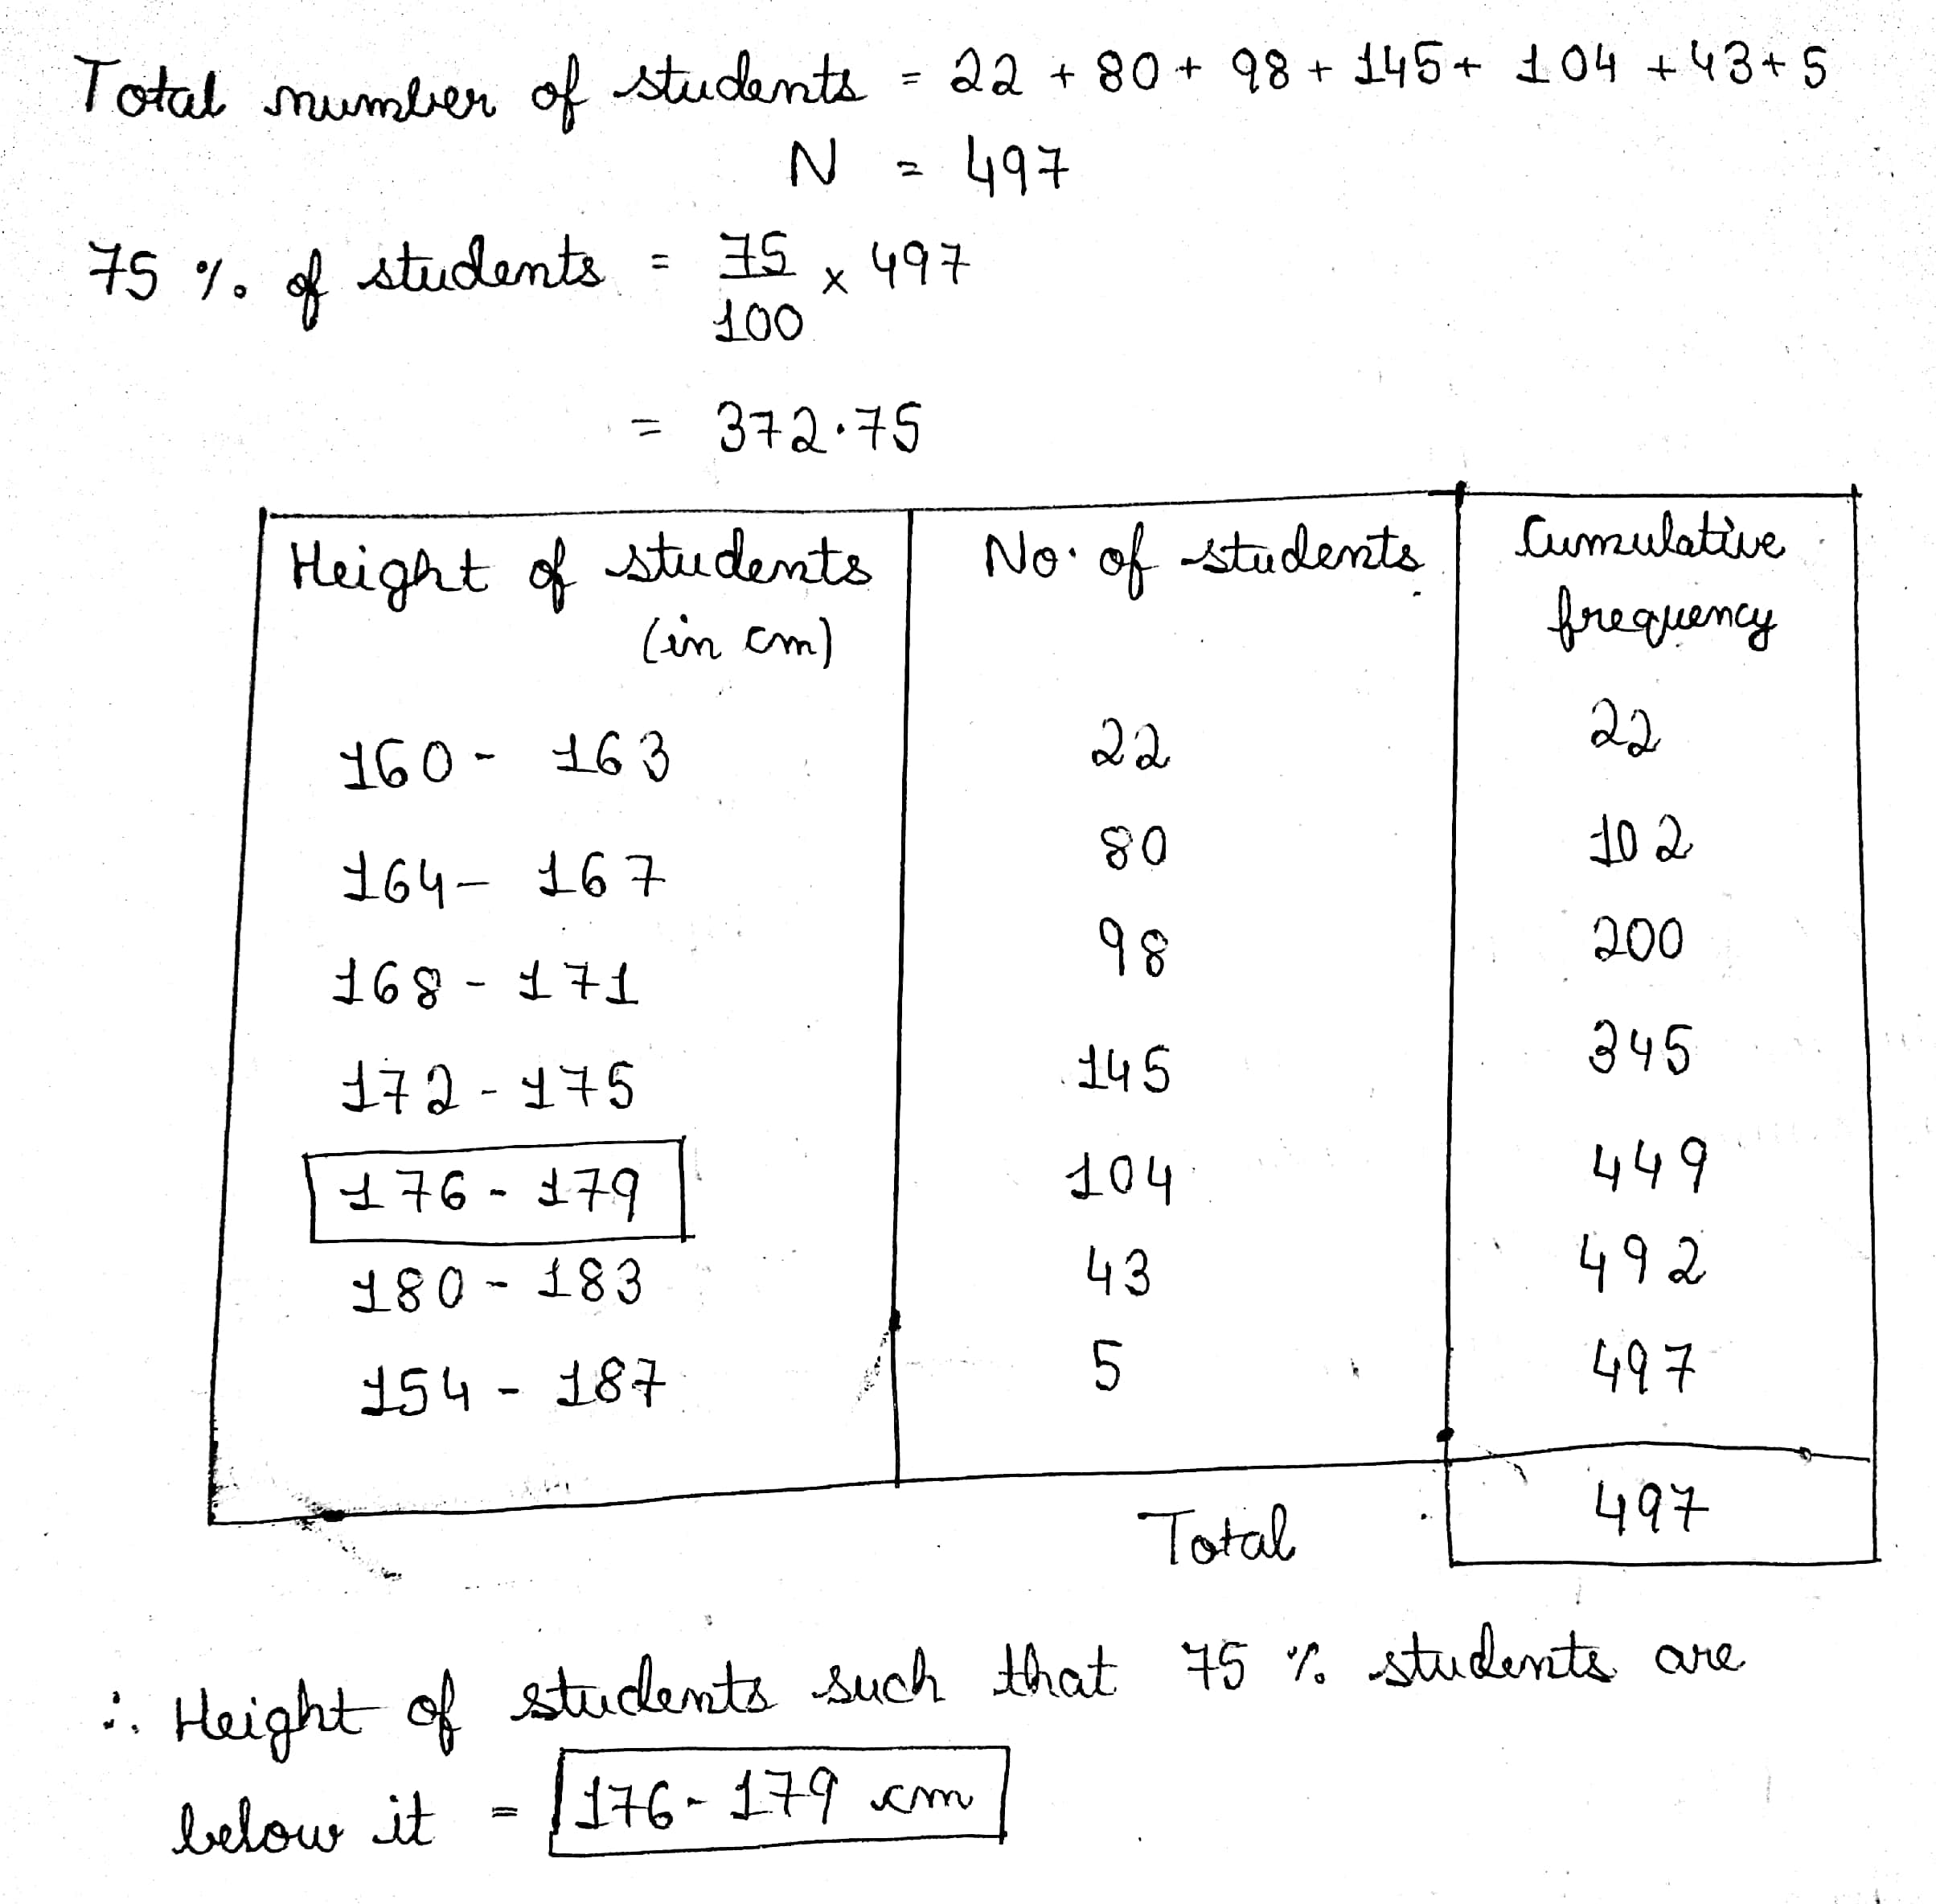
The heights of the student of the college are given below:
Height of (in cm) | No. of students |
160-163 | 22 |
164-167 | 80 |
168-171 | 98 |
172-175 | 145 |
176-179 | 104 |
180-183 | 43 |
154-187 | 5 |
Calculate the height of students such that 75% students are below it.
The following table shows the distribution of weights of $$100$$ candidates appearing for a competition. Determine the model weight.
| Weight $$(in\ kg)$$ | $$50-55$$ | $$55-60$$ | $$60-65$$ | $$65-70$$ | $$70-75$$ | $$75-80$$ |
| Number of candidates | $$13$$ | $$18$$ | $$45$$ | $$16$$ | $$06$$ | $$02$$ |
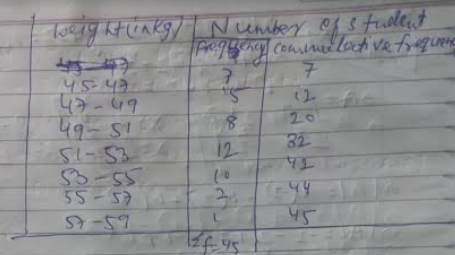
Find the median class of the following distribution.
| Weight (in $$kg$$) | Number of students |
| $$45-47$$ | $$7$$ |
| $$47-49$$ | $$5$$ |
| $$49-51$$ | $$8$$ |
| $$51-53$$ | $$12$$ |
| $$53-55$$ | $$10$$ |
| $$55-57$$ | $$2$$ |
| $$57-59$$ | $$1$$ |
Calculate the median for the following data frequency
| C.I | 0-20 | 20-40 | 40-60 | 60-80 | 80-100 | 100-120 | 120-140 |
| Freq. | 6 | 8 | 10 | 12 | 6 | 5 | 3 |
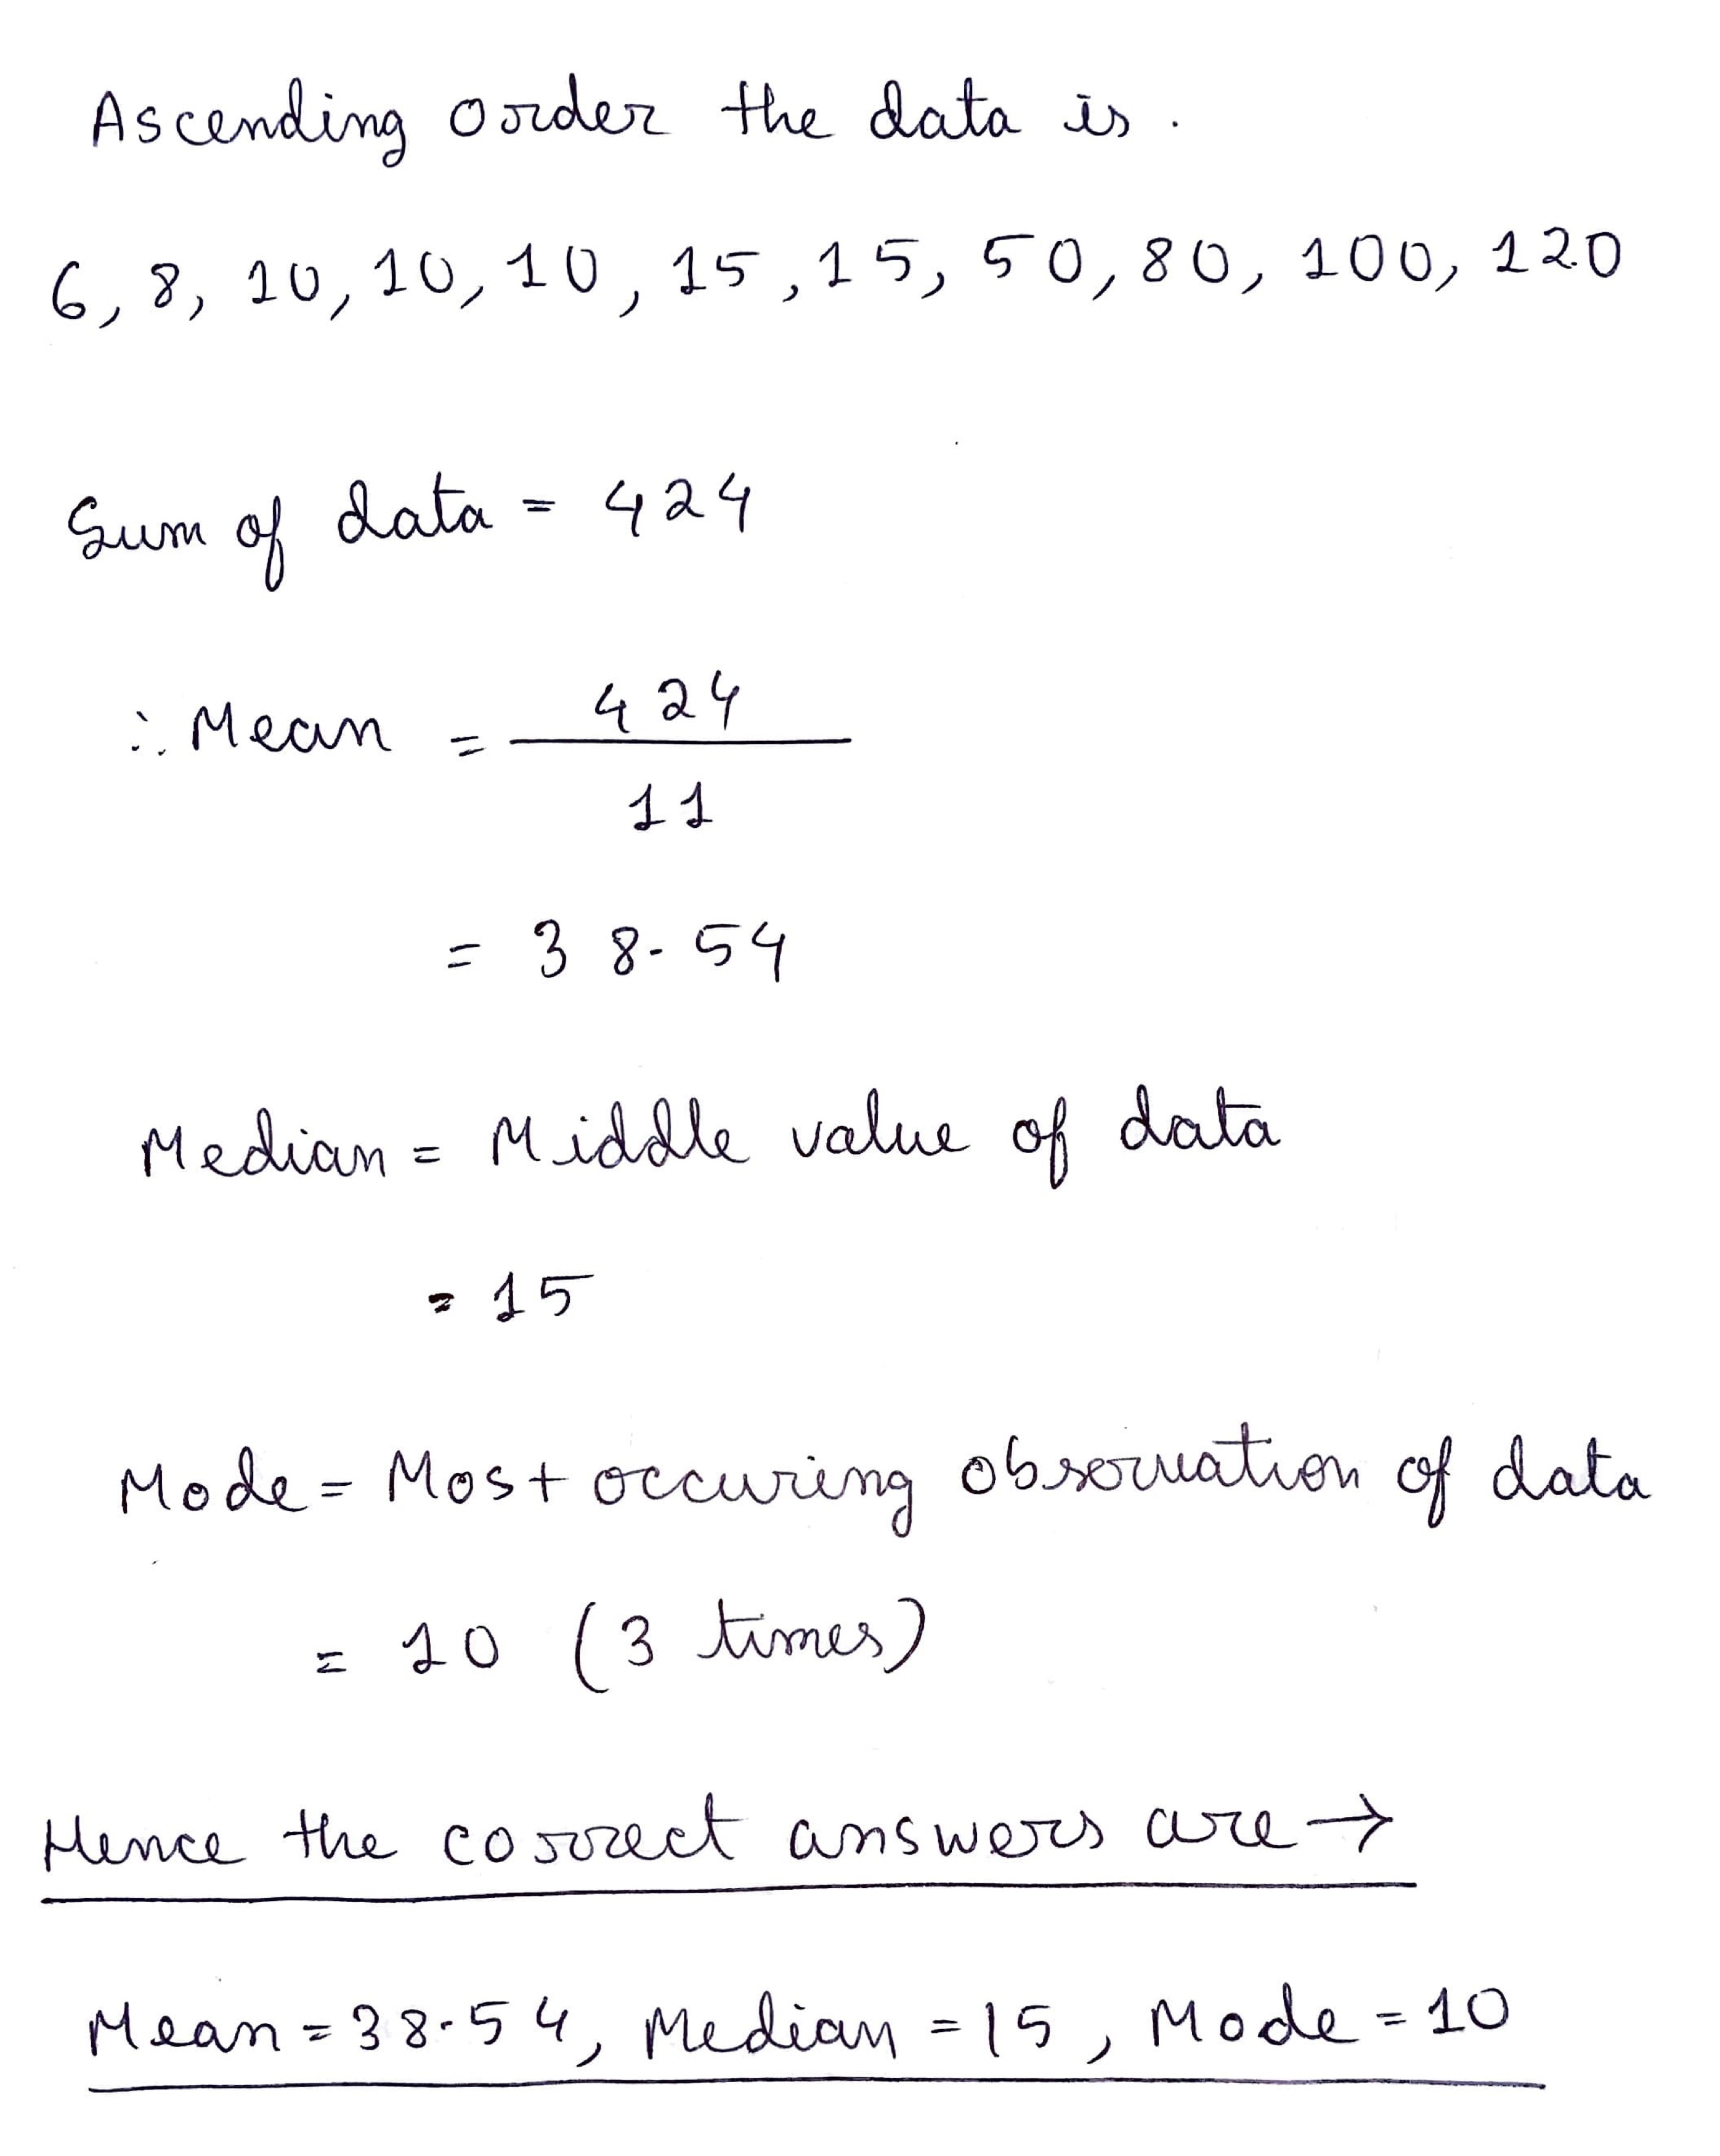
The runs scored in a cricket match by 11 players are as follows:
$$6,15,120,50,100,80,10,15,8,10,10$$
Find the mean, mode and median of this data.
Calculate the mode for the following frequency distribution table:
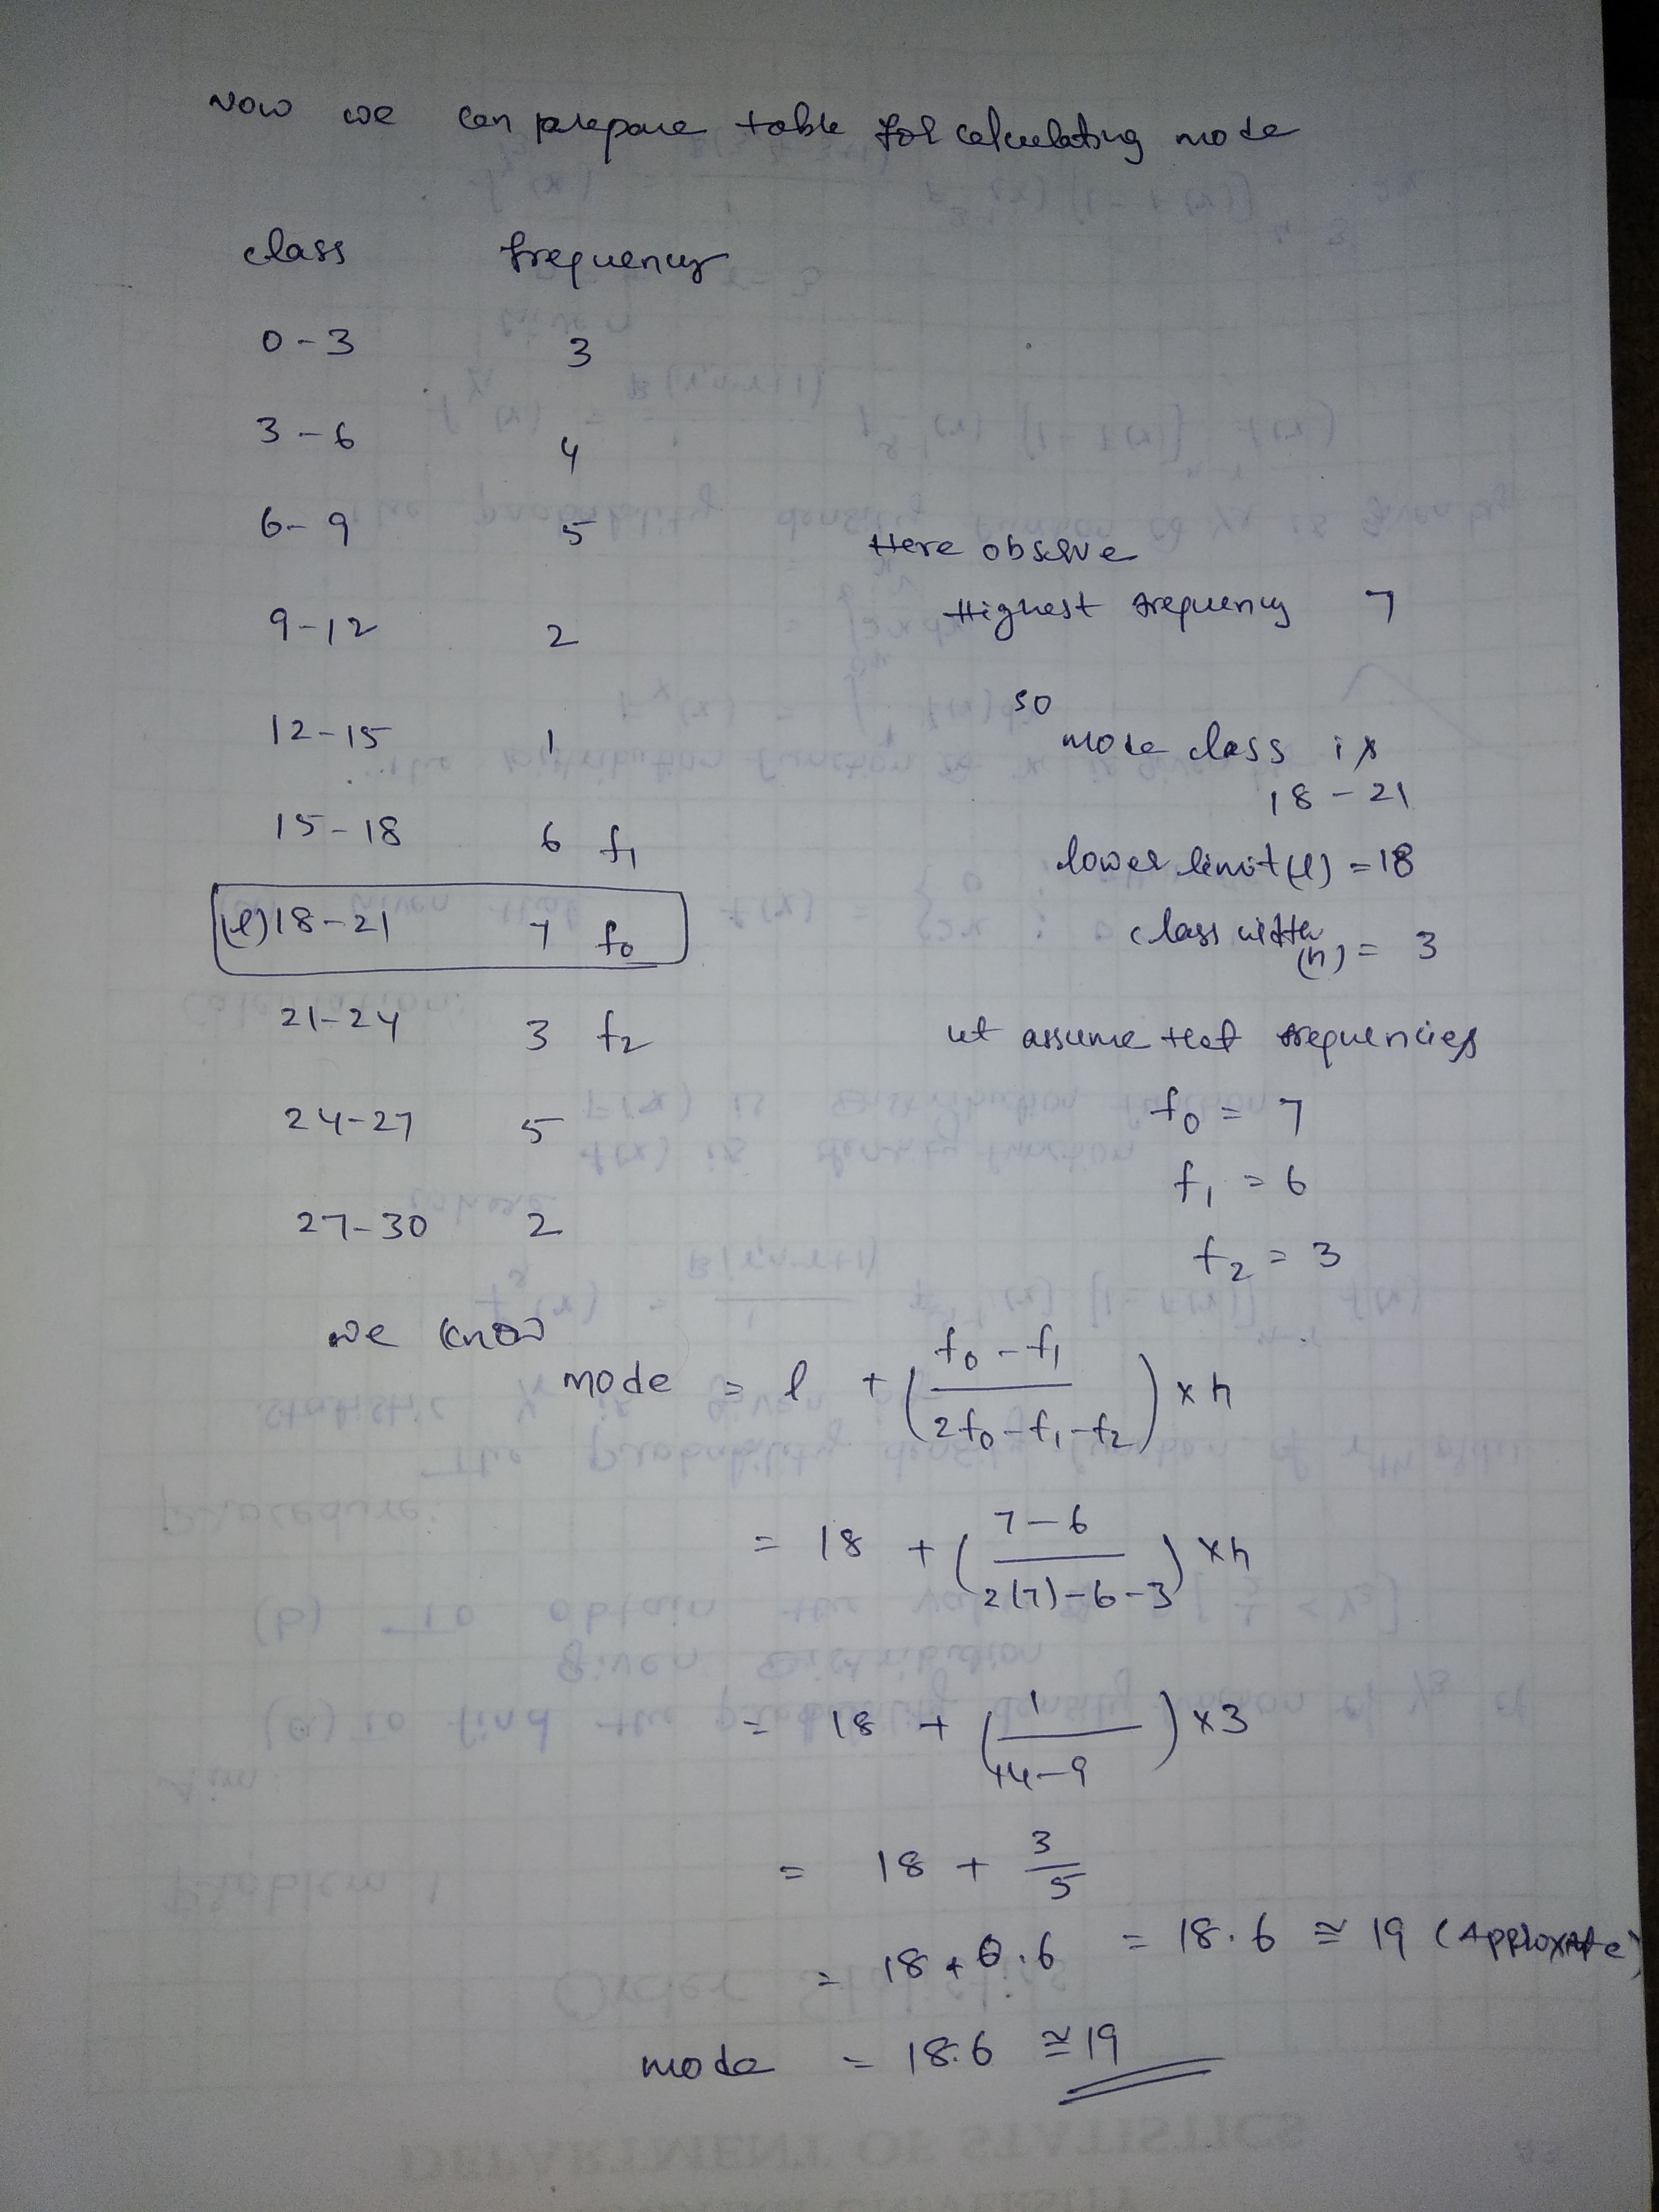
Compute the mode for the following frequency distribution.
Class | Frequency |
0-3 | 3 |
3-6 | 4 |
6-9 | 5 |
9-12 | 2 |
12-15 | 1 |
15-18 | 6 |
18-21 | 7 |
21-24 | 3 |
24-27 | 5 |
27-30 | 2 |
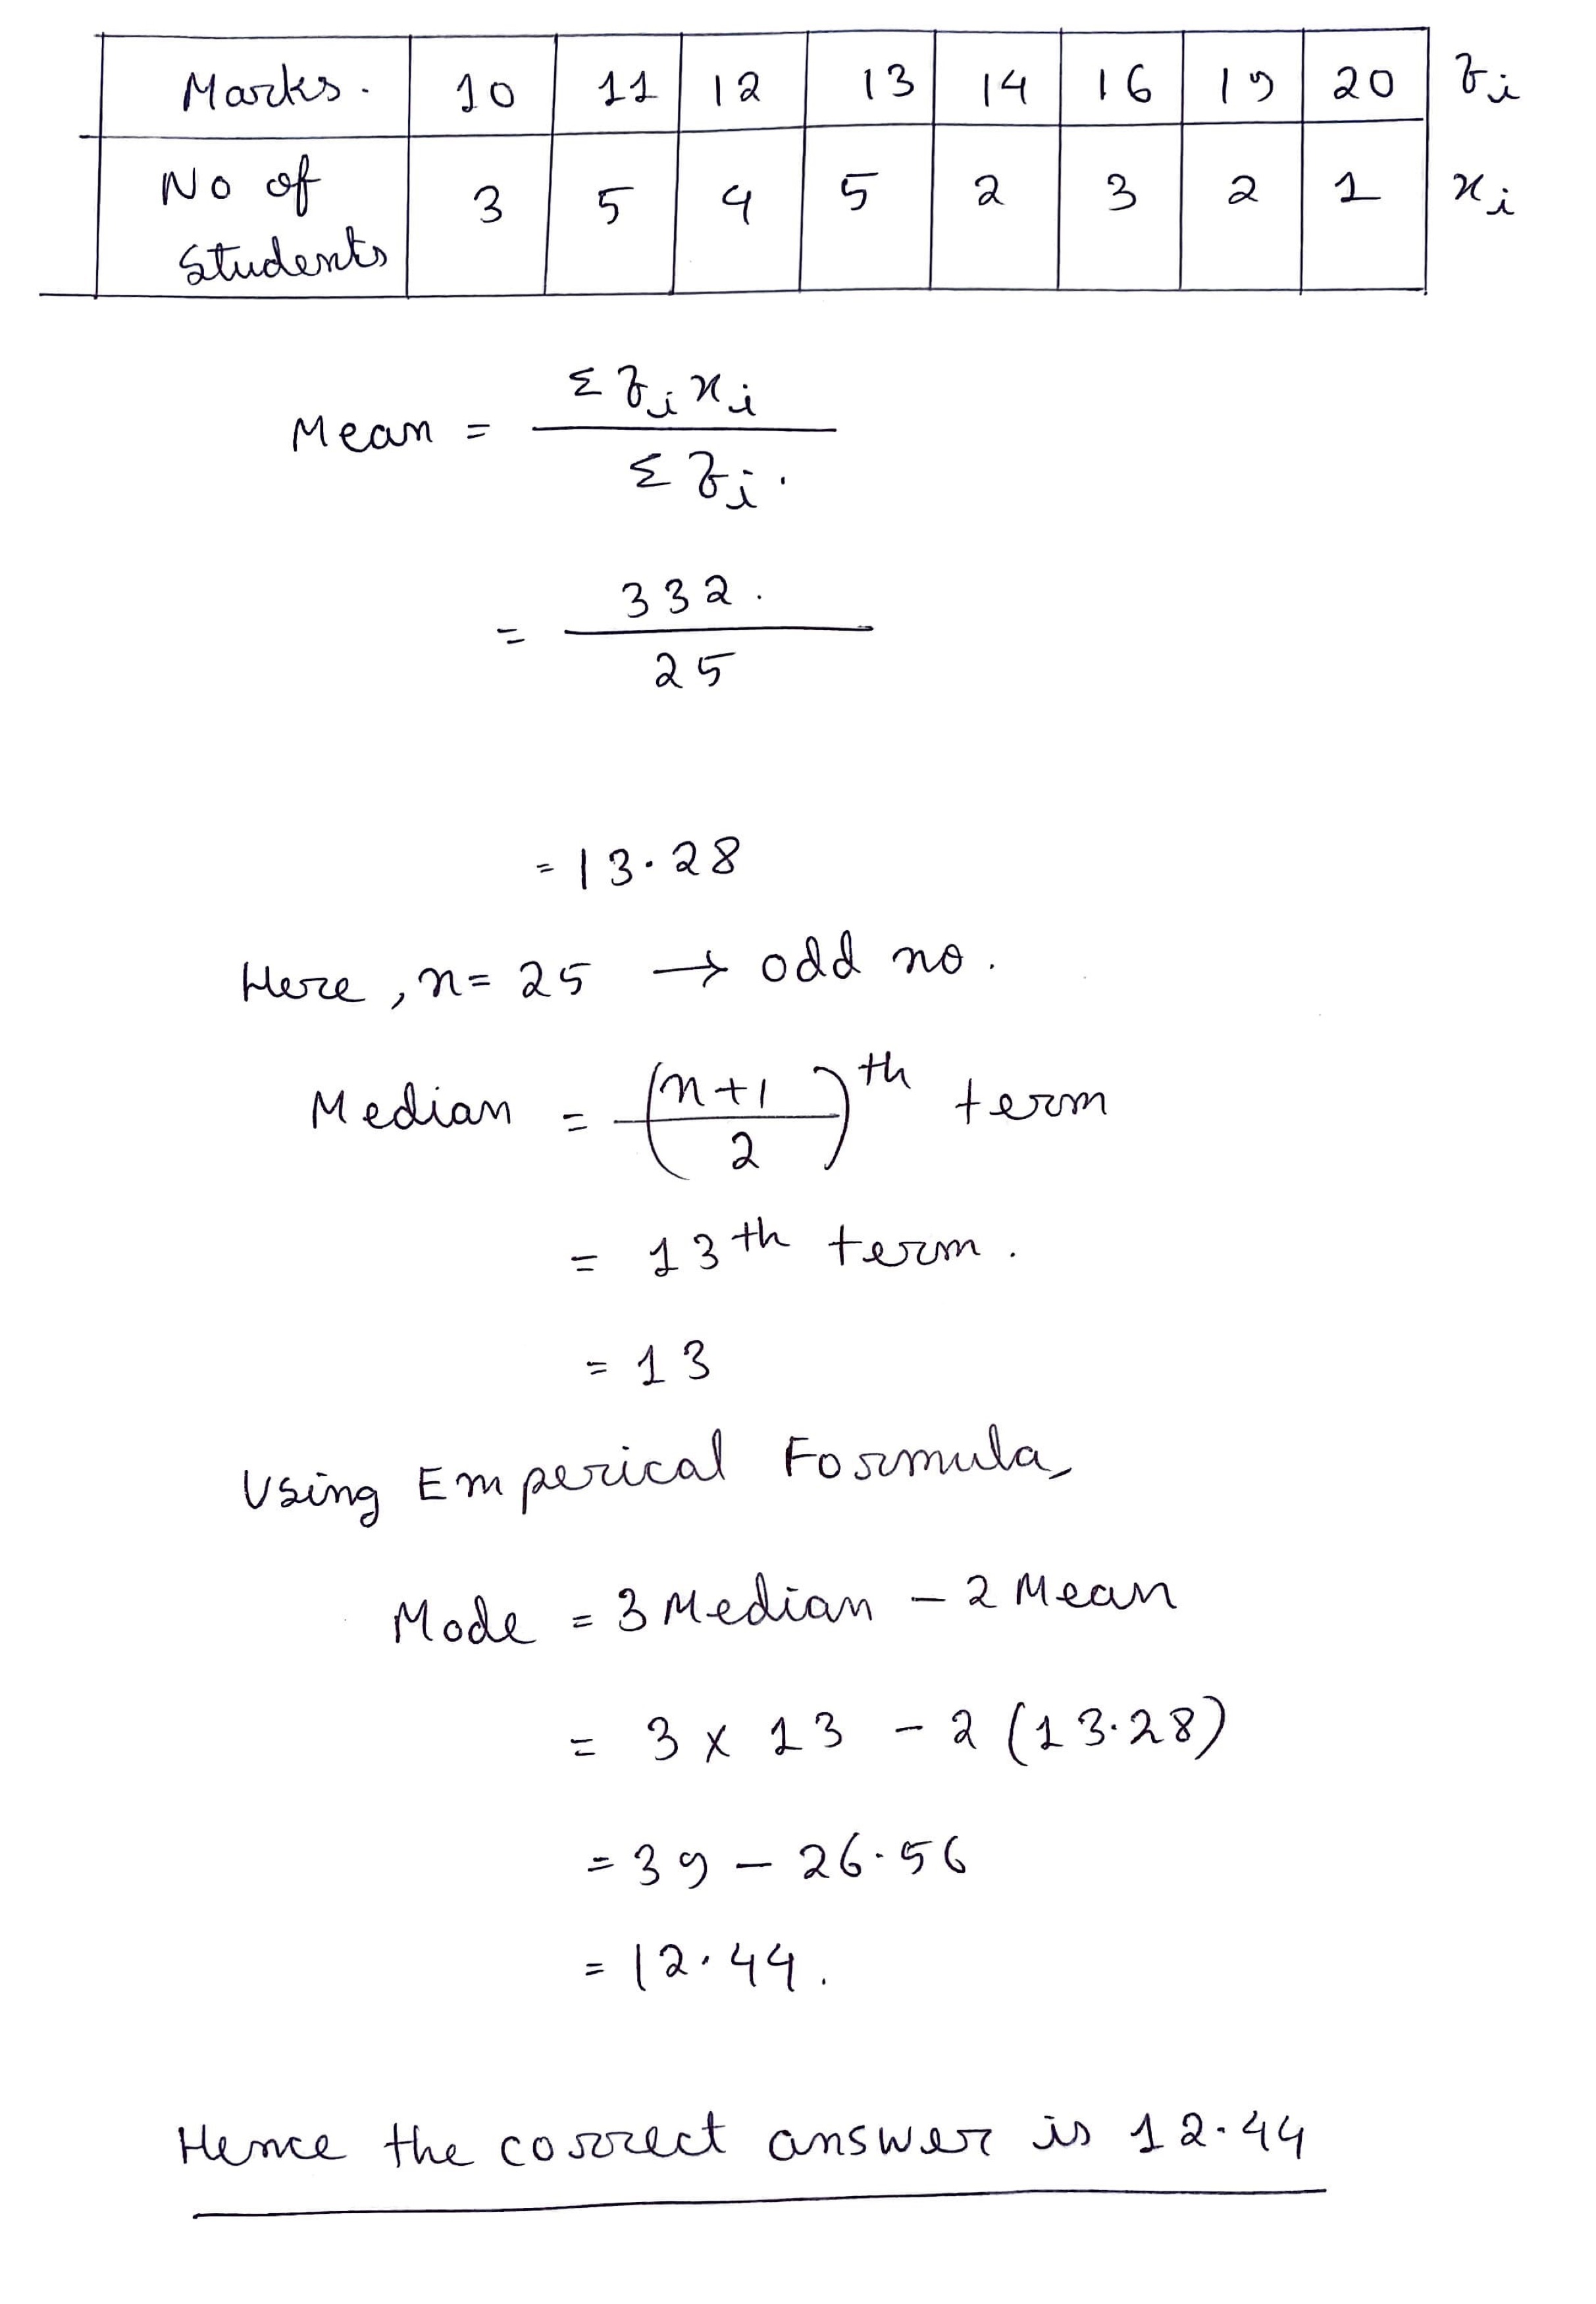
Calculate the mean and median for the following data:
| Marks | 10 | 11 | 12 | 13 | 14 | 16 | 19 | 20 |
| Number of students: | 3 | 5 | 4 | 5 | 2 | 3 | 2 | 1 |
The marks of $$15$$ students in an examination are:
25, 19, 17, 24, 23, 29, 31, 40, 19, 20, 22, 26, 17, 35,Find the median score.
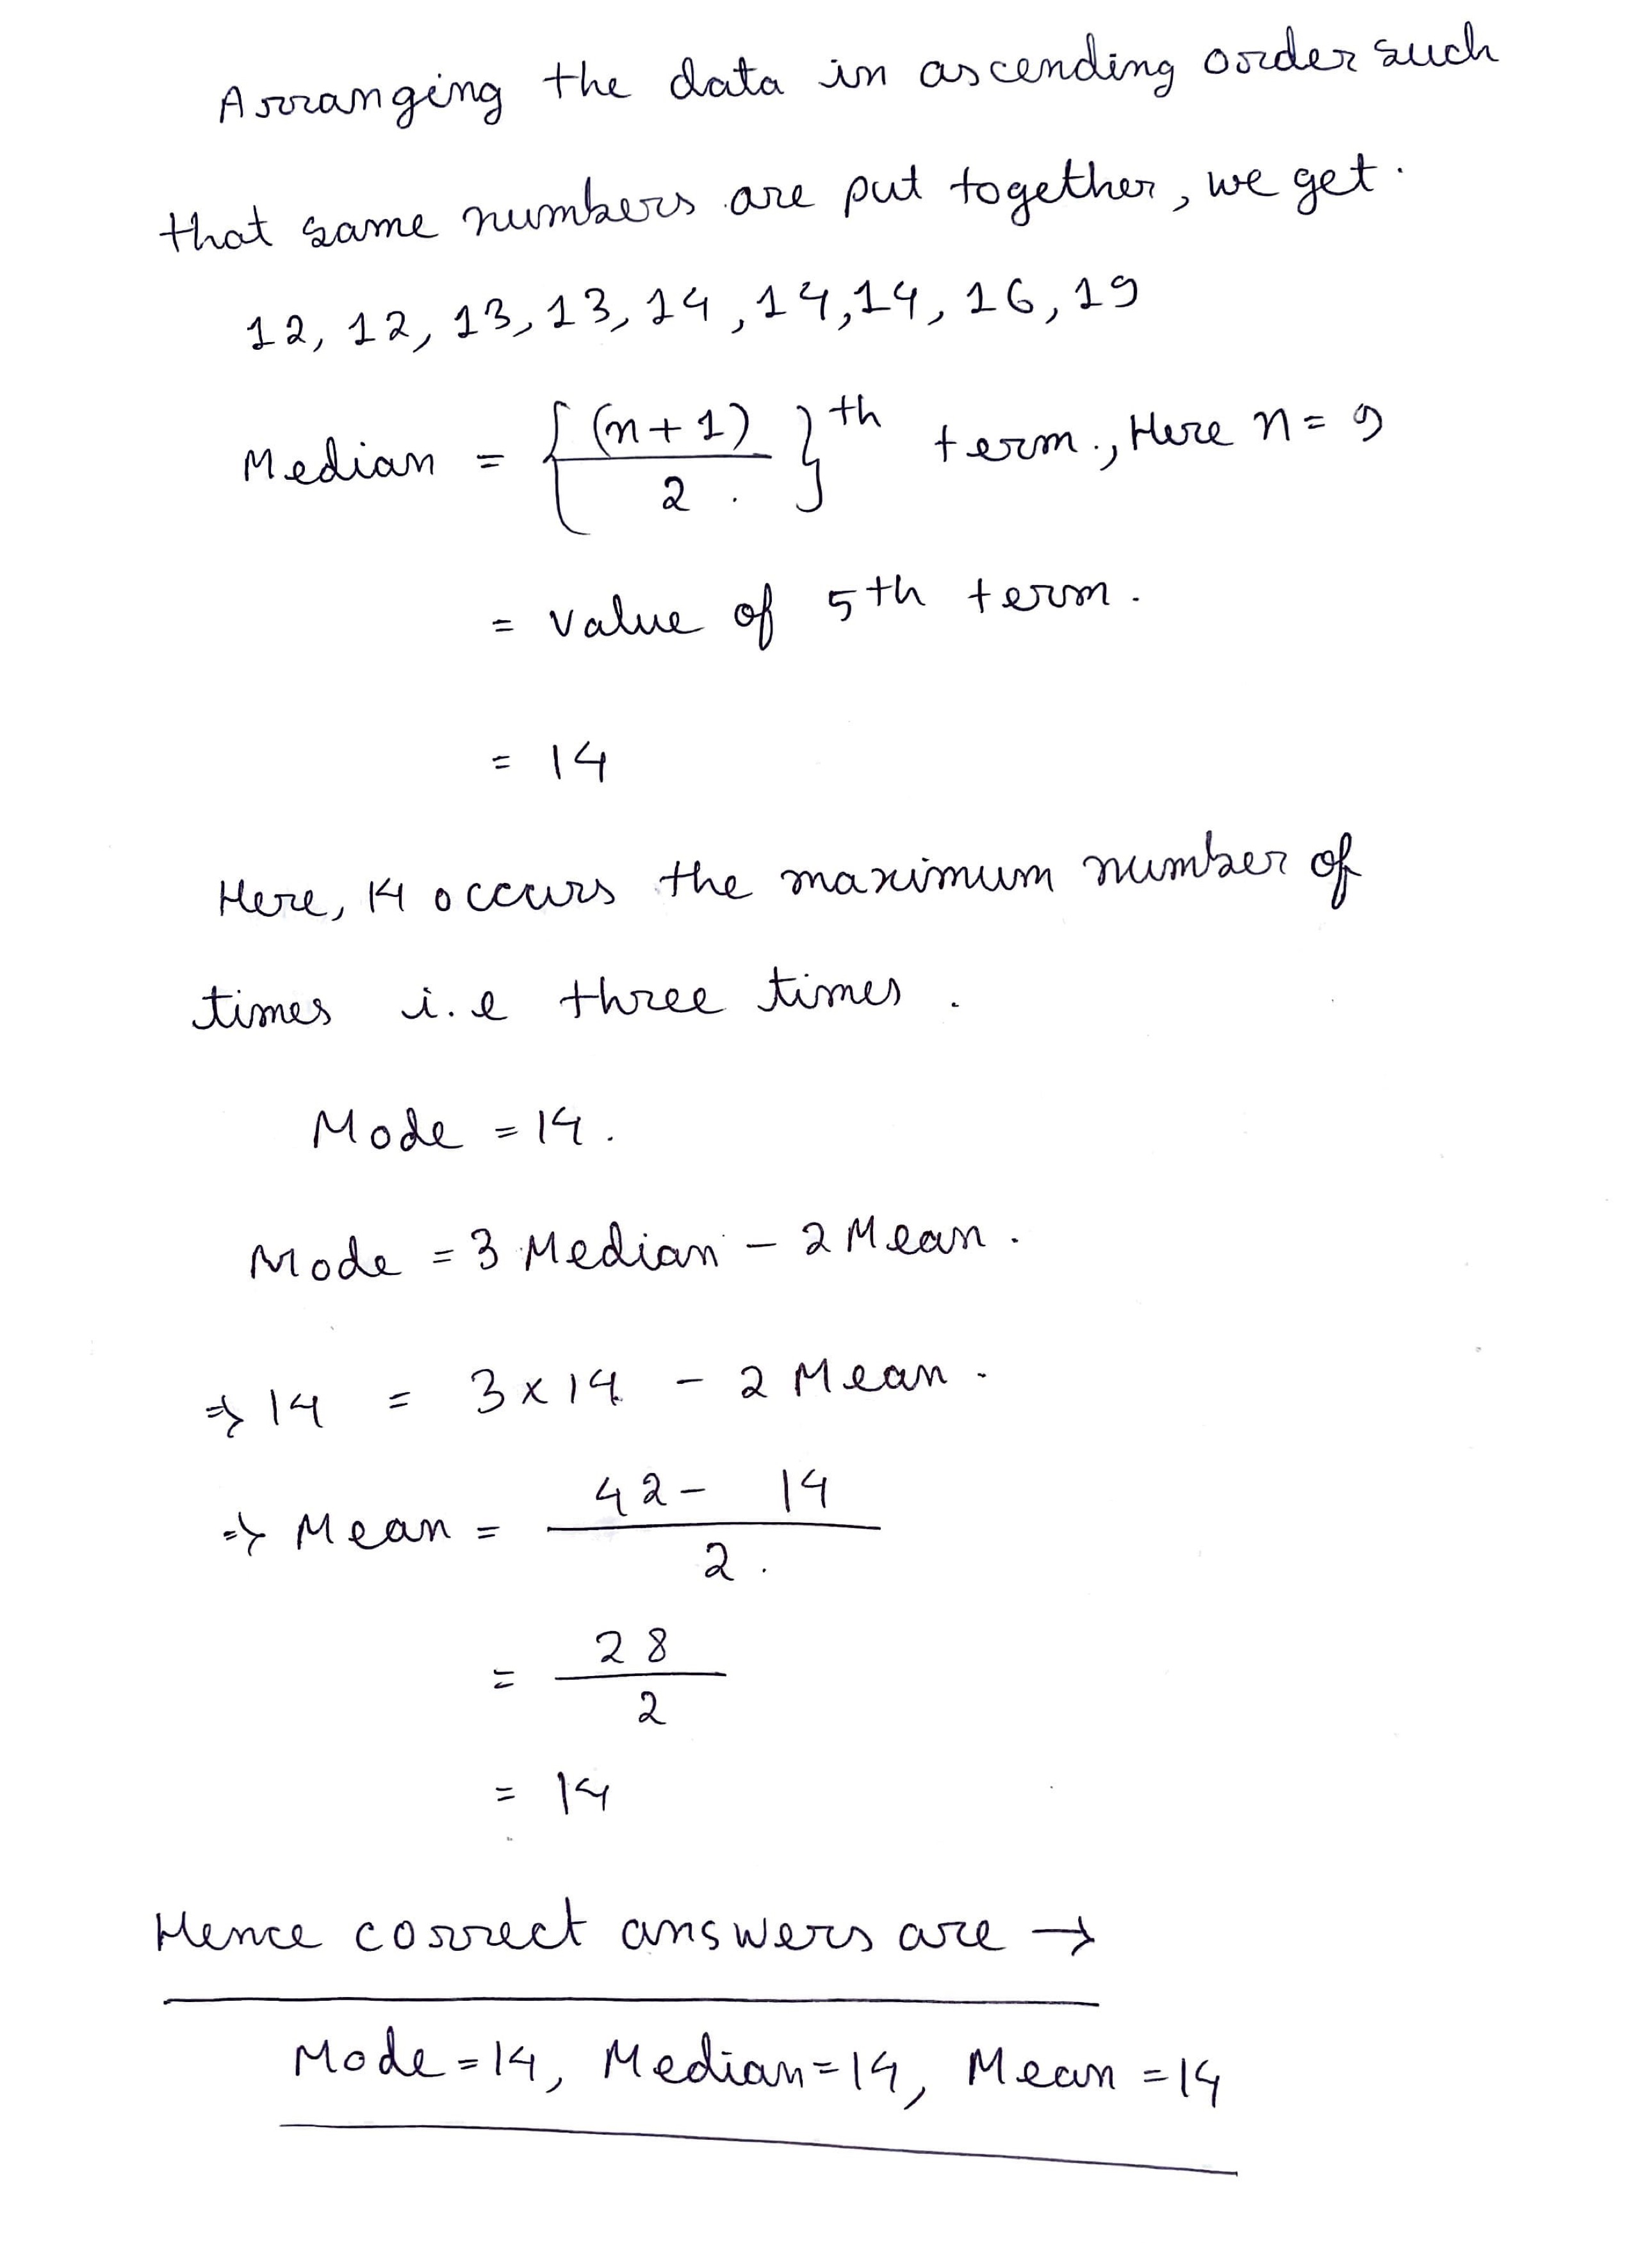
Find the mode and median of the data: $$13,16,12,14,19,12,14,13,14$$
By using the empirical relation also find the mean.
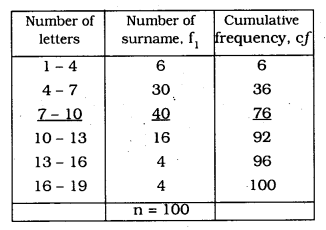
100 surnames were randomly picked up from a local telephone directory and the frequency distribution of the number of letters in the English alphabets in the surnames was obtained as follows :
Determine the median number of letters in the surnames. Find the mean number of letters in surnames. Also, find the modal size of the surnames.
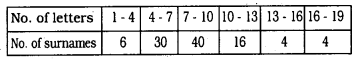
Class interval having median is $$ (7-10) $$
$$\text{l=7, n=100, f=40, cf=36, h=3}$$
$$ \begin{aligned} \therefore \quad \text { Median } &=l+\left[\dfrac{\dfrac{\mathrm{n}}{2}-\mathrm{cf}}{\mathrm{f}}\right] \times \mathrm{h} \\ &=7+\left(\dfrac{50-36}{40}\right) \times 3 \\ &=7+\dfrac{21}{20} \end{aligned} $$:
Median $$ =8.05 $$ Letters
(ii) Class interval which has mode is $$ (7-10) $$
Maximum frequency, $$ l=7, f<\operatorname{sub}>1</ \operatorname{sub}>=40, f<\operatorname{sub}>0</ \operatorname{sub}>=30, f<\operatorname{sub}>2</ \operatorname{sub}>=16, h=3 $$
$$ \therefore \operatorname{Mode}=l+\left[\dfrac{f_{1}-f_{0}}{2 \times f_{1}-f_{0}-f_{2}}\right] \times h $$
$$ =7+\left\{\dfrac{40-30}{80-30-16}\right\} \times 3 $$
$$ =7+\dfrac{30}{34} $$: Mode $$ =7.88 $$
(iii) Mean $$ \bar{X} $$ ) : Step Deviation Method:
$$\begin{array}{|c|c|c|c|c|}\hline No. of & No. of & Midpoint & \mathrm{u}_{1}= \dfrac{\mathrm{x}_{1}-8.5}{3} & \mathrm{f}_{1} \times \mathrm{u}_{1} \\letters & surnames, \mathrm{f}_{1} & X_1 & \\\hline 1-4 & 6 & 2.5 & -2 & -12 \\ 4-7 & 30 & 5.5 & -1 & -3.0 \\ 7-10 & 40 & 8.5=\mathrm{a} & 0 & 00 \\ 10-13 & 16 & 11.5 & 1 & 16 \\ 13-16 & 4 & 14.5 & 2 & 8 \\ 16-19 & 4 & 17.5 & 3 & 12 \\\hline & \mathrm{n}=100 & & & \sum f_1u_1=-6 \\\hline\end{array}$$
Here, $$ a=8.5 . \quad h=3, \quad n=100, \quad \Sigma f_1u_{1}=-6 $$
from Step Deviation Method,
$$ \begin{aligned} \bar{X} &=a+h \times \dfrac{1}{n} \times \sum f_{1} u_{1} \\ &=8.5+3 \times \dfrac{1}{100} \times(-6) \\ &=8.5-\dfrac{18}{100} \\=& 8.5-0.18 \\=& 8.32 \\ \therefore M e a n &=8.32 \end{aligned} $$
$$ \therefore $$ (i) Median $$ =8.05 $$ letters
(ii) Mode $$ =7.88 $$
(iii) Mean $$ =8.32 . $$
Which is the median class and why?
Which is the model class? Why?
Class 10 Maths Extra Questions
- Areas Related To Cricles Extra Questions
- Arithmetic Progressions Extra Questions
- Circles Extra Questions
- Constructions Extra Questions
- Coordinate Geometry Extra Questions
- Introduction To Trigonometry Extra Questions
- Pair Of Linear Equations In Two Variables Extra Questions
- Polynomials Extra Questions
- Probability Extra Questions
- Quadratic Equations Extra Questions
- Real Numbers Extra Questions
- Some Applications Of Trigonometry Extra Questions
- Statistics Extra Questions
- Surface Areas And Volumes Extra Questions
- Triangles Extra Questions