Statistics - Class 9 Maths - Extra Questions
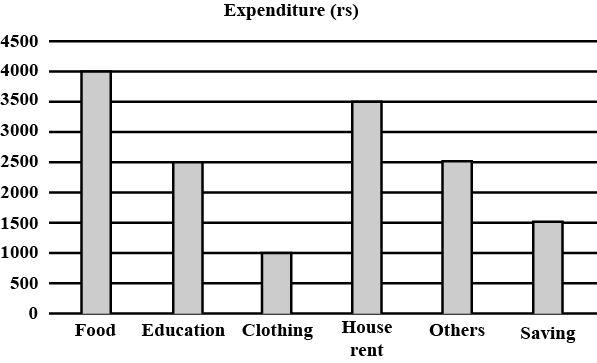
The expenditure of a family on different heads in a month is given below:
| Head | Food | Education | Clothing | House rent | Others | Saving |
| Expenditure (rs) | $$4000$$ | $$2500$$ | $$1000$$ | $$3500$$ | $$2500$$ | $$1500$$ |
Draw a bar graph to represent the data above.
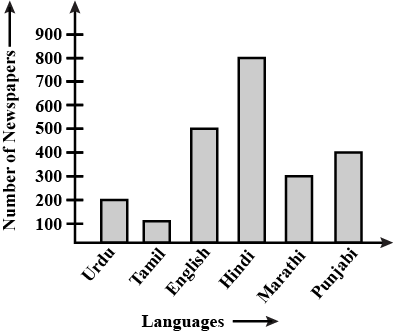
The bar graph given below represents the circulation of newspapers (dailies) in a town in six languages (the figures are approximated to hundreds).
Study the bar graph and answer the following questions:
(a) Find the total number of newspapers read in Hindi, Punjabi, Urdu, Marathi and Tamil.
(b) Find the excess number of newspapers read in Hindi than those in English.
(c) Name the language in which the least number of newspapers are read.
(d) Write the total circulation of newspapers in the town.
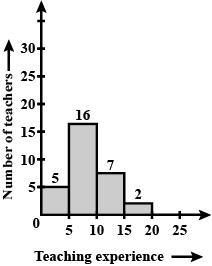
the following histograms shows the frequency distribution of teaching experiences of $$ 30 $$ teachers in various schools.
(a) What is the class width ?
(b) How many teachers are having the maximum teaching experience and how many have the least teaching experience /
(c) How many teachers have teaching experience of $$ 10 $$ to $$ 20 $$ years?
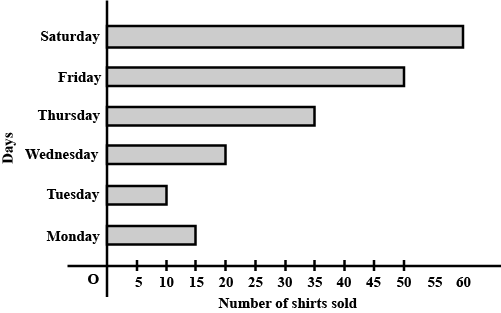
Observe the bar graph given above which is showing the sale of shirts in a readymade garment shop from Monday to Saturday.
Answer the following question:
What information does the above bar graph give ?

Form the frequency distribution table from the following data:
| Marks (out of 90) | Number of candidates |
| More than or equal to 80 | 4 |
| More than or equal to 70 | 6 |
| More than or equal to 60 | 11 |
| More than or equal to 50 | 17 |
| More than or equal to 40 | 23 |
| More than or equal to 30 | 27 |
| More than or equal to 20 | 30 |
| More than or equal to 10 | 32 |
| More than or equal to 0 | 34 |
Observe the bar graph given above which is showing the sale of shirts in a readymade garment shop from Monday to Saturday.
Answer the following question:
On which day were the maximum number of shirts sold ? How many shirts were sold on that day ?

Observe the bar graph given above which is showing the sale of shirts in a readymade garment shop from Monday to Saturday.
Answer the following question:
What is the scale chosen on the horizontal line representing number of shirts ?

Given below is a cumulative frequency distribution showing the marks secured by 50 students of a class:
| Marks | Below 20 | Below 40 | Below 60 | Below 80 | Below 100 |
| Number of students | 17 | 22 | 29 | 37 | 50 |
Observe the bar graph given above which is showing the sale of shirts in a readymade garment shop from Monday to Saturday.
Answer the following question:
How many shirts were sold on Thursday?

Fill in the blanks:
The number of times a particular observation occurs in a data is called ....... of the observation.
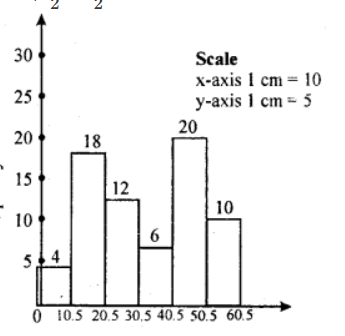
The following table shows the cumulative frequency distribution of marks of 800 students in an examination:
| Marks | Number of students |
| Below 10 | 10 |
| Below 20 | 50 |
| Below 30 | 130 |
| Below 40 | 270 |
| Below 50 | 440 |
| Below 60 | 570 |
| Below 70 | 670 |
| Below 80 | 740 |
| Below 90 | 780 |
| Below 100 | 800 |
Observe the bar graph given above which is showing the sale of shirts in a readymade garment shop from Monday to Saturday.
Answer the following question:
On which day were the minimum number of shirts sold?
Observe the above bar graph, showing the marks scored by Gurmeet in the annual examination in different subjects: Answer the following question:
Name the subject(s) in which she got $$80$$ or more marks.


Given below a graph:
Read the bar graph carefully and answer the following question:
What is the information given by the bar graph?

Fill in the blanks:
In a bar graph, the bars are of uniform...........
Observe the above bar graph, showing the marks scored by Gurmeet in the annual examination in different subjects: Answer the following question:
What is the scale of this bar graph ?
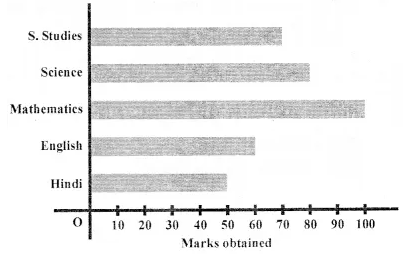

Observe the above bar graph, showing the marks scored by Gurmeet in the annual examination in different subjects: Answer the following question:
In which subject she obtained minimum marks ?


Observe the above bar graph, showing the marks scored by Gurmeet in the annual examination in different subjects: Answer the following question:
In which subject Gurmeet obtained maximum marks ?


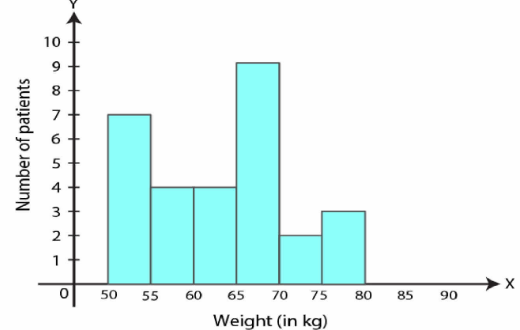
The weight of $$29$$ patients in a hospital were recorded as follows:
| Weight (in $$kg$$) | $$50-55$$ | $$55-60$$ | $$60-65$$ | $$65-70$$ | $$70-75$$ | $$75-80$$ |
| Number of patients | $$7$$ | $$4$$ | $$4$$ | $$9$$ | $$2$$ | $$3$$ |
| Weight (in$$kg$$) | $$50-55$$ | $$55-60$$ | $$60-65$$ | $$65-70$$ | $$70-75$$ | $$75-80$$ |
| Number of patients | $$7$$ | $$4$$ | $$4$$ | $$9$$ | $$2$$ | $$3$$ |
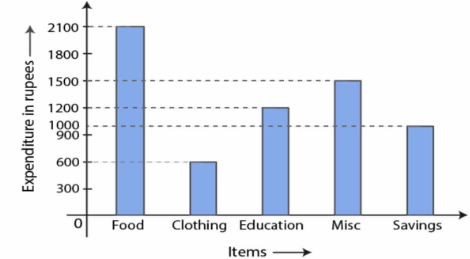
Given below a graph:
Read the bar graph carefully and answer the following question:
On which item the expenditure is minimum?

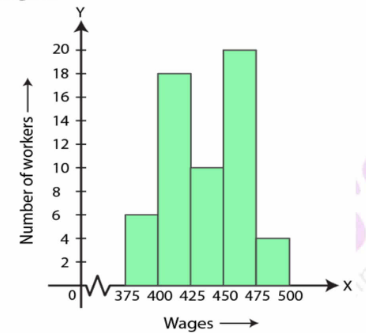
The histogram showing the weekly wages (in Rs) of workers in a factory is given alongside:
Answer the following question:
Numbers of workers whose weakly wages are more than or equal to $$Rs. 400$$ but less than $$Rs. 450$$
The histogram showing the weekly wages (in Rs) of workers in a factory is given alongside:
Answer the following question:
How many workers get more than $$Rs. 425$$?

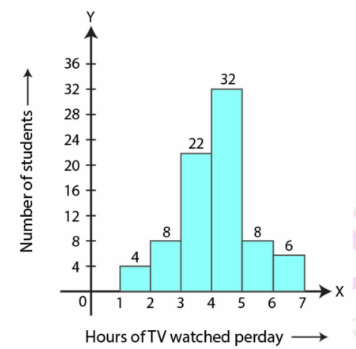
The number of hours for which students of a particular class watched television during holidays is shown in the histogram below.
Answer the following:
For how many hours did the maximum number of students watch $$T.V$$?
Given below a graph:
Read the bar graph carefully and answer the following question:
State whether true or false:
Expenditure on education is twice the expenditure on clothing.
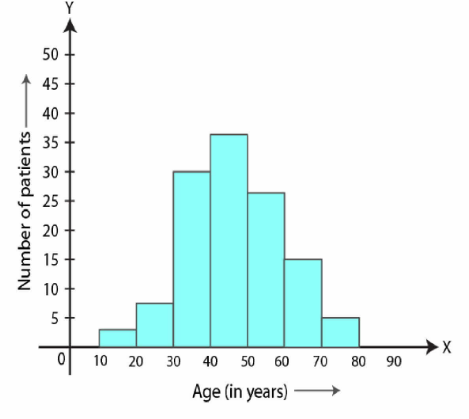
In a study diabetic patients, the following data was obtained:
| Age (in years) | $$10-20$$ | $$20-30$$ | $$30-40$$ | $$40-50$$ | $$50-60$$ | $$60-70$$ | $$70-80$$ |
| Number of patients | $$3$$ | $$8$$ | $$30$$ | $$36$$ | $$27$$ | $$15$$ | $$6$$ |
| Age (in years) | $$10-20$$ | $$20-30$$ | $$30-40$$ | $$40-50$$ | $$50-60$$ | $$60-70$$ | $$70-80$$ |
| Number of patients | $$3$$ | $$8$$ | $$30$$ | $$36$$ | $$27$$ | $$15$$ | $$6$$ |
The histogram showing the weekly wages (in Rs) of workers in a factory is given alongside:
Answer the following question:
What is the class having a minimum frequency?

Given below a graph:
Read the bar graph carefully and answer the following question:
On which item the expenditure is maximum?

The histogram showing the weekly wages (in Rs) of workers in a factory is given alongside:
Answer the following question:
How many workers get less than $$Rs. 475$$?

The following observations have been arranged in ascending order. If the median the data is $$47.5$$, find the value of $$x$$.
$$17,21,23,29,39,40,x,50,51,54,59,67,91,93$$
In a Science test given to a group of students, the marks scored by them (out of 100) are:
$$41,39,52,48,54,62,46,52,40,96,42,40,98,60,52$$
Find the mean and median of this data.
The number of hours for which students of a particular class watched television during holidays is shown in the histogram below.
Answer the following:
For how many students spent more than $$2$$ hours but less than $$4$$ in watching $$T.V$$?

The number of hours for which students of a particular class watched television during holidays is shown in the histogram below.
Answer the following:
For how many students spent more than $$5$$ hours in watching $$T.V$$?

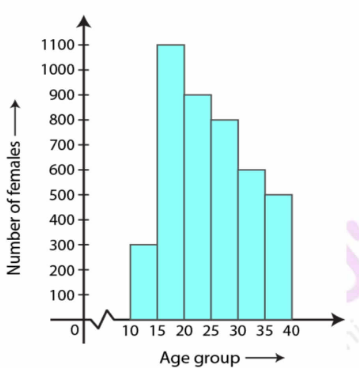
The number of literate females in the group of $$10$$ to $$40$$ years in a town is shown in the histogram alongside.
Answer the following question:
What is the class size?

Rearrange the following raw data in descending order:
$$5.3, 5.2, 5.1, 5.7, 5.6, 6.0, 5.5, 5.9, 5.8, 6.1, 5.5, 5.8, 5.7, 5.9$$ and $$5.4$$. The write the:
range of values
The number of literate females in the group of $$10$$ to $$40$$ years in a town is shown in the histogram alongside.
Answer the following question:
In which age group is the number of literate females the highest?

The number of hours for which students of a particular class watched television during holidays is shown in the histogram below.
Answer the following:
How many students watched $$T.V$$ for less than $$4$$ hourse?

The number of literate females in the group of $$10$$ to $$40$$ years in a town is shown in the histogram alongside.
Answer the following question:
Write the classes assuming all the classes are of equal width.

The number of literate females in the group of $$10$$ to $$40$$ years in a town is shown in the histogram alongside.
Answer the following question:
In which age are the literate females the least?
The mean of $$18,\ 28,\ x,\ 32,\ 14$$ and $$36$$ is $$23$$. Find the value of $$x$$ Sum of data
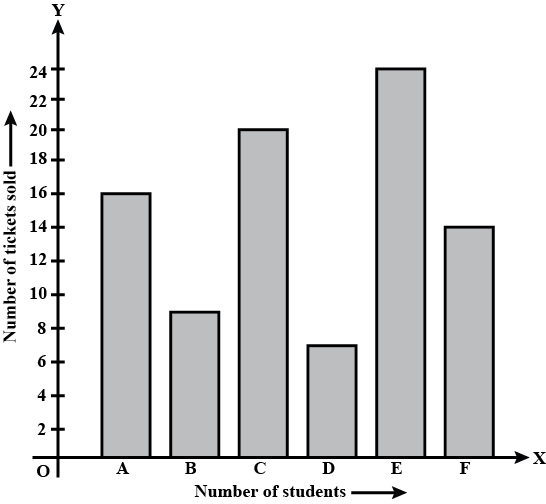
The bar graph drawn below shoes the number of tickets sold during a fair by $$6$$ students $$A, B, C, D, E$$ and $$F$$
Using the Bar graph, answer the following question:
Who sold the maximum number of tickets?
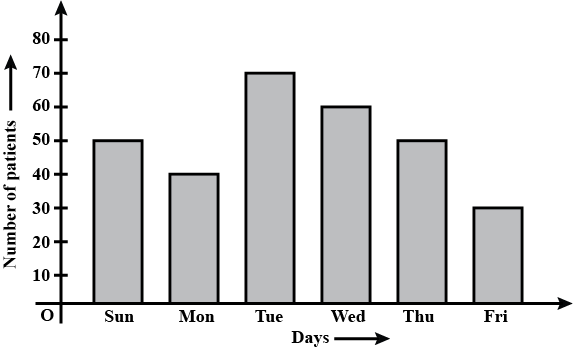
The column graph, given above, shows the number of patients, examined by Dr. V.K. Bansal, on different days of a particular week.
Use the graph to answer the following:
On which day were the maximum number of patients examined?

The column graph, given above, shows the number of patients, examined by Dr. V.K. Bansal, on different days of a particular week.
Use the graph to answer the following:
On which day were the least number of patients examined?
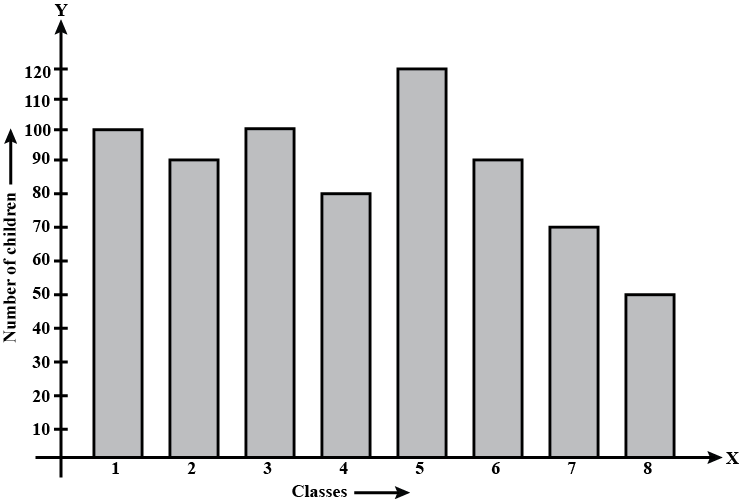
The above bar graph shows the number of children, in various classes, in a school in Delhi.
Using the given bar graph, find:
How many more children are there in Class 5 compared to Class 6?

The bar graph drawn below shoes the number of tickets sold during a fair by $$6$$ students $$A, B, C, D, E$$ and $$F$$
Using the Bar graph, answer the following question:
How many tickets were sold by $$D, E$$ and $$F$$ taken together?

The bar graph drawn below shoes the number of tickets sold during a fair by $$6$$ students $$A, B, C, D, E$$ and $$F$$
Using the Bar graph, answer the following question:
How many tickets were sold by $$A, B$$ and $$C$$ taken together?

The following bar graph shows the number of children, in various classes, in a school in Delhi.
Using the given bar graph, find:
the average number of children in a class
The column graph, given above, shows the number of patients, examined by Dr. V.K. Bansal, on different days of a particular week.
Use the graph to answer the following:
On which days were equal number of patients examined?

The bar graph drawn below shoes the number of tickets sold during a fair by $$6$$ students $$A, B, C, D, E$$ and $$F$$
Using the Bar graph, answer the following question:
Who sold the least number of tickets?

The mean of the number $$6, y, 7, x$$ and $$14$$ is $$8.$$ Express $$y$$ in terms of $$x$$.
If the mean of $$6, 4, 7,$$ $$a$$ and $$10$$ is $$8$$. Find the value of $$a$$
Find the actual lower and upper class limits and also the class marks of the classes:
$$1.1-2.0,2.1-3.0$$ and $$3.1-4.0$$
Following data shows the weekly wages (in ) of $$10$$ workers in a factory.$$3500, 4250, 4000, 4250, 4000, 3750, 4750, 4000, 4250$$ and $$4000$$.What is the range of wages (in )?
Fill in the blanks:
The range of the data 7,13,6,25,18,20,16 is .......
Arrange the following data in descending order: $$3.3, 3.2, 3.1, 3.7, 3.6, 4.0, 3.5, 3.9, 3.8, 4.1, 3.5, 3.8, 3.7, 3.9$$ and $$3.4$$.
Determine the range.
Uses the table given to find:
The actual class limits of the fourth class
Consider the following numbers:
$$68, 76, 63, 75, 93, 83, 70, 115, 82, 105, 90, 103, 92, 52, 99, 73, 75, 63, 77$$ and $$71$$.
What is the range of these numbers?
The column graph, given above, shows the number of patients, examined by Dr. V.K. Bansal, on different days of a particular week.
Use the graph to answer the following:
What is the total number of patients examined in the week?

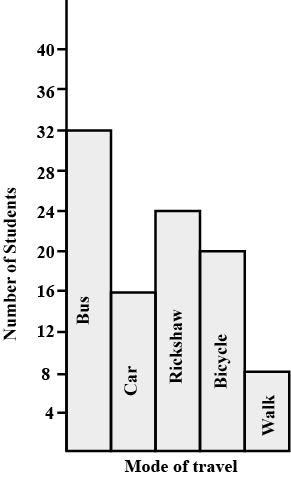
Hundred students from a certain locality use different modes of travelling to school as given below. Draw a bar graph.
| Bus | Car | Rickshaw | Bicycle | Walk |
| $$32$$ | $$16$$ | $$24$$ | $$20$$ | $$8$$ |
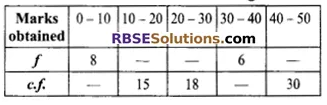
Fill in the blanks in the following table:
| Class interval | Frequency | Cumulative frequency |
| $$25-34$$ | ____ | $$15$$ |
| $$35-44$$ | ___ | $$28$$ |
| $$45-54$$ | $$21$$ | ____ |
| $$55-64$$ | $$16$$ | ____ |
| $$65-74$$ | ____ | $$73$$ |
| $$75-84$$ | $$12$$ | ____ |
Uses the table given to find:
The class boundary of the sixth class
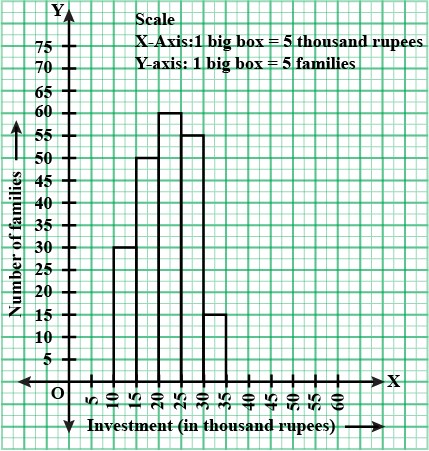
In the following table, the investment made by $$210$$ families is shown. Present it in the form of a histogram.
| Investment (Thousand Rupees) | $$10 - 15$$ | $$15 - 20$$ | $$20 - 25$$ | $$25 - 30$$ | $$30 - 35$$ |
| No. of families | $$30$$ | $$50$$ | $$60$$ | $$55$$ | $$15$$ |
Uses the table given to find:
The class mark of the third class
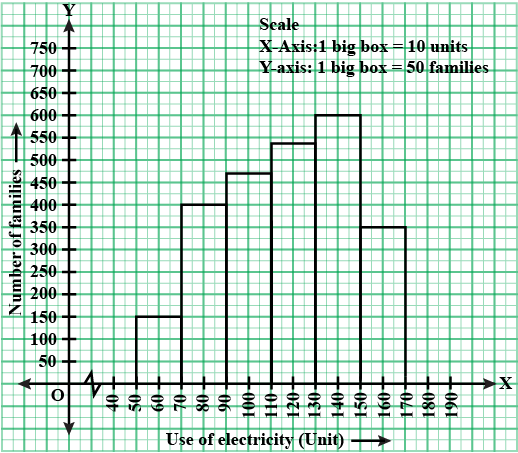
Draw a histogram for the following frequency distribution.
| Use of electric (unit) | $$50-70$$ | $$70-90$$ | $$90-110$$ | $$110-130$$ | $$130-150$$ | $$150-170$$ |
| No. of families | $$150$$ | $$400$$ | $$460$$ | $$540$$ | $$600$$ | $$350$$ |
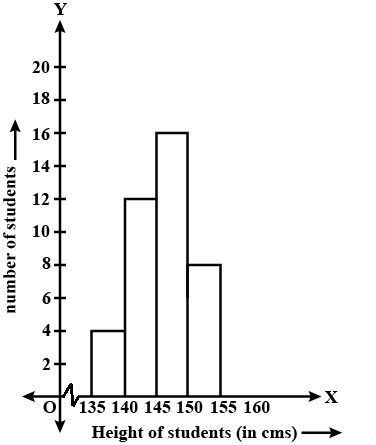
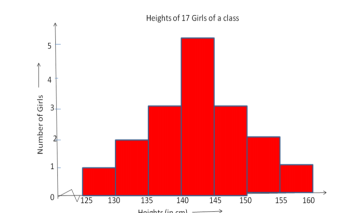
Draw a histogram of the following data.
| Height of student ($$\text{cm}$$) | $$135 - 140$$ | $$140 - 145$$ | $$145 - 150$$ | $$150 - 155$$ |
| No. of students | $$4$$ | $$12$$ | $$16$$ | $$8$$ |
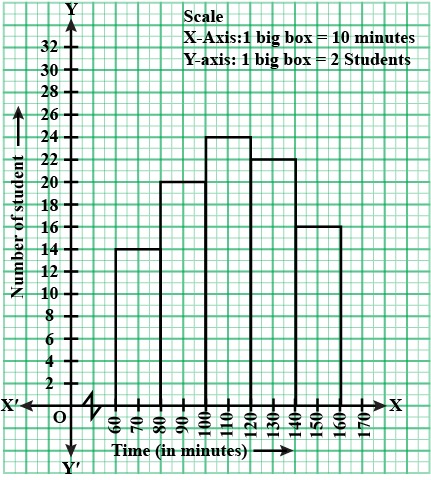
Time allotted for the preparation of an examination by some students is shown in the table. Draw a histogram to show the information.
| TIme (minutes) | $$60 - 80$$ | $$80 - 100$$ | $$100 - 120$$ | $$120 - 140$$ | $$140 - 160$$ |
| No.of students | $$14$$ | $$20$$ | $$24$$ | $$22$$ | $$16$$ |
Classify the following information as primary or secondary data. Information of attendance of every student collected by visiting every class in a school.
Classify the following information as primary or secondary data. In the village Nandpur, the information collected from every house regarding students not attending school.
Classify the following information as primary or secondary data. The information of the heights of students was gathered from school records and sent to the head office, as it was to be sent urgently.
Classify the following information as primary or secondary data: For a science project, information of trees gathered by visiting a forest.
The mean of the following frequency table isBut the frequencies $$ f_{1} $$ and $$ f_{2} $$ in class 20 - 40 and 60 - 80 respectively are missing. Find the missing frequencies.
| Classes | 0 - 20 | 20 - 40 | 40 - 60 | 60 - 80 | 80 - 100 | Total |
| Frequency | 17 | $$ f_{1} $$ | 32 | $$ f_{2} $$ | 19 | $$ N = \sum f_{i} = 120 $$ |
In a city, $$38$$ people donated to an organisation working for differently abled persons. The amount in rupees were as follows :$$101, 500, 401, 201, 301, 160, 210, 125, 175, 190, 450, 151, 101, 351, 251, 451, 151, 260, 360, 410, $$$$150, 125, 161, 195, 351, 170, 225, 260, 290, 310, 360, 425, 420, 100, 105, 170, 250, 100$$.
(i) By taking classes $$100-149, 150-199, 200-249...$$ prepare a grouped frequency distribution table.
(ii) From the table, find the number of people who donated rupees $$350$$ or more.

If the mean of the following data is $$20.2$$, then find the value of p.
| $$x_i$$ | 10 | 15 | 20 | 25 | 30 |
| $$f_i$$ | 6 | 8 | p | 10 | 6 |
If the median of the distribution given is 28.5, find the values of 'x' and 'y'
| Class Interval | Frequency |
| 0 - 10 | 5 |
| 10 - 20 | x |
| 20 - 30 | 20 |
| 30 - 40 | 15 |
| 40 - 50 | y |
| 50 - 60 | 5 |
| Total | 60 |
Find the class mark of the class interval 30 - 40.
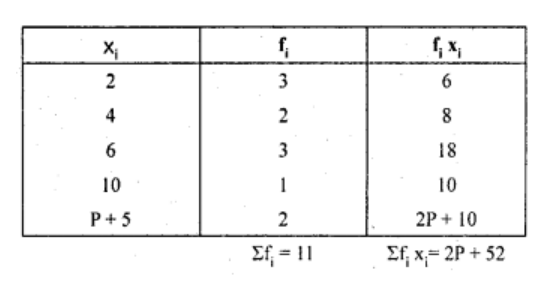
If the mean of the following distribution is 6, find the value of P.
| $$ x_{i} $$ | 2 | 4 | 6 | 10 | P + 5 |
| $$ f_{i} $$ | 3 | 2 | 3 | 1 | 2 |
$$ \mathbf{Mean} = \bar{x} = \dfrac{\sum f_{i}x_{i}}{\sum f_{i}} $$
$$ 6 = \dfrac{2P + 52}{11} $$
$$ 66 = 2P + 52 $$
$$ 2P = 66 - 52 $$
$$2P = 14 $$
$$ P = \dfrac{14}{2} = 7 $$
$$ P = 7 $$
If the classmark is $$10$$ and class width is $$6$$ then find the class.
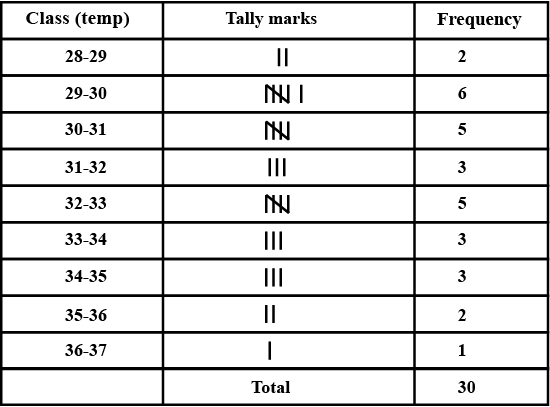
The monthly maximum temperature of a city is given in degree celcius in the following data. By taking suitable classes, prepare the grouped frequency distribution table
$$29.2, 29.0, 28.1, 28.5, 32.9, 29.2, 34.2, 36.8, 32.0, 31.0, 30.5, 30.0, 33, 32.5, 35.5, 34.0, 32.9, 31.5, 30.3, $$$$31.4, 30.3, 34.7, 35.0, 32.5, 33.5, 29.0, 29.5, 29.9, 33.2, 30.2$$
From the table, answer the following questions.
(i) For how many days the maximum temperature was less than $$34^\circ C$$?
(ii) For how many days the maximum temperature was $$34^\circ C$$ or more than $$34^\circ C$$?
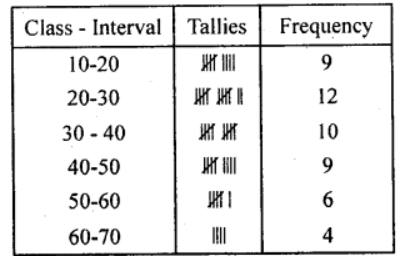
Prepare the frequency distribution table for the given set of scores . 39 , 16 , 30 , 37 53 , 15 , 16 , 60 , 58 , 26 , 28 , 19, 20 , 12 , 14 , 24 , 59 , 21, 57 , , 38 , 25 , 36 , 34 , 15 , 25 , 41 , 52 , 45 , 60 , 63 , 18 , 26 , 43 , 18 , 27 , 59 , 63 , 46 , 48 , 25 , 33 , 46 , 27 , 46 , 42 , 48 , 35 , 64 , 24 Take class intervals as (10 - 20 ), ( 20 , 30 ) ............. and answer the following .
What is the size of each class interval ? Find the midpoint of the class interval 30 - 40
$$ \dfrac{(30 + 40)}{2} = \dfrac{70}{2} = 35 $$
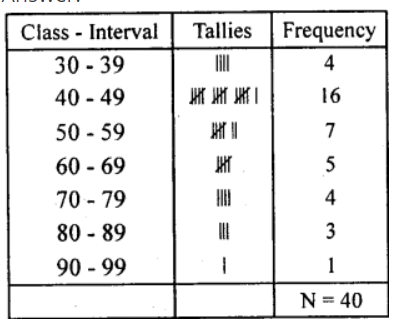
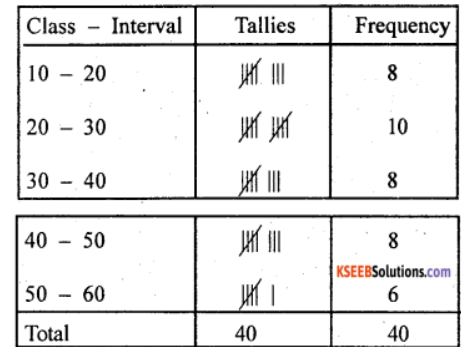
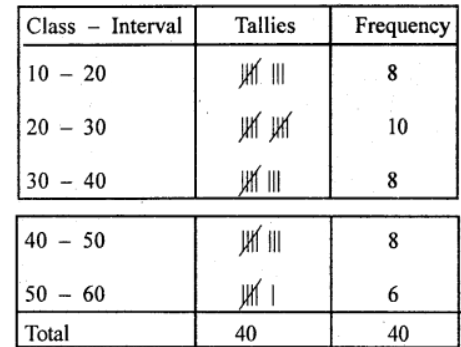
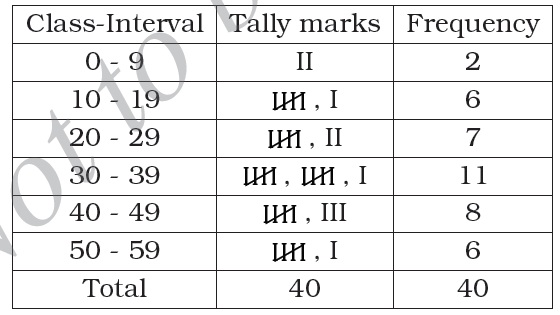
The mark scored by 40 candidates in an examination (out of 100 ) is given below .
75 , 65 , 57 , 50 , 32 , 54 , 67 , 75 ,88 , 80 , 42 , 40 , 41 , 34 , 61 , 42 , 46 , 68 , 52 , 43 , 49 , 59 , 49, 67 , 34 , 33 , 87 , 97 , 47 , 46 , 54 , 48 , 45 , 51 , 47 , 41 , 43 .
Prepare a frequency distribution table with the class size 10 . Take the class intervals as 30 - 39 , 40 - 49 and answer the following questions .
Which class intervals have highest and lowest frequency .

The mark scored by 40 candidates in an examination (out of 100 ) is given below .
75 , 65 , 57 , 50 , 32 , 54 , 67 , 75 ,88 , 80 , 42 , 40 , 41 , 34 , 61 , 42 , 46 , 68 , 52 , 43 , 49 , 59 , 49, 67 , 34 , 33 , 87 , 97 , 47 , 46 , 54 , 48 , 45 , 51 , 47 , 41 , 43 .
Prepare a frequency distribution table with the class size 10 . Take the class intervals as 30 - 39 , 40 - 49 and answer the following questions .
What are the range of the given distribution ?
$$= 97 - 32$$
Range $$= 65$$

The mark scored by 40 candidates in an examination (out of 100 ) is given below .
75 , 65 , 57 , 50 , 32 , 54 , 67 , 75 ,88 , 80 , 42 , 40 , 41 , 34 , 61 , 42 , 46 , 68 , 52 , 43 , 49 , 59 , 49, 67 , 34 , 33 , 87 , 97 , 47 , 46 , 54 , 48 , 45 , 51 , 47 , 41 , 43 .
Prepare a frequency distribution table with the class size 10 . Take the class intervals as 30 - 39 , 40 - 49 and answer the following questions .
Writhe the upper and lower limits of the class interval 30 - 49
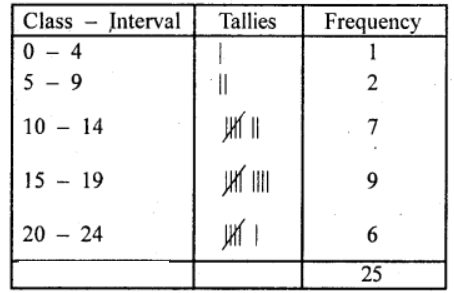
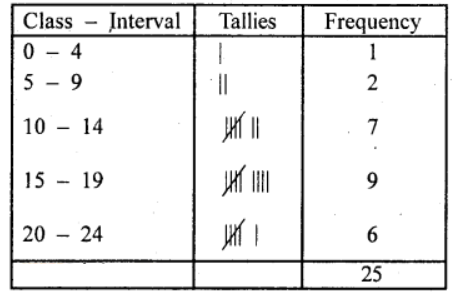
The following are the marks scored in a unit test ( out of 25 ) . Prepare a frequency distribution table , taking class interval as 0 - 4 , 5 - 9 , 10 - 14 , 15 - 19 , 20 - 24.
21 , 14 , 3 , 7 , 23 , 18 , 24 , 16 , 18 , 17 , 18 , 21 , 23 , 19 , 12 , 14 , 11 . From the table
Find the class interval having maximum frequency .
Prepare a frequency distribution table for the scores given.
42 , 22 , 55 , 18 , 50 , 10 , 33 , 29 , 17
29 , 29 , 27 , 34 , 15 , 40 , 42 , 40 , 41
35 , 27 , 44 , 31 , 38 , 19 , 54 , 55 , 38
19 , 20 , 30 , 42 , 59 , 15 ; 27 , 23
40 , 32 , 28 , 51
Take the class intervals as 10 - 10 , 20 - 30 , 30 - 40 , 40 - 50 , 50 - 60 . From the frequency distribution table answer the following questions .
What does the frequency , corresponding to the class intervals 20 - 30 indicates ?
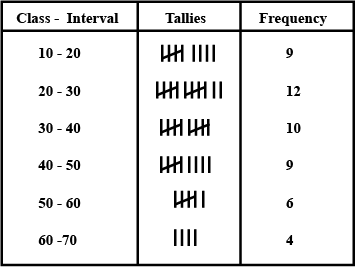
Prepare the frequency distribution table for the given set of scores . 39 , 16 , 30 , 37 53 , 15 , 16 , 60 , 58 , 26 , 28 , 19, 20 , 12 , 14 , 24 , 59 , 21, 57 , , 38 , 25 , 36 , 34 , 15 , 25 , 41 , 52 , 45 , 60 , 63 , 18 , 26 , 43 , 18 , 27 , 59 , 63 , 46 , 48 , 25 , 33 , 46 , 27 , 46 , 42 , 48 , 35 , 64 , 24 Take class intervals as (10 - 20 ), ( 20 , 30 ) ............. and answer the following .
What is the range of the given set of scores ?
Prepare a frequency distribution table for the scores given.
42 , 22 , 55 , 18 , 50 , 10 , 33 , 29 , 17
29 , 29 , 27 , 34 , 15 , 40 , 42 , 40 , 41
35 , 27 , 44 , 31 , 38 , 19 , 54 , 55 , 38
19 , 20 , 30 , 42 , 59 , 15 ; 27 , 23
40 , 32 , 28 , 51
Take the class intervals as 10 - 10 , 20 - 30 , 30 - 40 , 40 - 50 , 50 - 60 . From the frequency distribution table answer the following questions .
Find the range of the scores.
The following are the marks scored in a unit test ( out of 25 ) . Prepare a frequency distribution table , taking class interval as 0 - 4 , 5 - 9 , 10 - 14 , 15 - 19 , 20 - 24.
21 , 14 , 3 , 7 , 23 , 18 , 24 , 16 , 18 , 17 , 18 , 21 , 23 , 19 , 12 , 14 , 11 . From the table
Find the range of the scores.
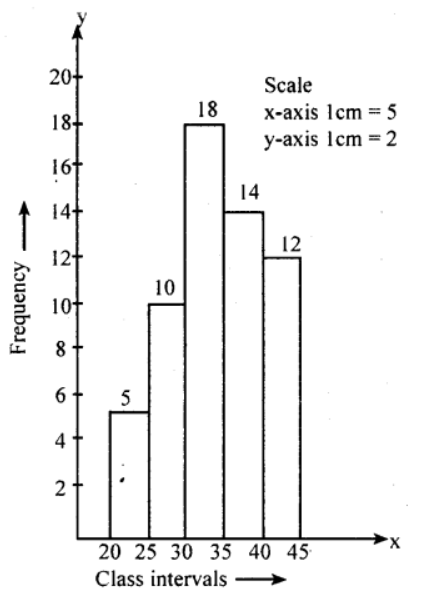
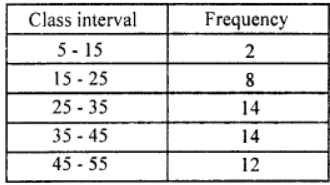
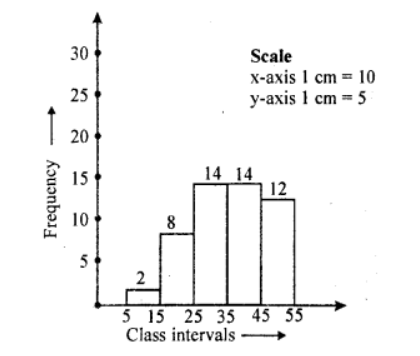
Draw a histogram to represent the following frequency distribution:
| Class interval | Frequency |
| $$20 - 25$$ | $$5$$ |
| $$25 - 30$$ | $$10$$ |
| $$30 - 35$$ | $$18$$ |
| $$35 - 40$$ | $$14$$ |
| $$40 - 45$$ | $$12$$ |
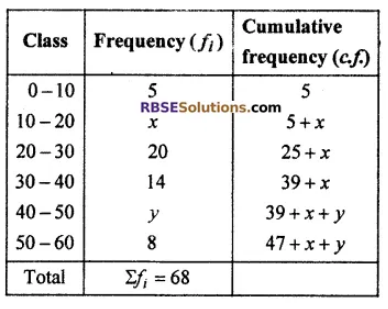
If median of the following distribution is 27, then find the values of x and y.
| Class-interval | Frequency |
| 0-10 | 5 |
| 10-20 | $$ x $$ |
| 20-30 | 20 |
| 30-40 | 14 |
| 40-50 | $$ y $$ |
| 50-60 | 8 |
| Total | 68 |
$$ \Rightarrow 47 + x + y = 68 $$
$$ \Rightarrow x + y = 68 - 47 $$
$$ x + y = 21 $$............(i)
Now $$ \frac{N}{2} = \frac{68}{2} = 34 $$
Median of distribution is 27 which lies in class-interval 20-30.
$$\therefore $$ Median class 20-30.
$$ l = 20, c = 5 + x, f = 20 $$ and $$ h = 10 $$
$$\therefore Median = l + \left (\frac{\frac{N}{2} - C}{f} \right ) $$
$$ \Rightarrow 27 = 20 + \left ( \frac{34 - (5+x)}{20} \right ) \times 10 $$
$$ = 20 + \frac{34 - 5 - x}{2} = \frac{40 + 29 - x}{2} $$
$$ \Rightarrow 69 -x = 2 \times 27 $$
$$ \Rightarrow x = 69 -54 = 15 $$Putting value of x in eqn (i)
$$ 15+y=21 $$
$$ \Rightarrow y = 21 - 15 = 6 $$
Thus, $$ x = 15, y = 6 $$
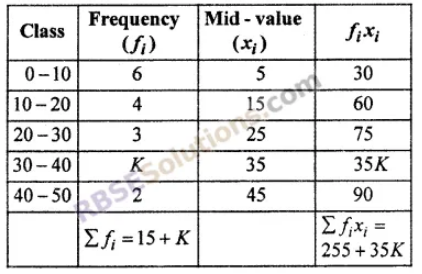
If mean of following data is 21.5, then find K :
| Class | 0-10 | 10-20 | 20-30 | 30-40 | 40-50 |
| Frequency | 6 | 4 | 3 | K | 2 |
$$ 21.5 = \frac{255 + 35K}{15 + K} $$
$$ \Rightarrow 322.5 - 255 = 35K - 21.5k $$
$$ \Rightarrow 13.5k = 67.5 $$
$$K= \frac{67.5}{13.5} = 5 $$
$$ \therefore K = 5 $$
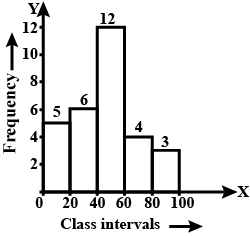
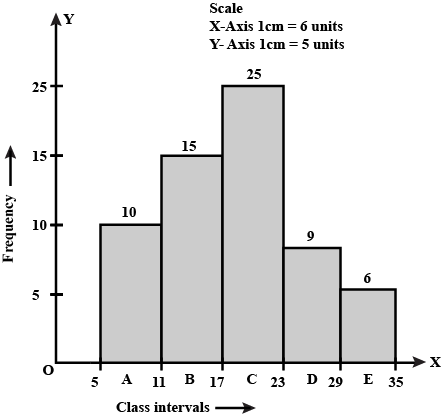
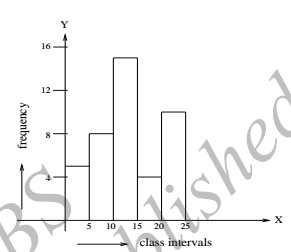
Draw a histogram for the following frequency distribution .
| Class Interval | $$0-20 $$ | $$20-40 $$ | $$40-60 $$ | $$60-80$$ | $$80 -100$$ |
| Frequency | $$5$$ | $$6 $$ | $$12 $$ | $$4 $$ | $$3$$ |
So, rectangles $$A, B,C, D$$ and $$E$$ are constructed.
Draw a histogram for the following frequency distribution
d = lower limit of class - upper limit of a class before it $$= 11 - 10$$
$$ d = 1 , \dfrac{d}{2} = \dfrac{1}{2} = 0 . 5 $$
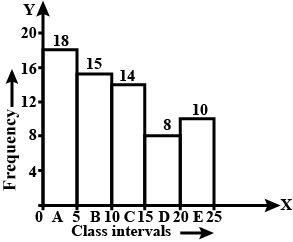
Construct histogram for the following frequency table :
Class Interval $$0-5$$ $$5-10$$ $$10-15 $$ $$15-20$$ $$20-25$$ Frequency $$ 18$$ $$15 $$ $$14 $$ $$8 $$ $$10$$
| Class Interval | $$0-5$$ | $$5-10$$ | $$10-15 $$ | $$15-20$$ | $$20-25$$ |
| Frequency | $$ 18$$ | $$15 $$ | $$14 $$ | $$8 $$ | $$10$$ |
We now draw graph for the given frequency table, so rectangles $$A, B, C, D$$ and $$E$$ are constructed.
The value of $$\pi $$ upto $$50$$ decimal places is given below.
$$3.14159265358979323846264338327950288419716939937510$$
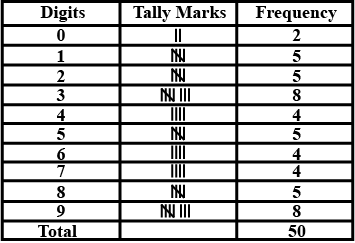
(ii) What are the most and the least frequency occurring digits?
Find the range ad coefficient of range of the following table -
| x | 4.5 | 5.5 | 6.5 | 7.5 | 8.5 | 9.5 | 10.5 | 11.5 |
| f | 4 | 5 | 6 | 3 | 2 | 1 | 3 | 5 |
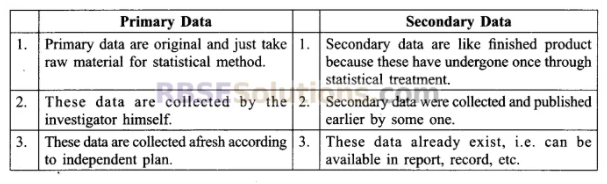
What are primary and secondary data Differentiate them?
Data which are not originally collected rather obtained from published or unpublished source are known as secondary data.
Variate (x) 5 10 15 20 25 30 Frequency (f) 2 6 4 1 5 2
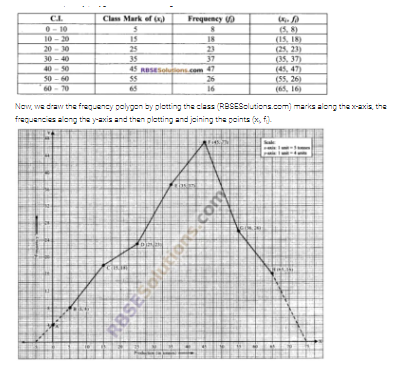
Construct a frequency polygon for the following frequency distribution.
| Variate (x) | 5 | 10 | 15 | 20 | 25 | 30 |
| Frequency (f) | 2 | 6 | 4 | 1 | 5 | 2 |
Now, the point $$(5, 2), (10, 6), (15, 4), (20, 1), (25, 5)$$, and $$(30, 2)$$ are plotted and joined. Since, the value of the variate $$0$$ comes before the first variate, so we join the first point $$(5, 2)$$ to the origin $$(0, 0)$$. Similarly, $$35$$ comes ahead than the last variate, so we join the last point $$(30, 2)$$ to the point $$(35, 0)$$.
Thus, the required frequency polygon is obtained
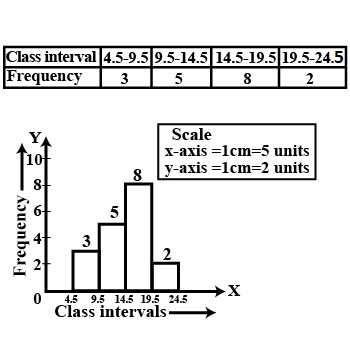
Construct a frequency polygon for the following frequency distribution.
| Class interval | $$5 - 9$$ | $$10 - 14$$ | $$15 - 19$$ | $$20 - 24$$ |
| Frequency | $$ 3$$ | $$5$$ | $$4$$ | $$2$$ |
Lower limit of $$2^{\text{nd}} $$ class interval $$= 10$$;
Upper limit of $$1^{\text{st}}$$ class interval $$= 9$$
Difference $$(h) = 10 - 9 = 1$$
$$\implies \dfrac{h}{2} = \dfrac{1}{2} = 0.5$$
We subtract $$0.5$$ from the lower limits and add $$0.5$$ in the upper limits to make the class intervals regular.
Here, we take $$OX$$ and $$OY$$ as the x-axis and y-axis respectively on a graph paper with $$O$$ as the origin.
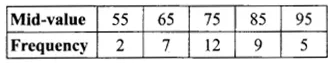
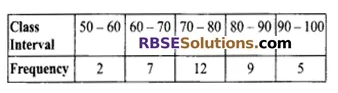
| Mid values | 8 | 14 | 20 | 26 | 32 |
| Frequency | 10 | 15 | 25 | 9 | 6 |
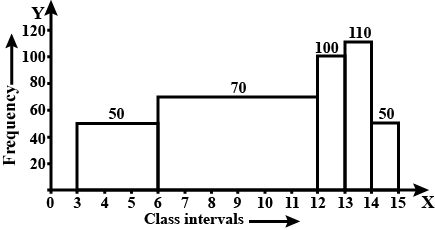
| Class Interval | $$3-6$$ | $$ 6-12$$ | $$ 12-13$$ | $$ 13-14$$ | $$14-15 $$ |
| Frequency | $$ 150$$ | $$420 $$ | $$100 $$ | $$110 $$ | $$50$$ |
$$Height = \frac{Frequency}{Width of the corresponding interval}$$
(i) $$\frac{150}{3} = 50$$
(ii) $$\frac{420}{6} =70$$
(iii) $$\frac{100}{1} = 100$$
(iv) $$\frac{110}{1} = 110$$
(v) $$\frac{50}{1} = 50$$
What is an individual series ?
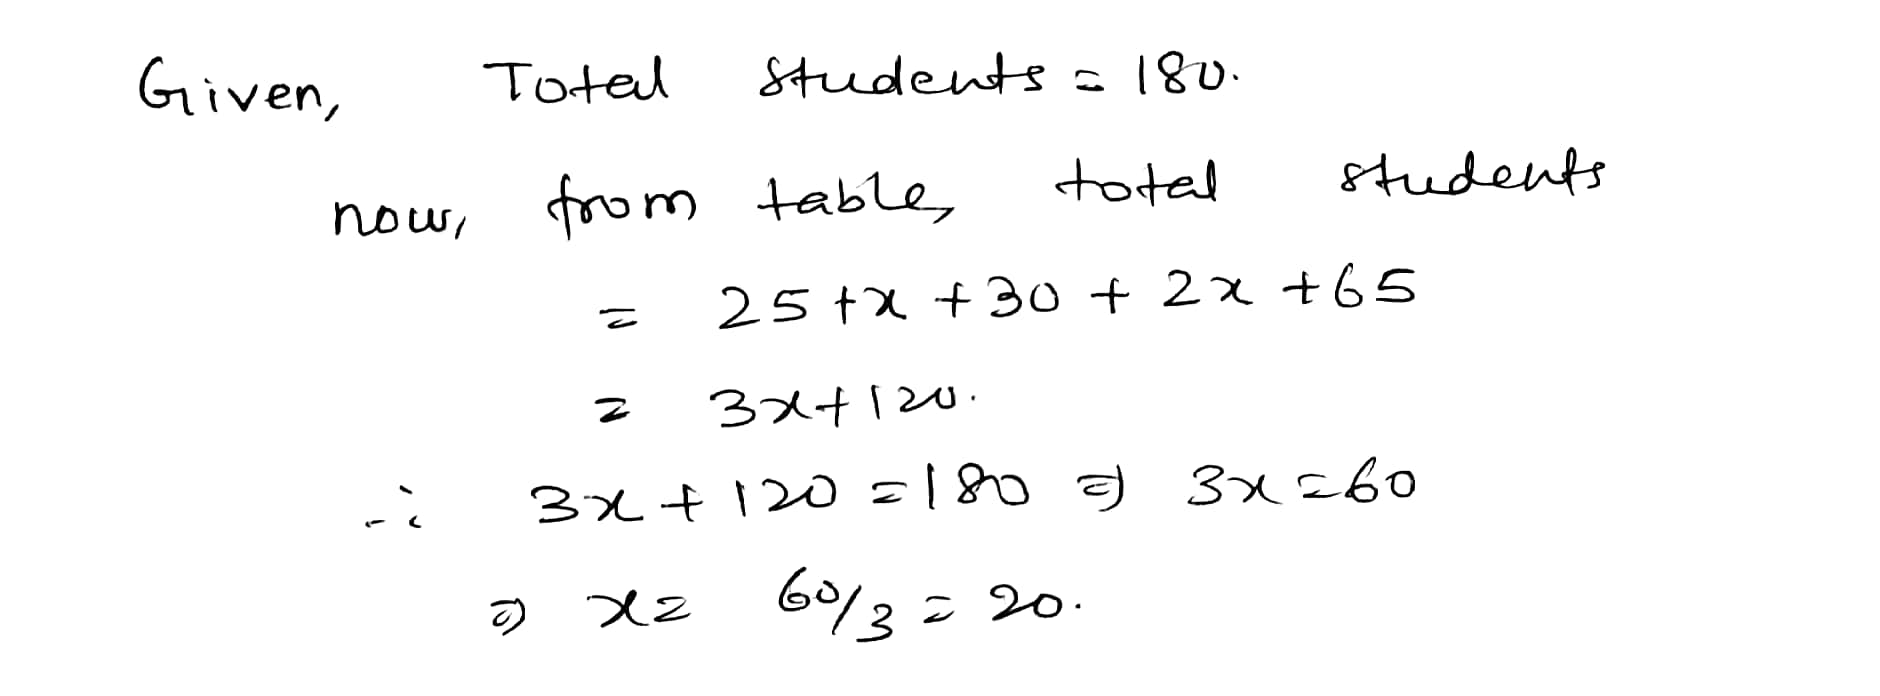
The following frequency distribution table shows marks obtained by 180 students in Mathematics examination :
| Marks | Number of Students |
| 0 - 10 10 - 20 20 - 30 30 - 40 40 - 50 | 25 $$x$$ 30 2$$x$$ 65 |
Also draw a histogram representing the above information.
How many types of series are there on the basis of quantitative/numerical classification?
Make class intervals from the following mid-values :
Fill in the blanks in the following table :
What is exclusive series ?
What is inclusive series ?
The mean of five numbers is $$27$$. If one number is excluded, then the new mean is $$25$$. Find the excluded number.
Change the following frequency distribution in exclusive method.
Find the missing frequencies in the following frequency distribution, if the mean of the distribution is $$1.46$$.
$$ {\textbf{Step 1: Make the Equation}} $$
$${\text{Given that }}\sum {{f_i}} = 200 $$
$$ \therefore {\text{ }}200 = 86 + {f_1} + {f_2} $$
$$ \Rightarrow {f_1} + {f_2} = 200 - 86 $$
$$ \Rightarrow {f_1} + {f_2} = 114{\text{ - - - - - - (1)}} $$
$$ {\text{Also, mean }}\left( {\mathop x\limits^ - } \right){\text{ is given as 1}}{\text{.46}} $$
$$ {\text{So, }}\therefore {\text{1}}{\text{.46 = }}\dfrac{{140 + {f_1} + 2{f_2}}}{{86 + {f_1} + {f_2}}} $$ $$\left[\because \textbf{Mean}=\boldsymbol{\dfrac{\sum f_i x_i}{\sum f_i}}\right]$$
$$ \Rightarrow 1.46 = \dfrac{{140 + {f_1} + 2{f_2}}}{{86 + 114}}\ \ \ \ \ \ \ \ \ \ \ \ \ \ \ \ {\textbf{ - - - [from (1)]}} $$
$$ \Rightarrow 1.46 = \dfrac{{140 + {f_1} + 2{f_2}}}{{200}} $$
$$ \Rightarrow 292 = 140 + {f_1} + 2{f_2} $$
$$ \Rightarrow {f_1} + 2{f_2} = 152\ \ \ \ \ \ \ \ \ \ \ \ \ \ \ \ \ \ \ \ \ \ \ \ \ \ {\textbf{ - - - - (2)}} $$

$$ {\textbf{Step -2: Find }} \boldsymbol{f_1\ \&\ f_2}\textbf{ from equation (1) and (2)} $$
$$ {\text{Subtract (1) from (2) we get}} $$
$$ {\text{ }}{f_1} + 2{f_2} - {\text{ }}{f_1} - {f_2} = 152 - 114 $$
$$ \Rightarrow {\text{ }}{f_2} = 38 $$
$$ {\text{Put the value of }}{f_2}{\text{ in (1) we get}} $$
$$ {f_1} + {f_2} = 114 $$
$$ \Rightarrow {f_1} + 38 = 114 $$
$$ \Rightarrow {f_1} = 76 $$
$$ {\textbf{ Hence, the value of }}{f_1}{\textbf{ and }}{f_2}{\textbf{ is }}{f_1} = 76{\textbf{ and }}{f_2} = 38.{\textbf{ }} $$
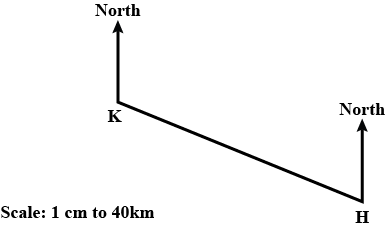
The Patel family flies from their home town, H, to Kiruna , K , in Lapland.
The Patel family has six suitcases.
The number of items in each suitcase is shown below.
$$15 $$ $$16$$ $$16$$ $$18$$ $$19$$ $$21$$
Find the range.
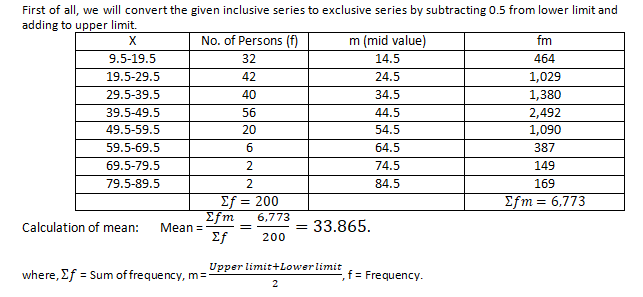
Calculate the mean from the following frequency distribution:
| X | 10-19 | 20-29 | 30-39 | 40-49 | 50-59 | 60-69 | 70-79 | 80-89 |
| No. of Persons | 32 | 42 | 40 | 56 | 20 | 6 | 2 | 2 |
Find the class mark of class interval 100-120.
Find the class mark of the class 31-40.
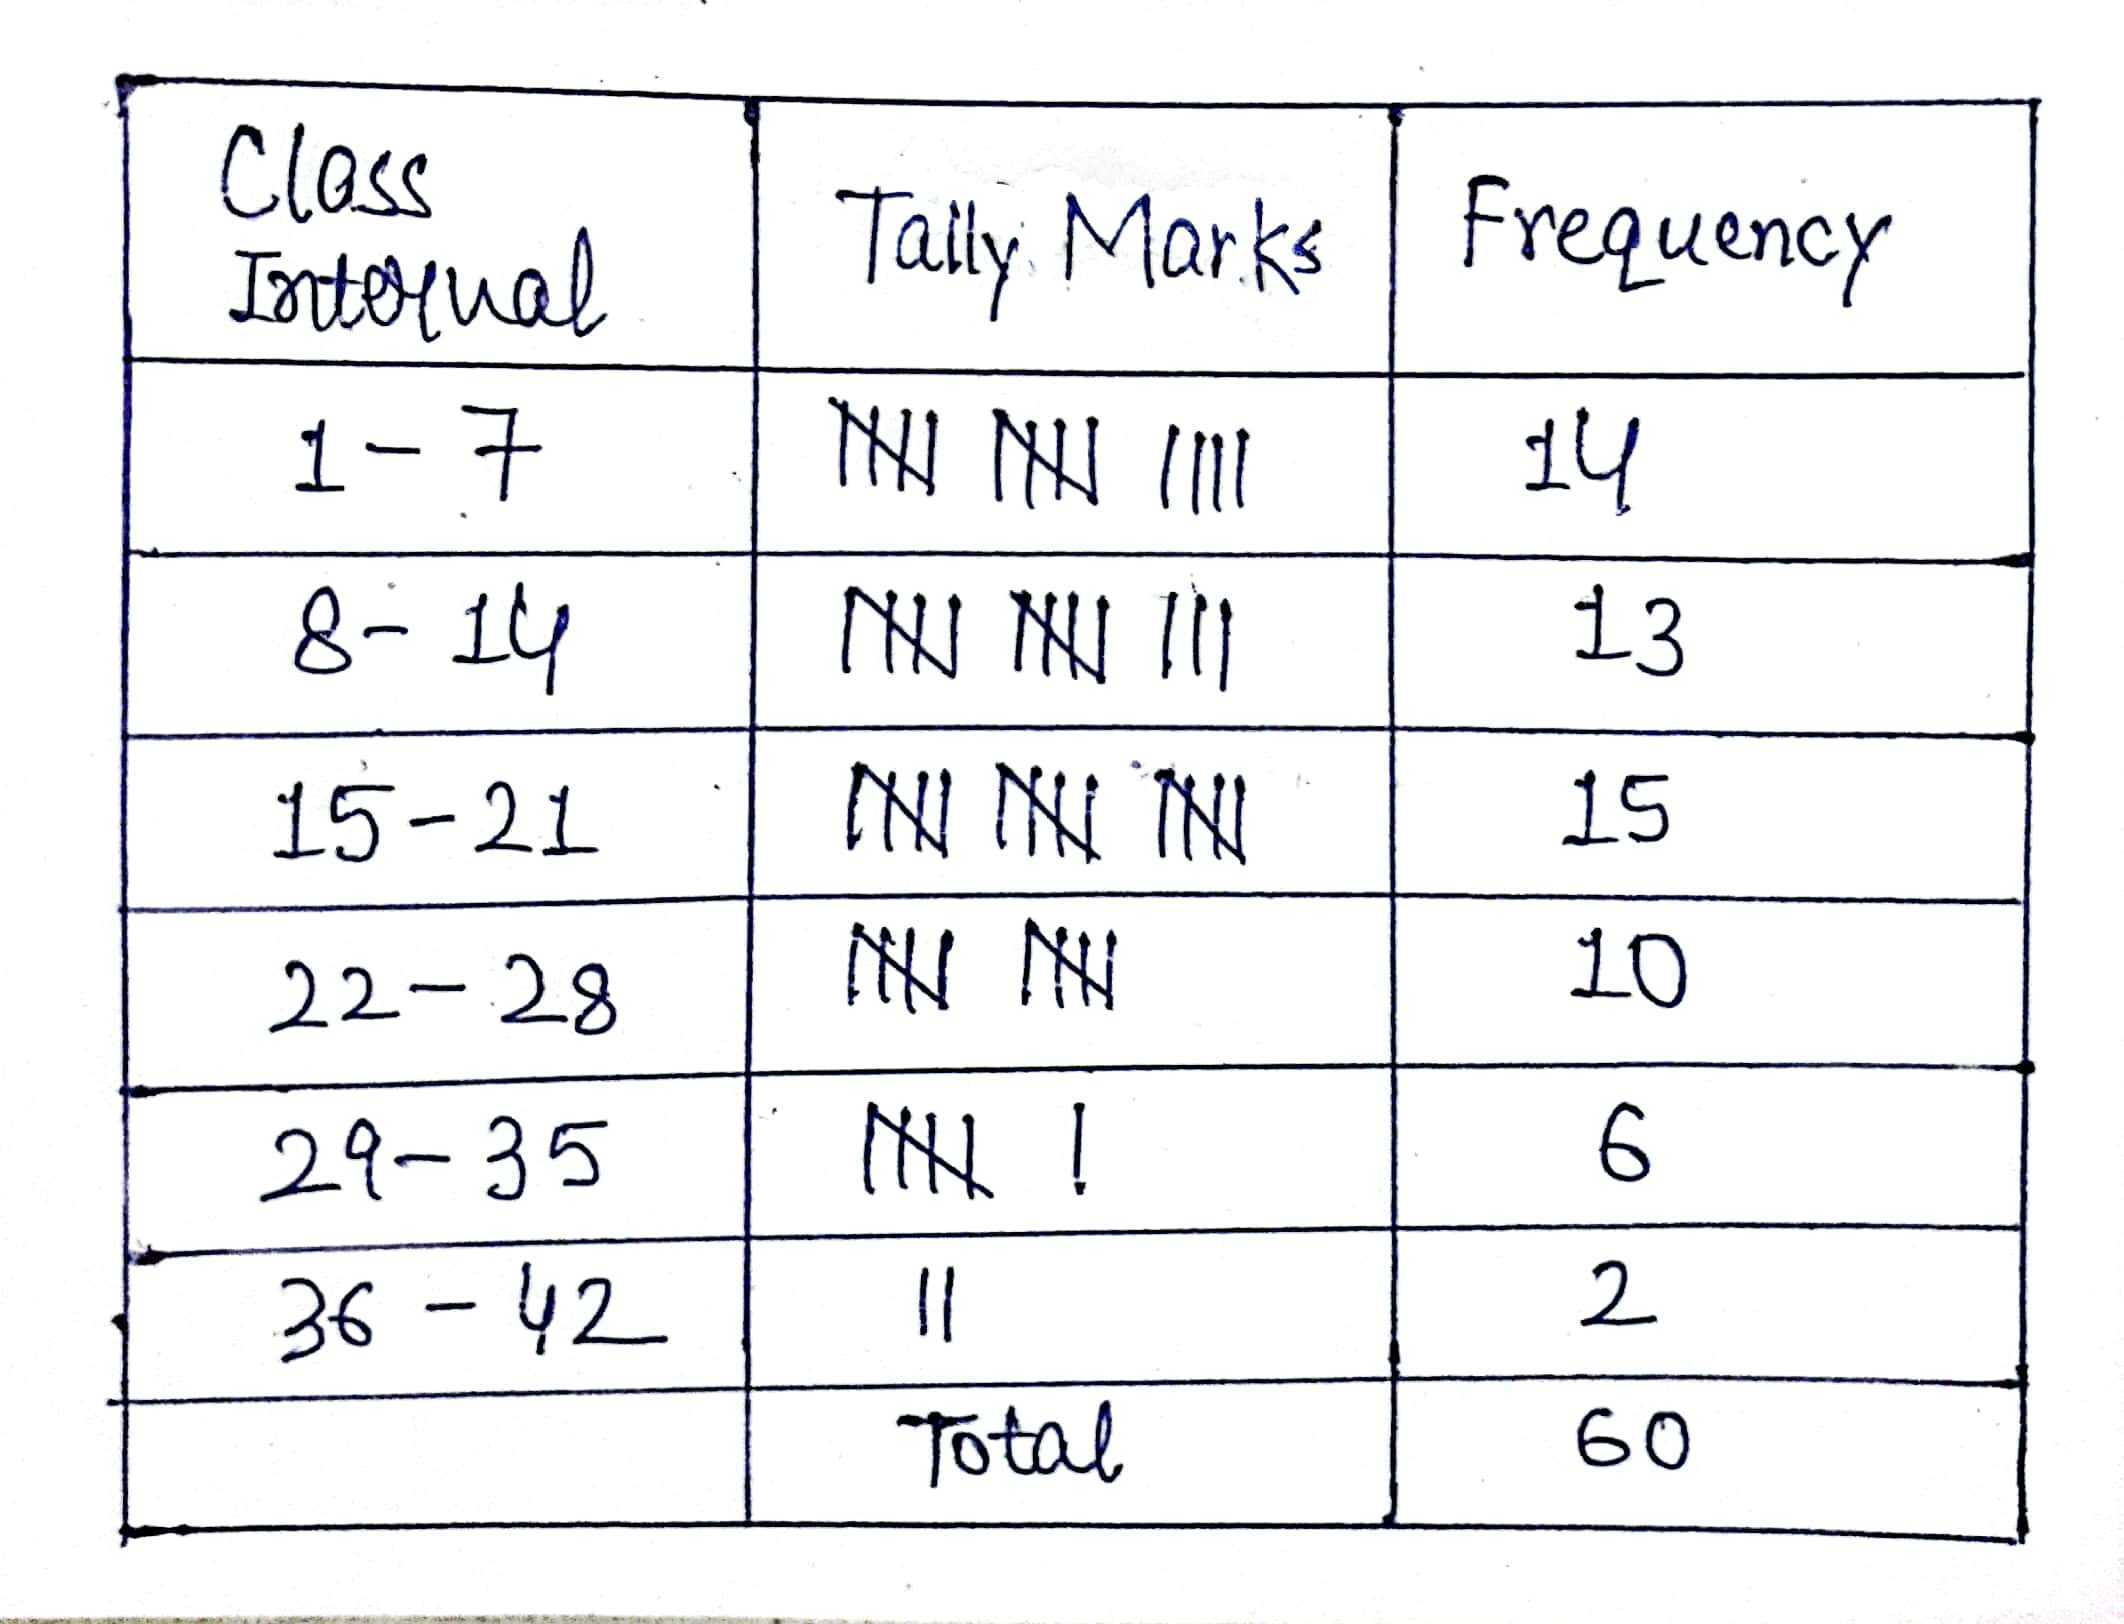
Prepare a frequency distribution by inclusive method, taking class interval of 7 from the following data:
28,17,15,22,29,21,23,27,18,12,7,2,9,4,6,1,8,3,10,5,20,16,12,8,4,33,27,21,15,9,3,36,27,
18,9,2,4,6,32,31,29,18,14,13,15,11,9,7,1,5,37,32,28,26,24,20,19,25,19,20
Convert the normal distribution into more than and less than series:
| Class | 0-9 | 10-19 | 20-29 | 30-39 |
| Frequency | 12 | 20 | 22 | 18 |
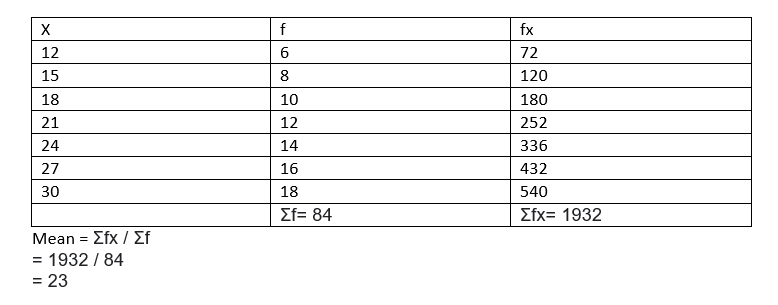
Find out the mean from the following data:
| X | 12 | 15 | 18 | 21 | 24 | 27 | 30 |
| Y | 6 | 8 | 10 | 12 | 14 | 16 | 18 |
Prepare a frequency table taking class intervals 20-24, 25-29, 30-34 and so on from the following data:
| 21 | 20 | 55 | 39 | 48 | 46 | 36 | 54 | 42 | 30 |
| 29 | 42 | 32 | 40 | 34 | 31 | 35 | 37 | 52 | 44 |
| 54 | 36 | 41 | 33 | 23 | 39 | 28 | 44 | 45 | 38 |
| 39 | 45 | 37 | 33 | 51 | 53 | 52 | 46 | 43 | 47 |
| 51 | 26 | 52 | 48 | 25 | 34 | 37 | 33 | 36 | 27 |
Calculate mean from the following data:Size
Frequency
20
14
25
18
30
33
35
30
40
20
45
15
50
13
55
7
Size | Frequency |
20 | 14 |
25 | 18 |
30 | 33 |
35 | 30 |
40 | 20 |
45 | 15 |
50 | 13 |
55 | 7 |

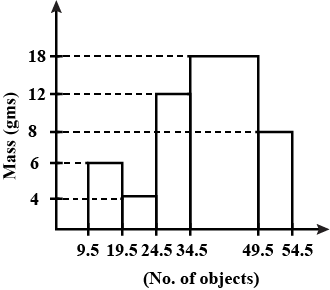
The following distribution gives the mass of $$48$$ objects measured to the nearest gram. Draw a histogram to illustrate the data.
| Mass in (gms) | $$10-19$$ | $$20-24$$ | $$25-34$$ | $$35-49$$ | $$50-54$$ |
| No. of objects | $$6$$ | $$4$$ | $$12$$ | $$18$$ | $$8$$ |
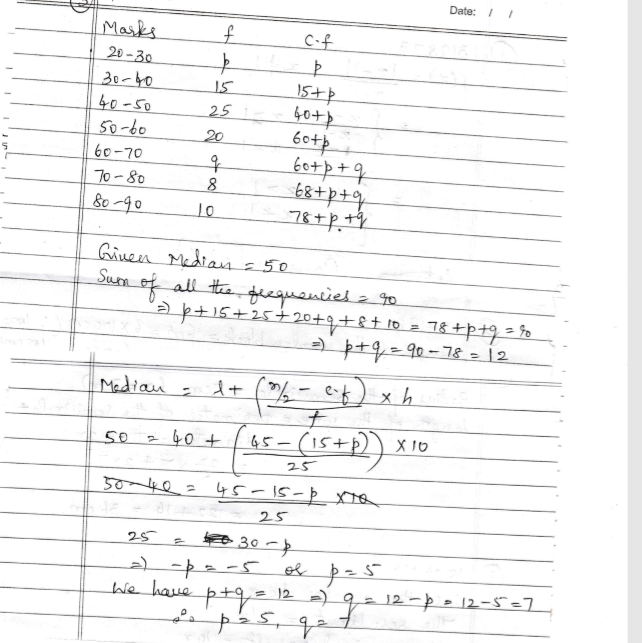
The median of the following data isFind the values of p and q, if the sum of all the frequencies is 90.
| Marks | Frequency |
| 20-30 30-40 40-50 50-60 60-70 70-80 80-90 | p 15 25 20 q 8 10 |
In the order to study the qualities of apples and grade them, 40 apples were randomly chose and weighed the weights (in gram) are given her. Write the upper and lower limits of the class intervals that you will form and prepare a frequency table .
160,145,122,167,130,137,142,174, 150,155,157,144,130,140,154,150,128,132,140,168,170,167,171,163,137,170,160,161,135,140,139,166,161,171,159,169,141,150,154,152
The following are the daily expeditures (in $$Rs$$) of $$30$$ student in a school.
| Ependiture (in $$Rs$$) | No. of students |
| $$10-15$$ | $$3$$ |
| $$15-20$$ | $$5$$ |
| $$20-25$$ | $$10$$ |
| $$25-30$$ | $$6$$ |
| $$30-35$$ | $$4$$ |
| $$35-40$$ | $$2$$ |
| Total | $$30$$ |
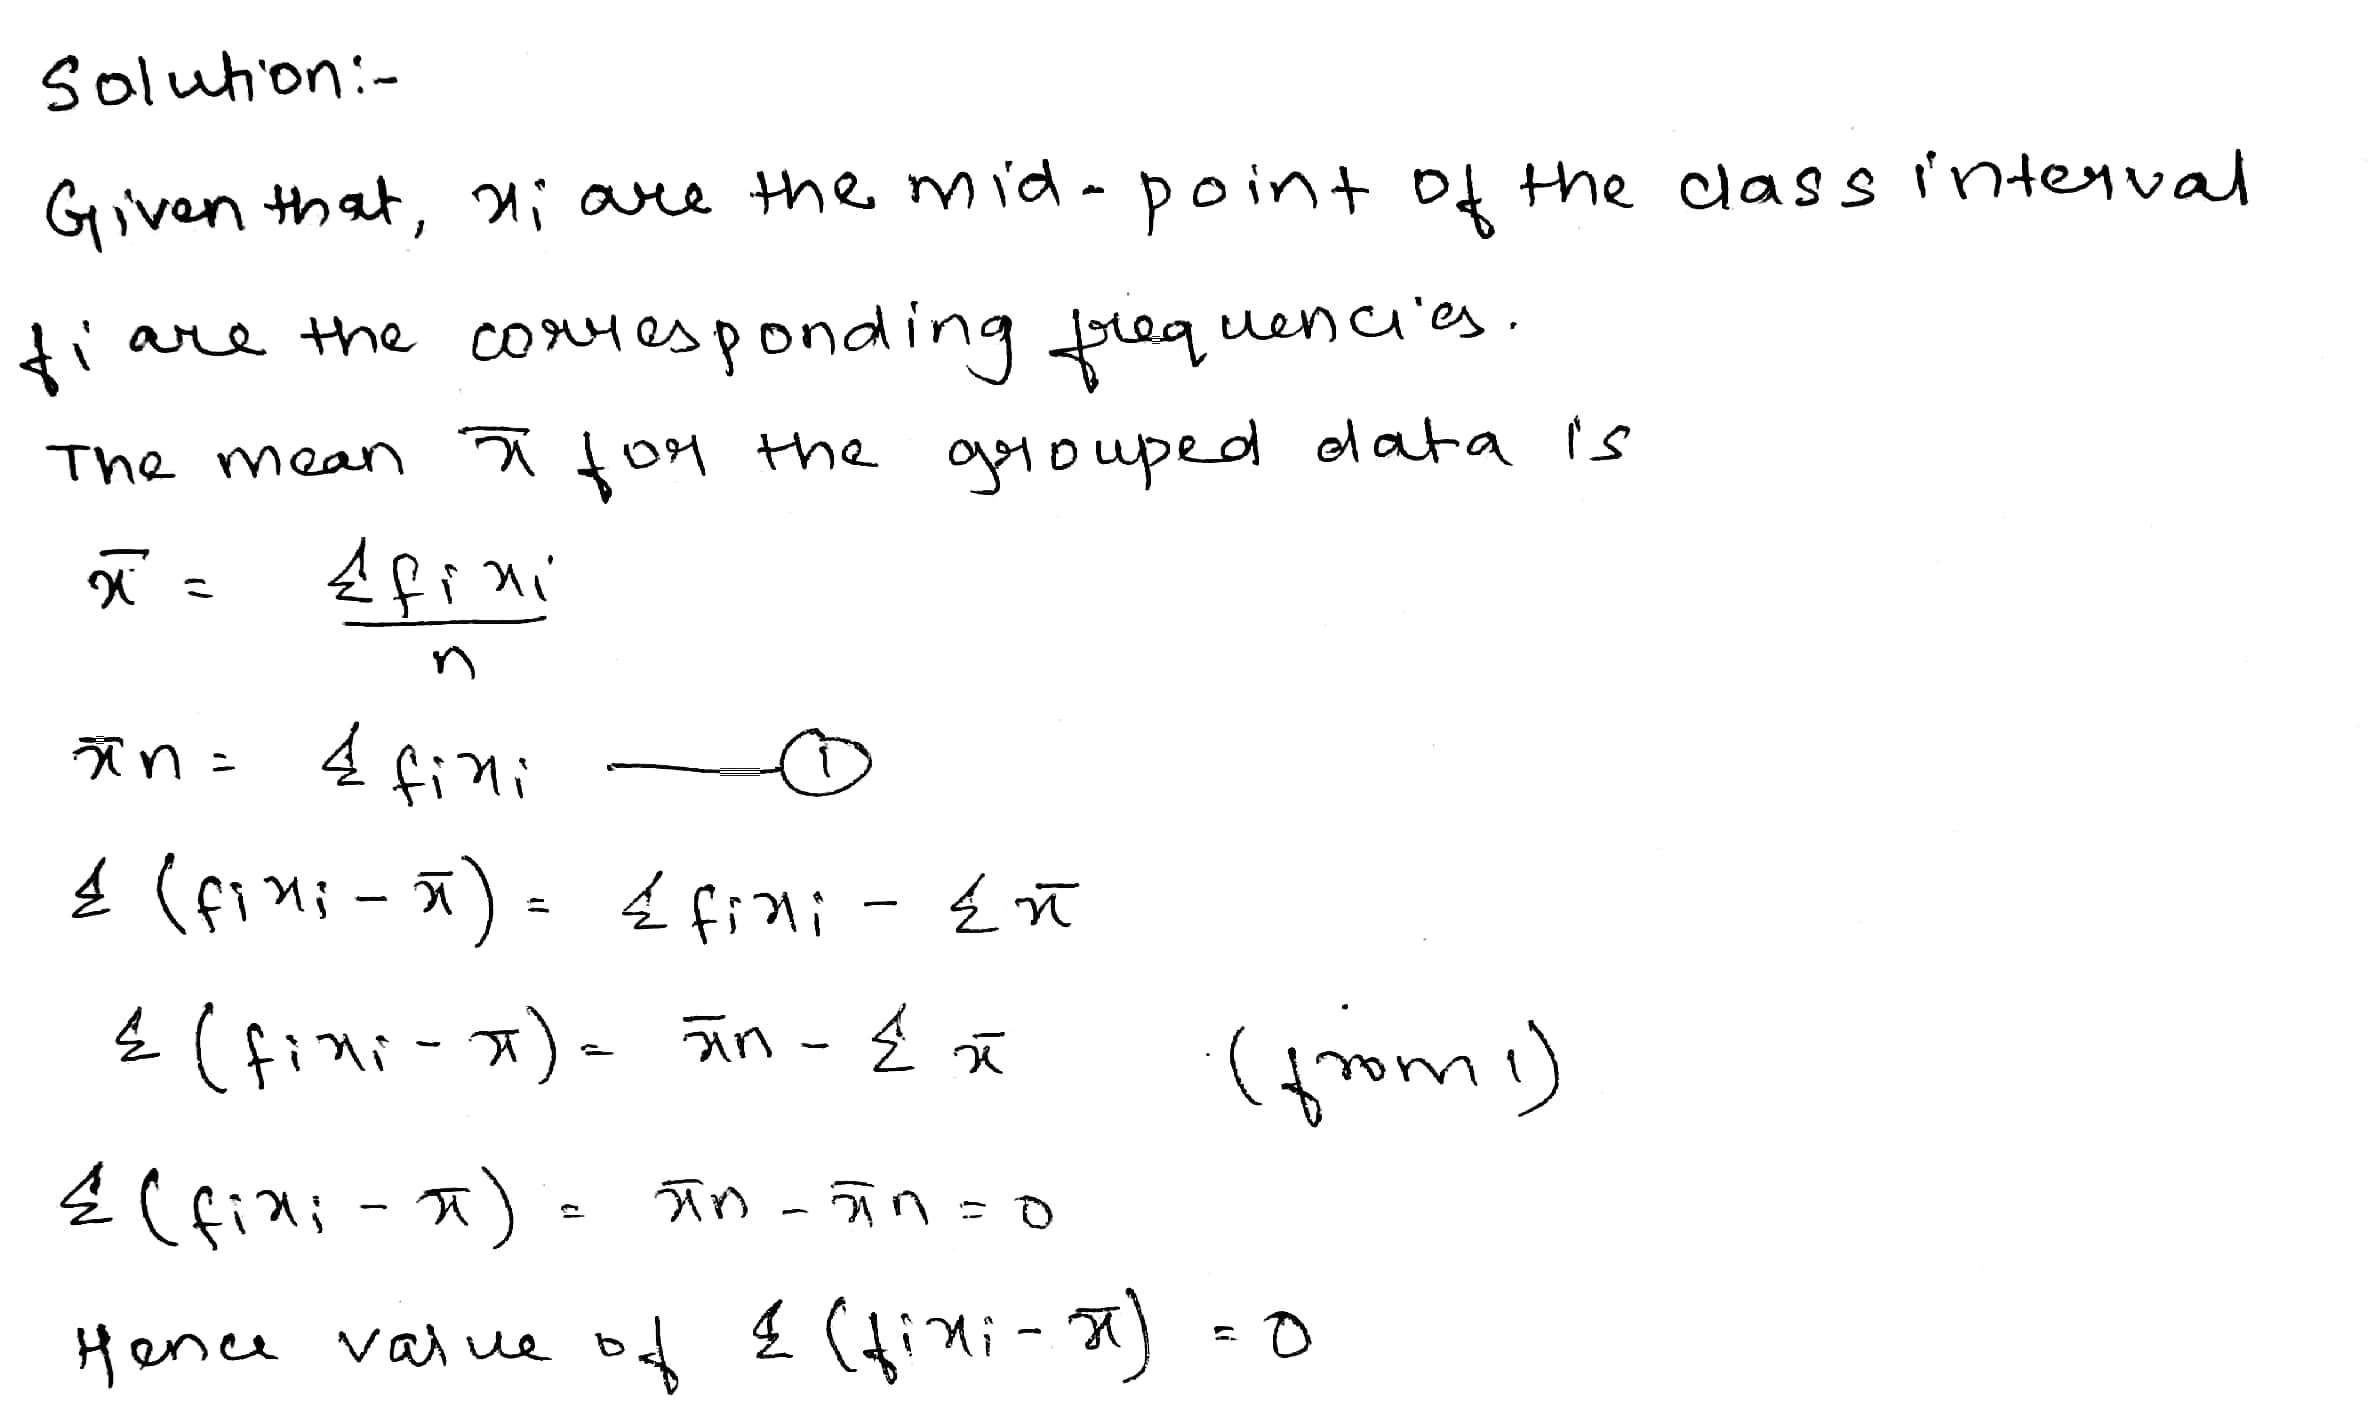
If $$x _ { i }$$ 's are the mid-points of the class interval of grouped data, $$f _ { i }$$ 's are the corresponding frequencies and $$\overline { x }$$ is the mean, then find $$\Sigma \left( f _ { i } x _ { i } - \overline { x } \right)$$
In the following frequency distribution of $$165$$ observations, the mode is $$34.5$$. Find the missing frequencies $$a$$ and $$b$$.
| Class | $$5-14$$ | $$14-23$$ | $$23-32$$ | $$32-41$$ | $$41-50$$ | $$50-59$$ | $$59-68$$ |
| Frequency | $$5$$ | $$11$$ | $$a$$ | $$53$$ | $$b$$ | $$16$$ | $$10$$ |
The average frequency is $$18$$. Find the missing frequency $$f$$.
| Class Interval | Frequency |
| $$11-13$$ | $$7$$ |
| $$13-15$$ | $$6$$ |
| $$15-17$$ | $$9$$ |
| $$17-19$$ | $$13$$ |
| $$19-21$$ | $$f$$ |
| $$21-23$$ | $$5$$ |
| $$23-25$$ | $$4$$ |
The following are the daily expeditures (in $$Rs$$) of $$30$$ student in a school.
| Ependiture (in $$Rs$$) | No. of students |
| $$10-15$$ | $$3$$ |
| $$15-20$$ | $$5$$ |
| $$20-25$$ | $$10$$ |
| $$25-30$$ | $$6$$ |
| $$30-35$$ | $$4$$ |
| $$35-40$$ | $$2$$ |
| Total | $$30$$ |
The mean of the following frequency distribution is 62.8 and the sum of all frequencies isCompute the missing frequencies $${ f }_{ 1 }$$ and $${ f }_{ 2 }$$.
| Class | 0 - 20 | 20 - 40 | 40 - 60 | 60 - 80 | 80 - 100 | 100 - 120 | Total |
| Frequency | 5 | $${ f }_{ 1 }$$ | 10 | $${ f }_{ 2 }$$ | 7 | 8 | 50 |
The marks obtained by $$40$$ students of a class in an examination are given:
$$8, 47, 22, 31, 17, 13, 38, 26, 3, 34, 29, 11, 22, 7, 15, 24, 38, 31, 21, 35, 42, 24,$$ $$45, 23, 21, 27, 29, 49, 25, 48, 21, 15, 18, 27, 19, 45, 14, 34, 37, 34$$.
Prepare a frequency distribution table with equal class intervals, starting from $$0-10$$ [where $$10$$ is not included].
Prepare a frequency distribution table with equal class intervals, starting from $$0-10$$ [where $$10$$ is not included].
The final marks in mathematics of 30 students are as follows:
$$53,61,48,60,78,68,55,100,67,90$$
$$75,88,77,37,84,58,60,48,62,56$$
$$44,58,52,64,98,59,70,39,50,60$$
Now answer the following:
How many have scored less than 50?
The final marks in mathematics of 30 students are as follows:
$$53,61,48,60,78,68,55,100,67,90$$
$$75,88,77,37,84,58,60,48,62,56$$
$$44,58,52,64,98,59,70,39,50,60$$
Arrange these marks in the ascending order, 30 to 39 one group, 40 to 49 second group, etc.
the mean of the following data is 50. Find the missing frequencies $$f_{1}$$ and $$f_{2}$$
| C.L | 0-20 | 20-40 | 40-60 | 60-80 | 80-100 | Total |
| Frequency | 17 | $$f_{1}$$ | 321 | $$f_{2}$$ | 19 | 120 |
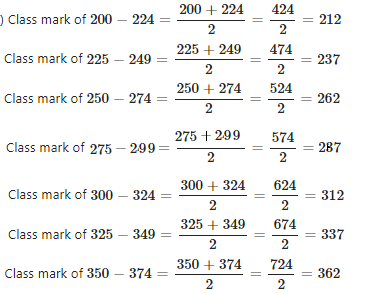
The class size of a distribution is 25 and the first class-interval is $$200-224$$. There are seven class-intervals.
Write the class-marks of each interval.
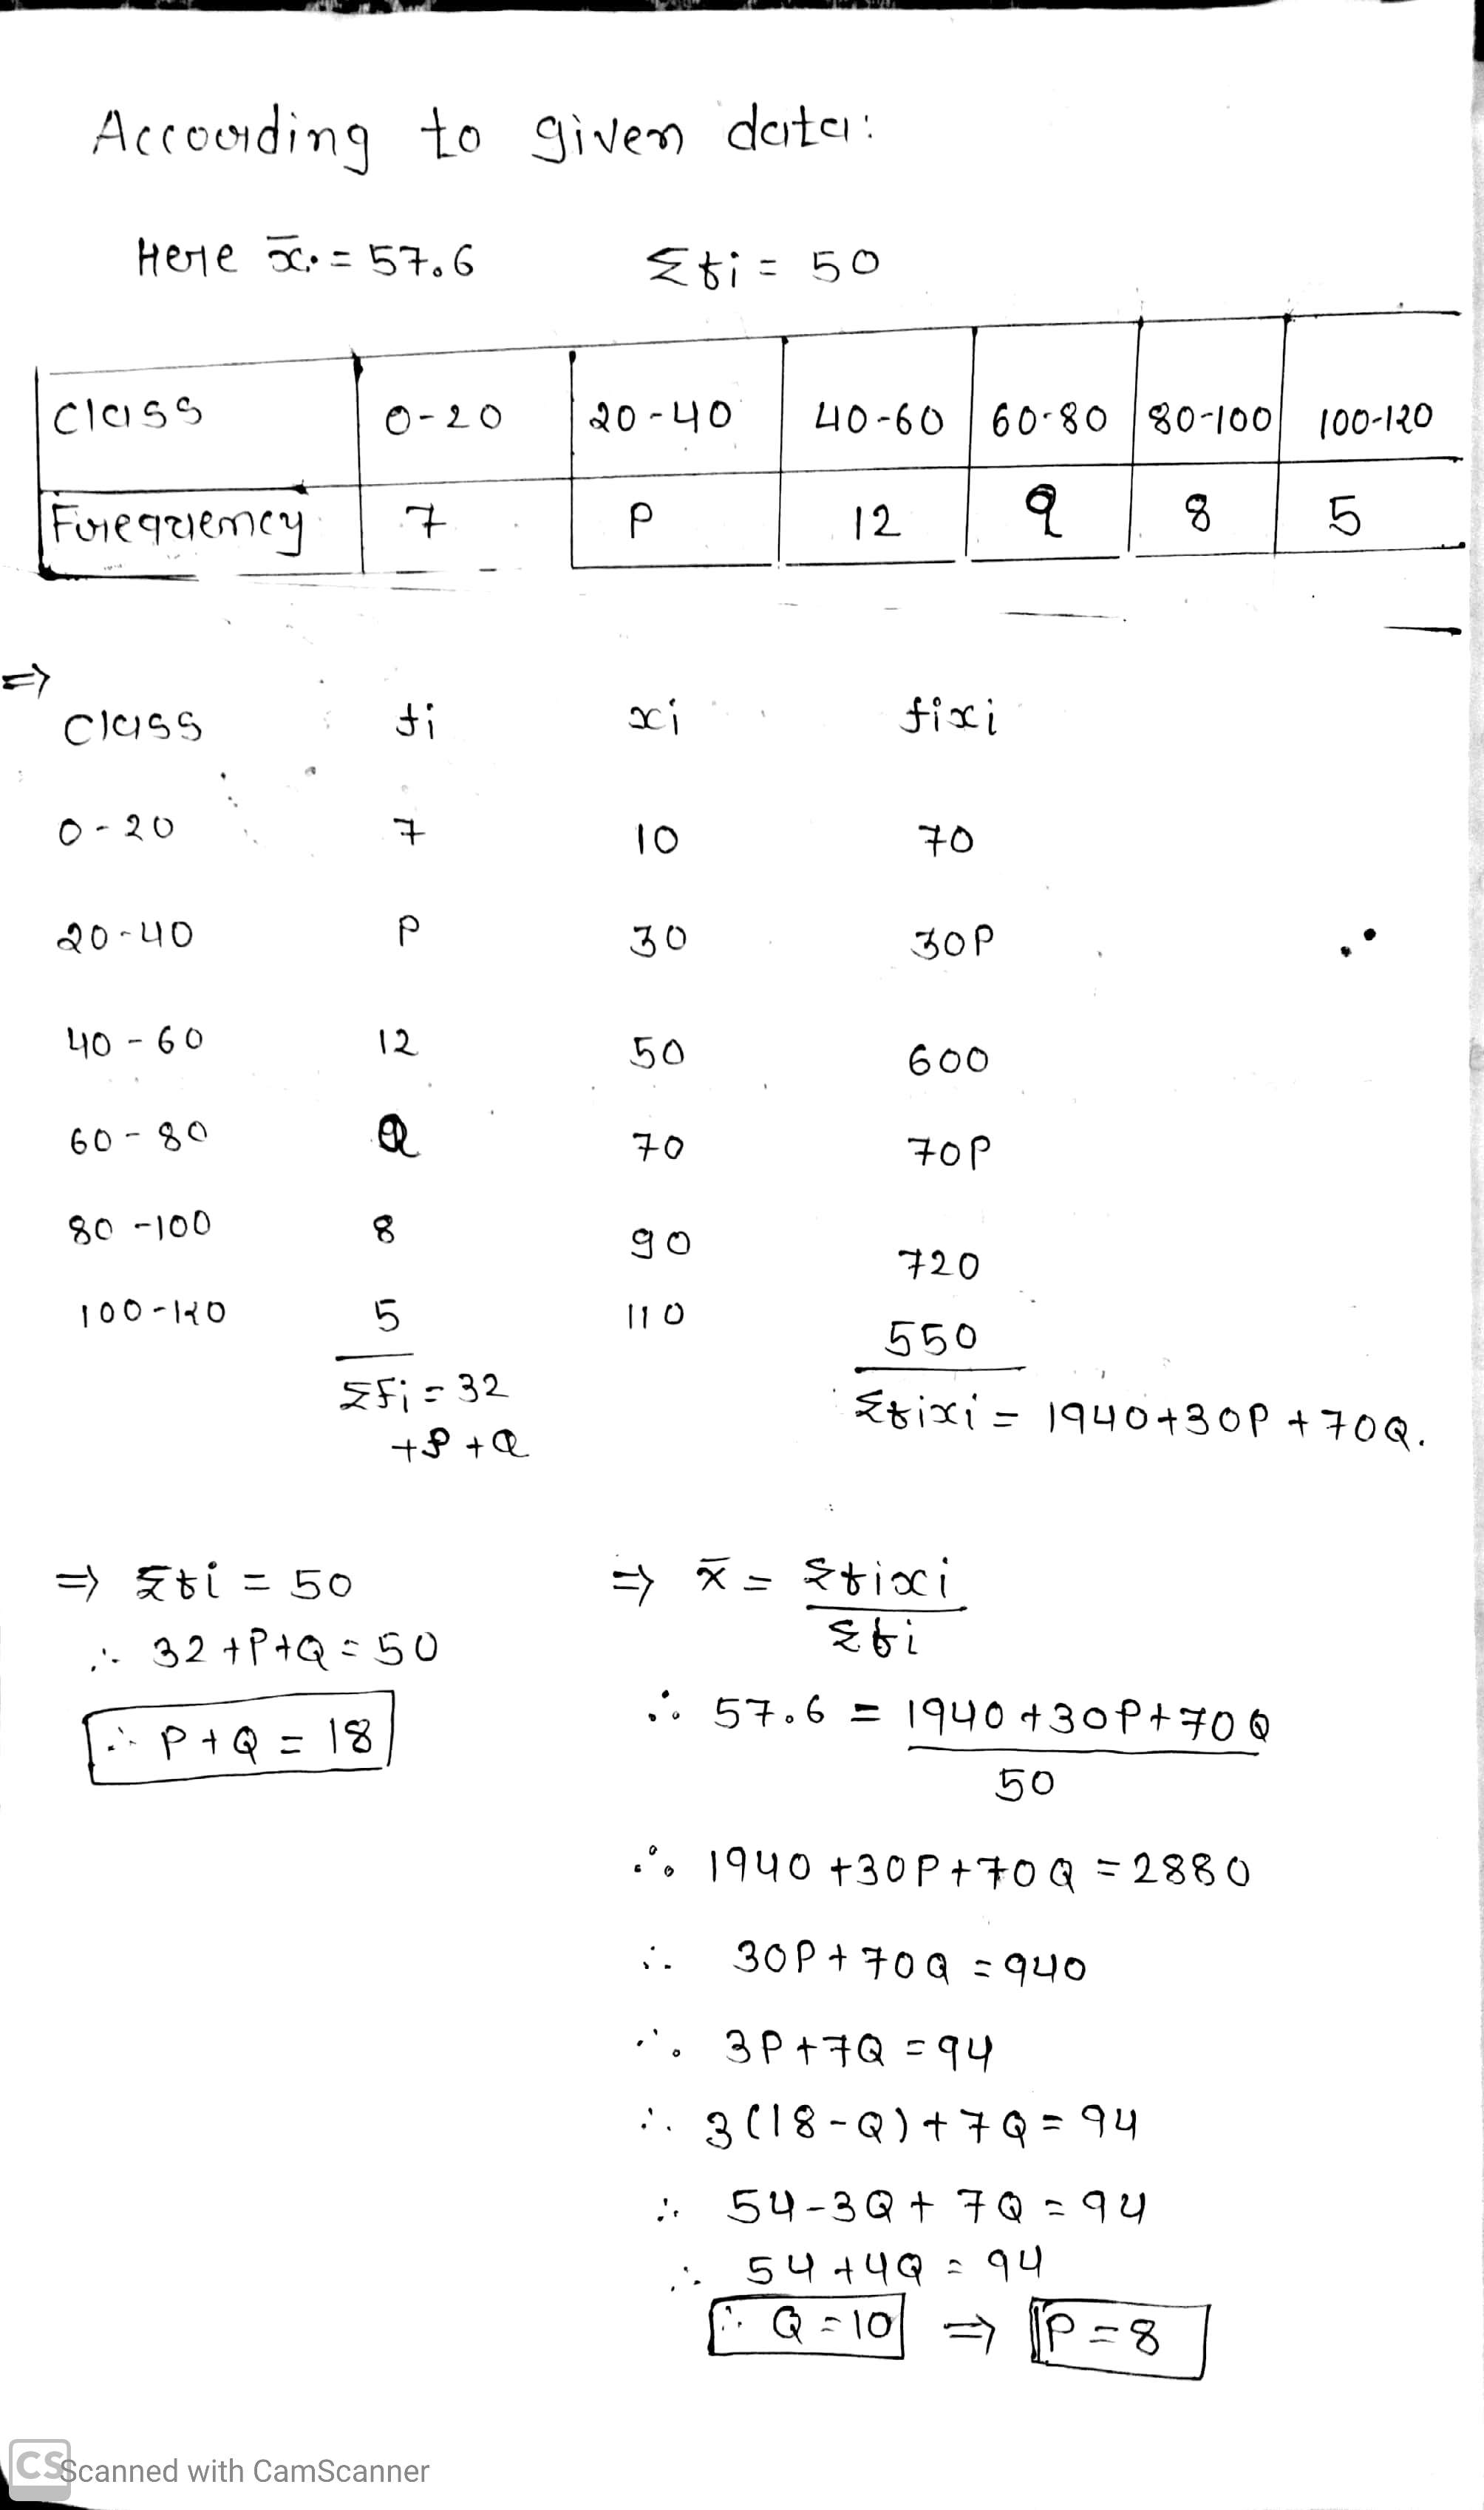
then mean of the following frequency distribution is 57.6 and he sum of all the frequencies isFind the values of p and q.
| Class | 0-20 | 20-40 | 40-60 | 60-80 | 80-100 | 100-120 |
| Frequency | 7 | p | 12 | q | 8 | 5 |
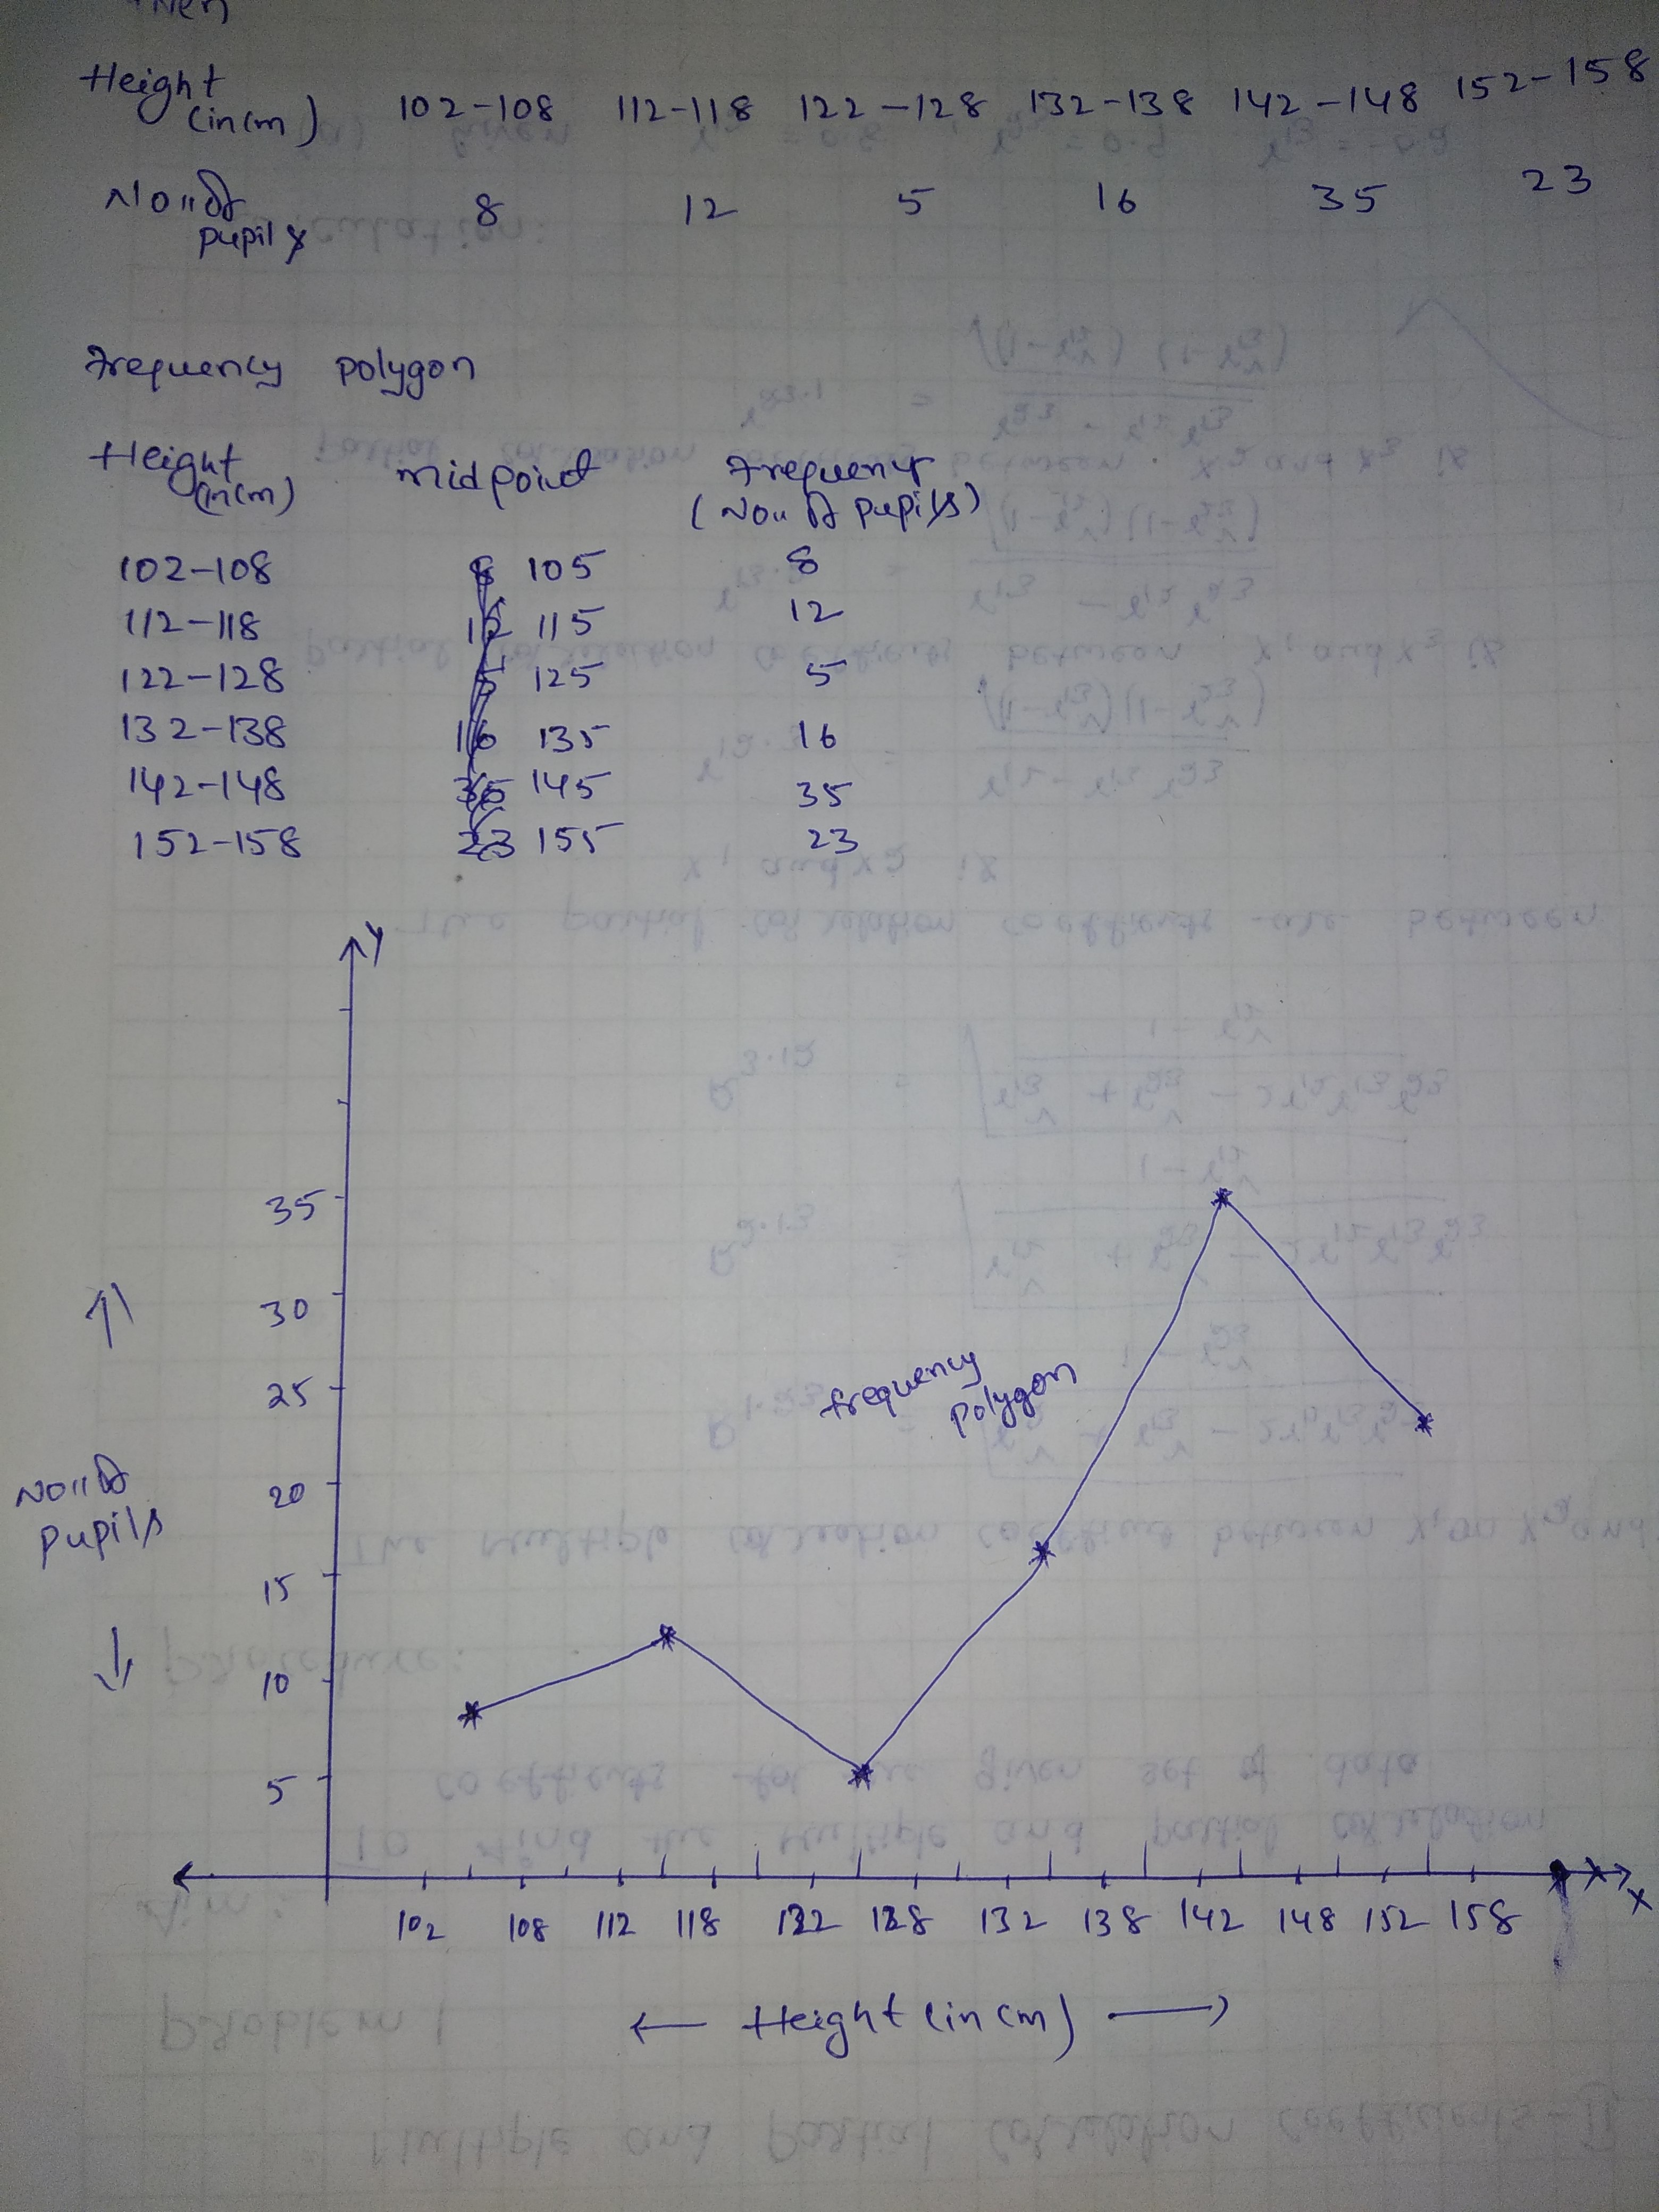
Construct a frequency polygon for the given data on a graph sheet of paper
| Height (in cm) | 102 - 108 | 112 - 118 | 122 - 128 | 132 - 138 | 142 - 148 | 152 - 158 |
| No. of pupils | 8 | 12 | 5 | 16 | 35 | 23 |
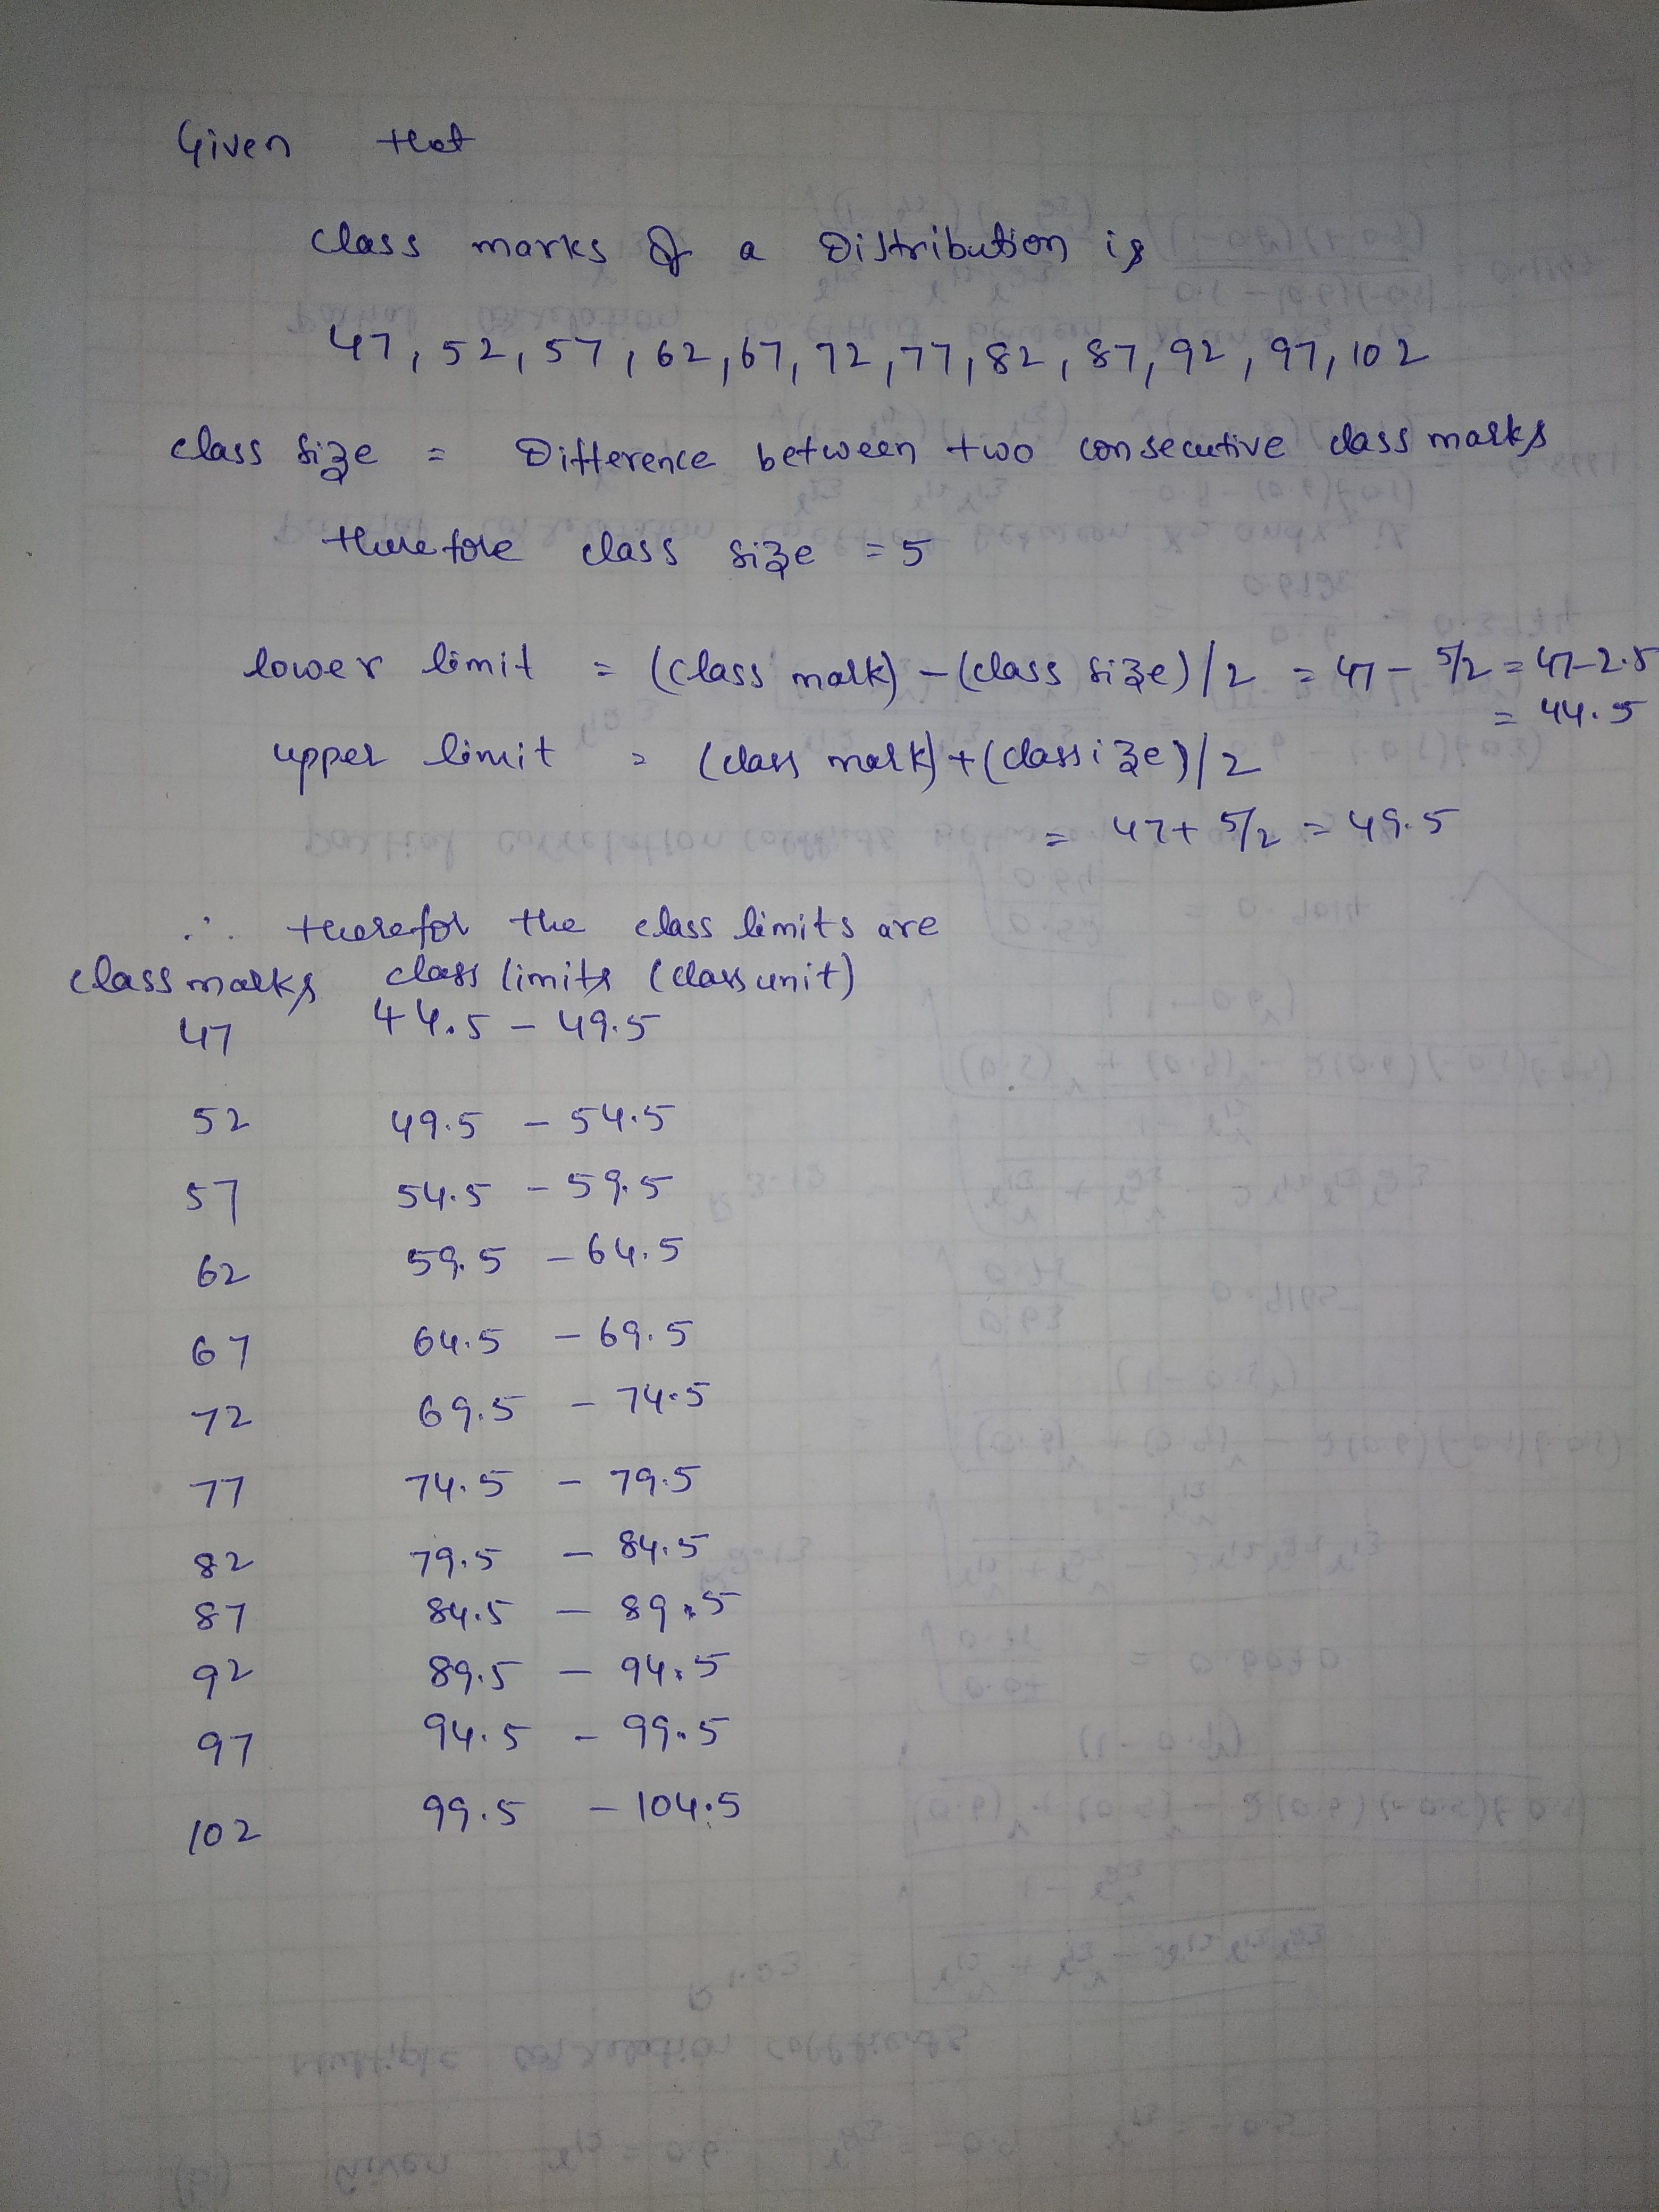
The class marks of frequency distribution are $$47,52,57,62,67,72,77,82,87,92,97,102 $$. Find the class size and class unit
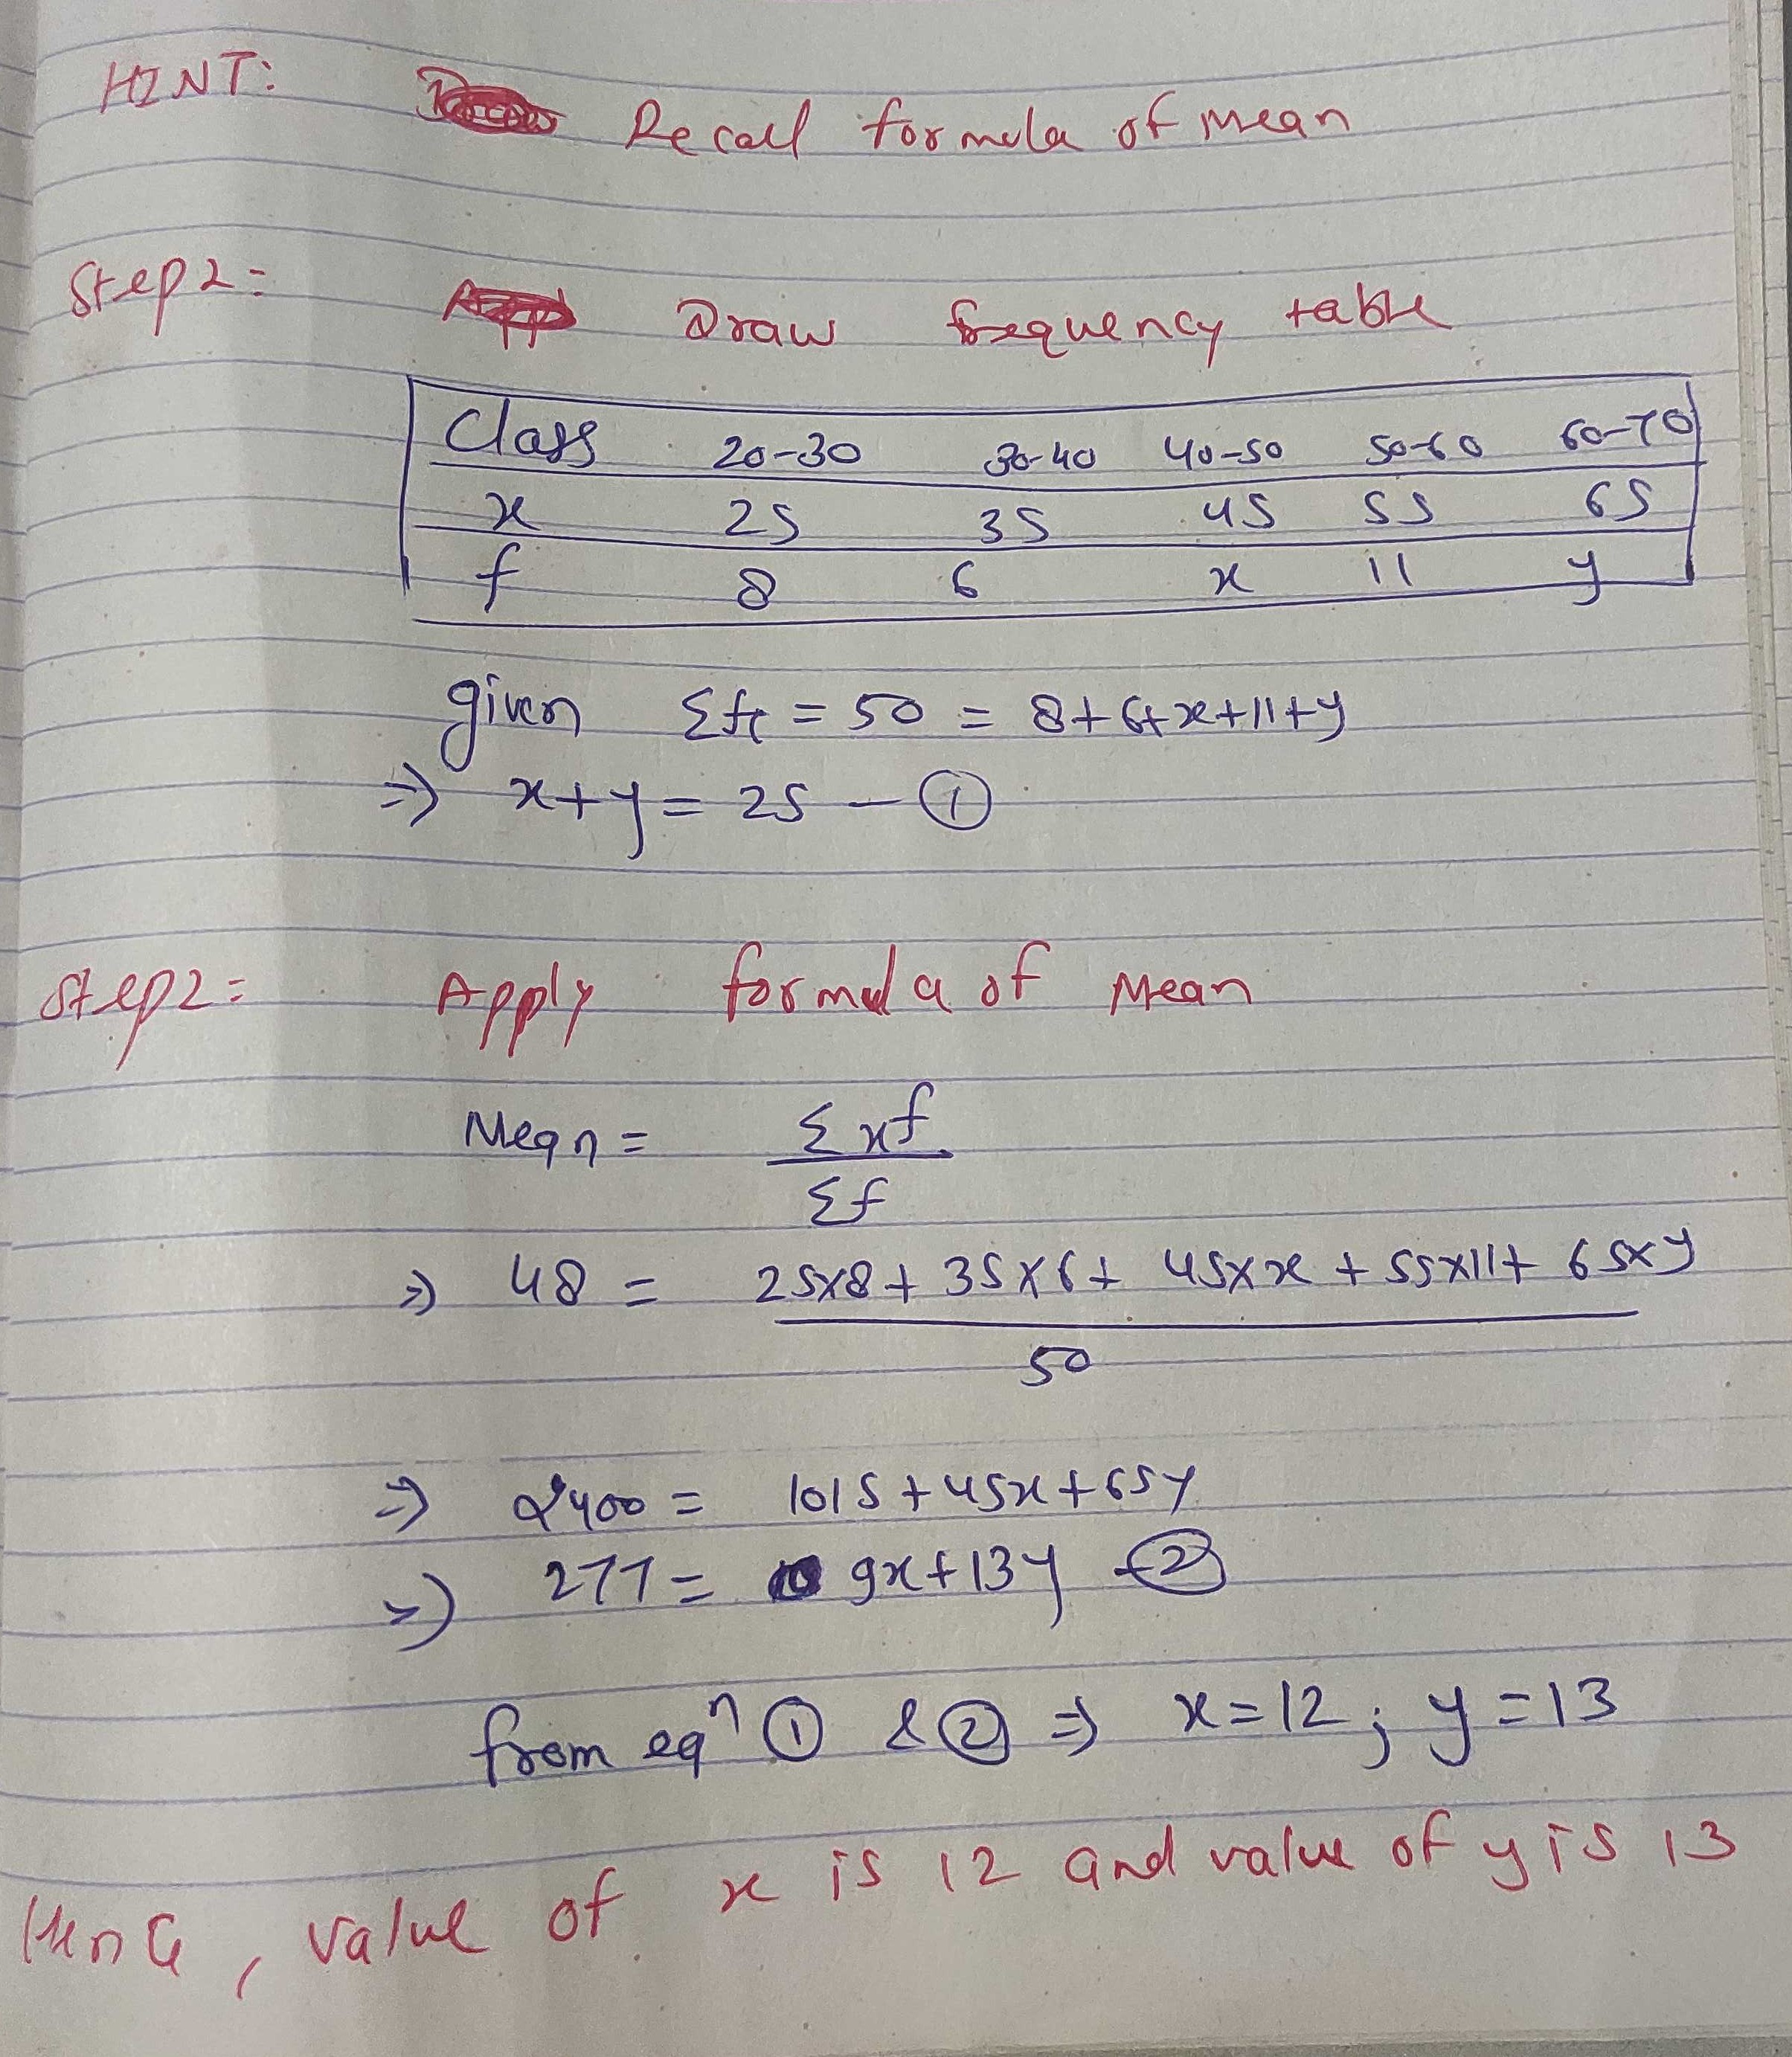
The mean of the following distribution is 48 and sum of all the frequencies isFind the missing frequencies x and y.
| Class | 20-30 | 30-40 | 40-50 | 50-60 | 60-70 |
| Frequency | 8 | 6 | x | 11 | y |
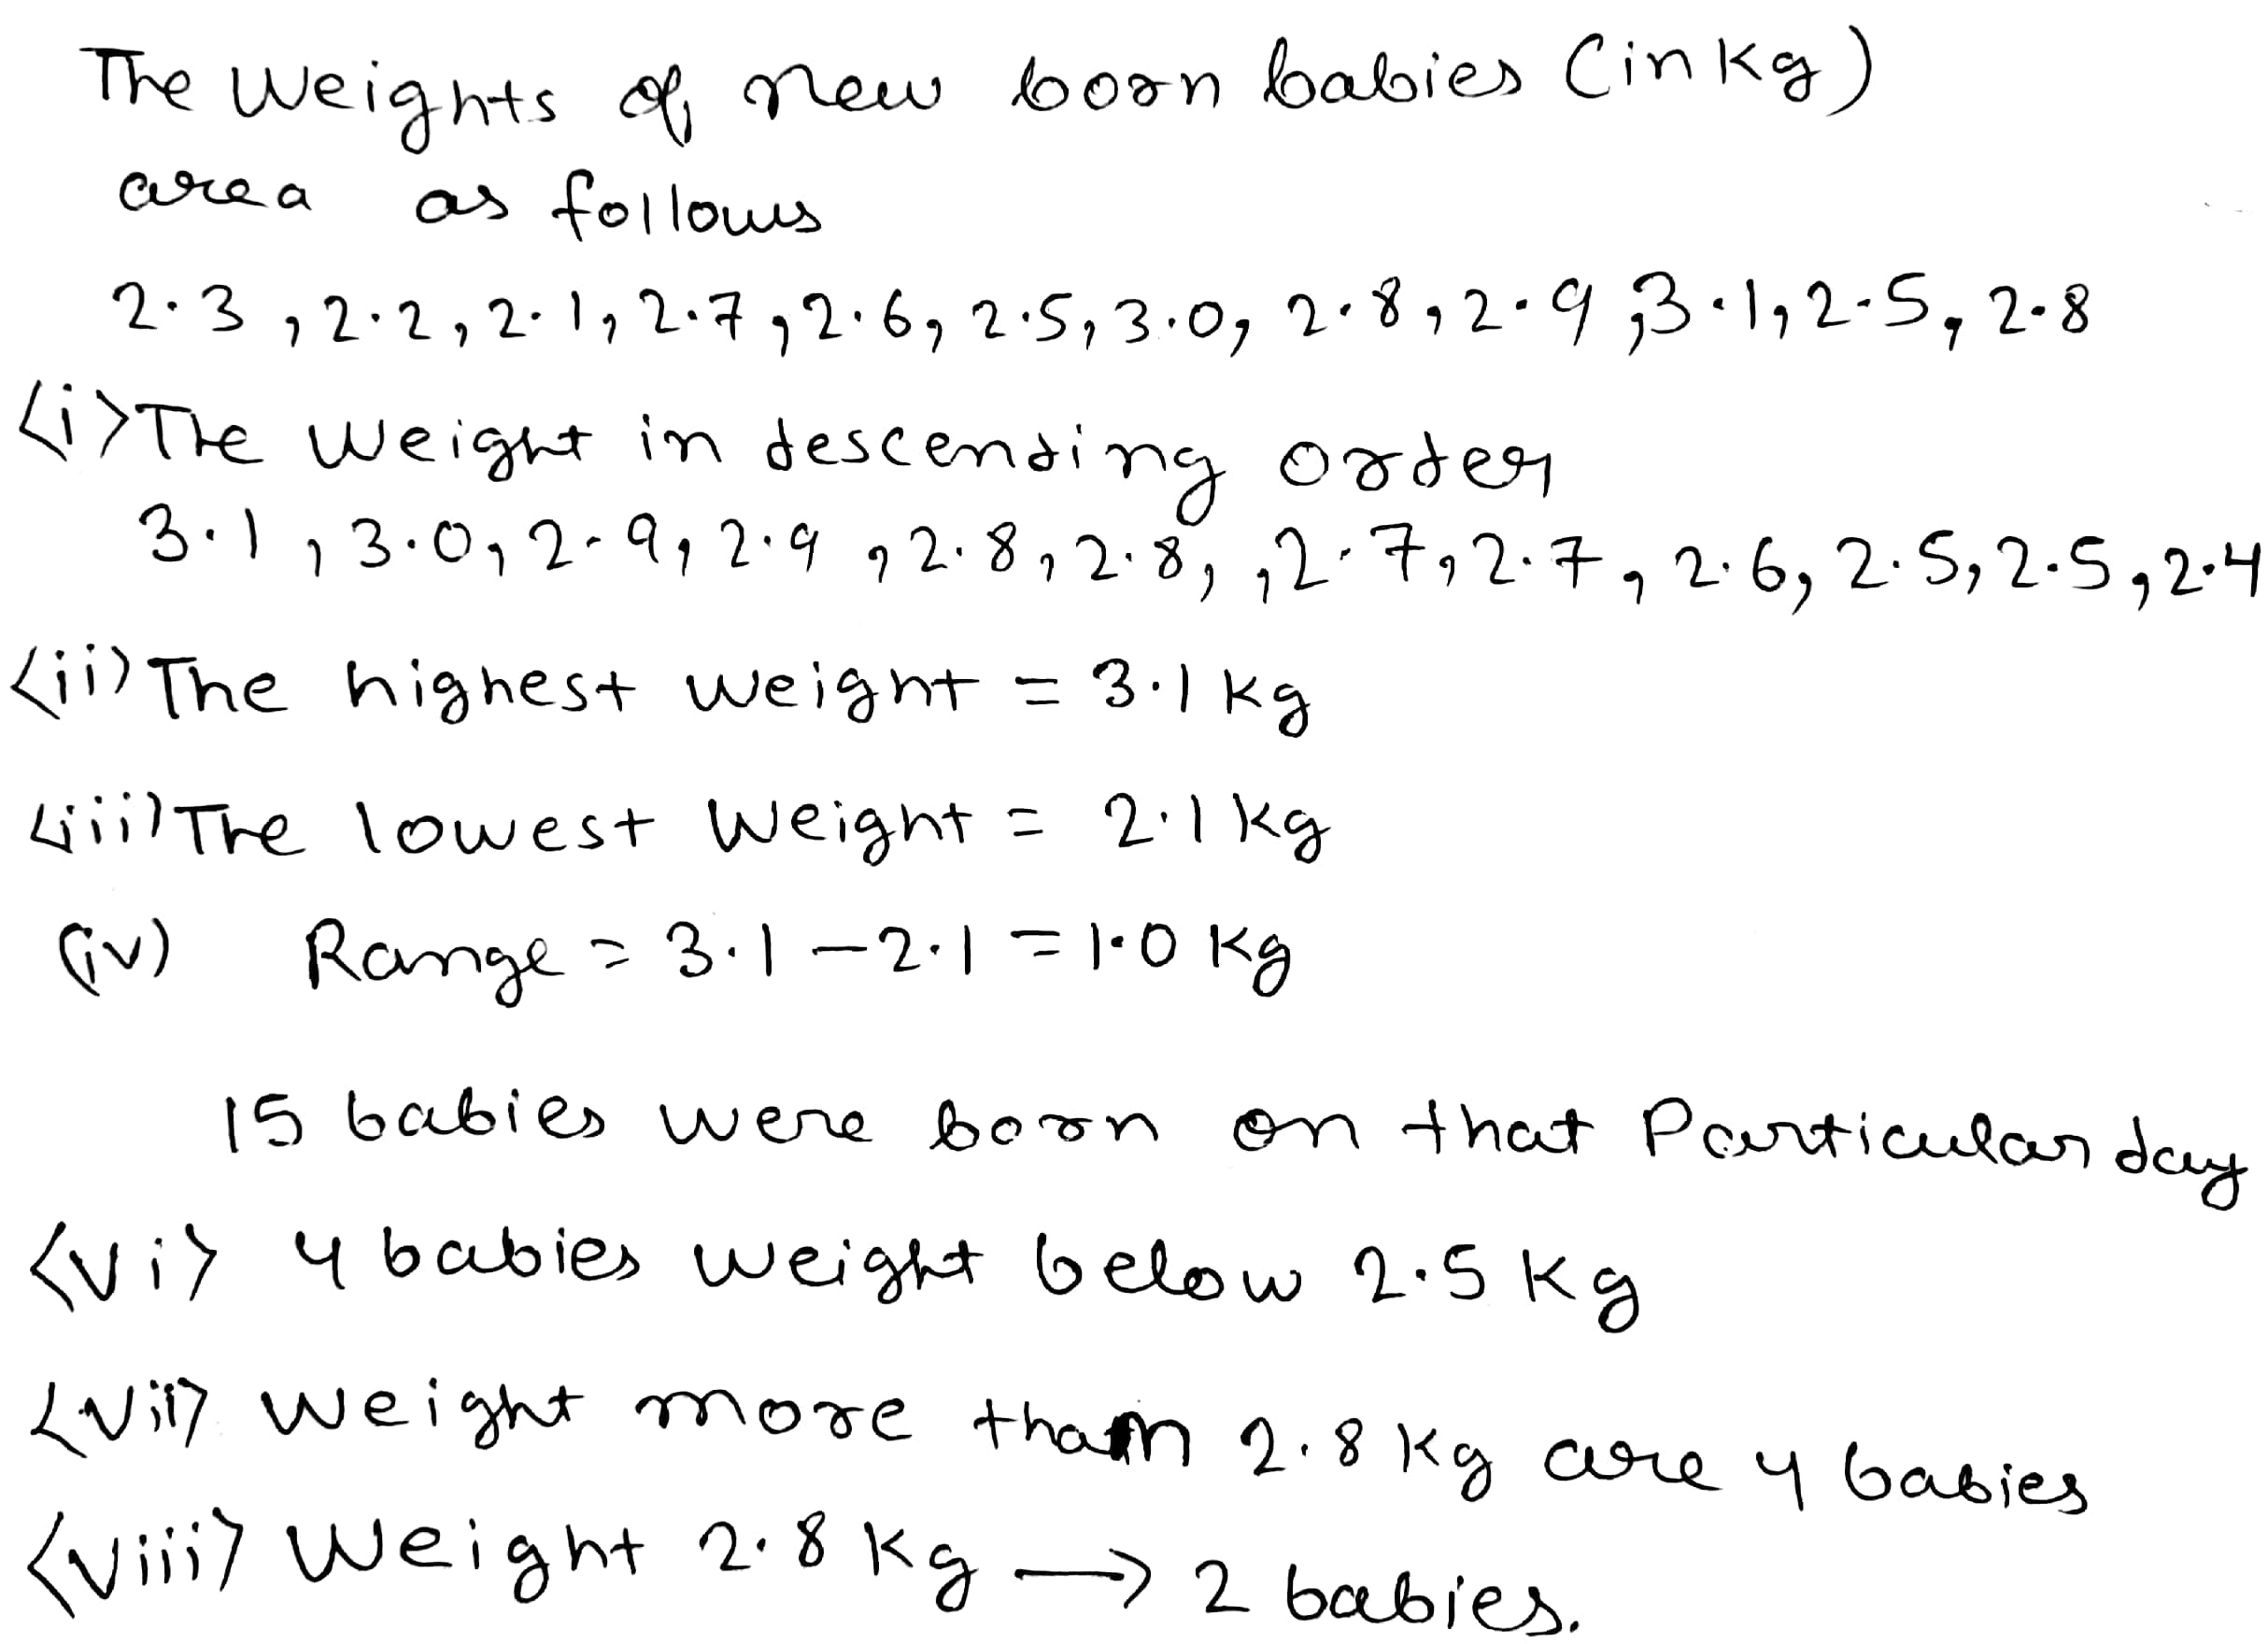
The weight of new born babies (in kg) in a hospital on a particular day are as follows:
$$2.3,2.2,2.1,2.7,2.6,3.0,2.5,2.9,2.8,3.1,2.5,2.8,2.7,2.9,2.4$$
Rearrange the weights in weights in descending order.
The monthly wages of $$30$$ workers in a factory are given below:
$$830,835,890,810,835,836,869,845,898,890,820,860,832,833,855,$$$$845,804,808,812,840,885,835,836,878,840,868,890,806,840,890$$.
Represent the data in the form of a frequency distribution with class size $$10$$.
Represent the data in the form of a frequency distribution with class size $$10$$.
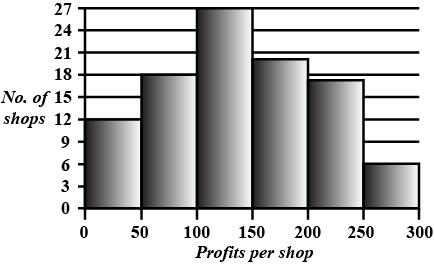
The monthly profits (in Rs.) of 100 shops are distributed as follows:
| Profits per shop: | 0-50 | 50-100 | 100-50 | 150-200 | 200-250 | 250-300 |
| No. of shops: | 12 | 18 | 27 | 20 | 17 | 6 |
| Profits per shop | Class Marks | Number of shops |
| $$0-50$$ | $$25$$ | $$12$$ |
| $$50-100$$ | $$75$$ | $$18$$ |
| $$100-150$$ | $$125$$ | $$27$$ |
| $$150-200$$ | $$175$$ | $$20$$ |
| $$200-250$$ | $$225$$ | $$17$$ |
| $$250-300$$ | $$275$$ | $$6$$ |
The monthly wages of $$30$$ workers in a factory are given below:
$$830, 835, 890, 810, 835,836, 869, 845, 898, 890,$$$$820, 860, 832, 833, 855, 845, 804, 808, 812,840,$$
$$885, 835, 836, 878, 840, 868, 890, 806, 840, 890$$.
Represent the data in the form of a frequency distribution with class size $$10$$.
Represent the data in the form of a frequency distribution with class size $$10$$.
Define the following terms :
Class limits
Define the following terms :
Class size
The daily minimum temperatures in degrees Celsius recorded in a certain Arctic region are as follows:
$$-12.5,-10.8,-18.6,-8.4,-10.8,-4.2,-4.8,-6.7,-13.2,-11.8,-2.3,1.2,2.6,0,2.4,0,3.2,2.7,$$$$3.4,0,-2.4,-2.4,0,3.2,2.7,3.4,0,-2.4,-5.8,-8.9,-14.6,-12.3,-11.5,-7.8,-2.9.$$
Represent them as frequency distribution table taking $$-19.9$$ to $$-15$$ as the first class interval.
Represent them as frequency distribution table taking $$-19.9$$ to $$-15$$ as the first class interval.
The daily maximum temperatures (in degree celsius) recorded in a certain city during the month of November are as follows:
$$25.8,24.5,25.6,20.7,21.8,20.5,20.6,20.9,22.3,22.7,23.1,22.8,22.9,21.7,21.3,$$$$20.5,20.9,23.1,22.4,21.5,22.7,22.8,22.0,23.9,24.7,22.8,23.8,24.6,23.9,21.1$$
Represent them as a frequency distribution table with class size $$1^{\circ}C$$.
Represent them as a frequency distribution table with class size $$1^{\circ}C$$.
Explain the reading and interpretation of bar graphs.
The heights (in cm) of $$30$$ students of class VIII are given below:
$$155, 158, 154, 158, 160, 148, 149, 150, 153, 159, 161, 148, 157, 153, 157,$$$$ 162, 159, 151, 154, 156, 152, 156, 160, 152, 147, 155, 163, 155, 157, 153$$.Prepare a frequency distribution table with $$160-164$$ as one of the class intervals.
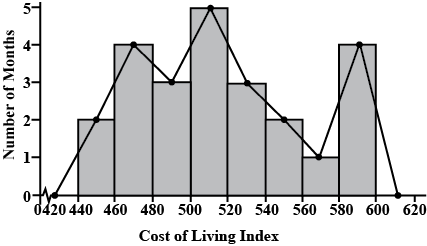
Draw, in the same diagram, a histogram and a frequency polygon to represent the following data which shows the monthly cost of living index of a city in a period of $$2$$ years:
| Cost of living index: | $$440-460$$ | $$460-480$$ | $$480-500$$ | $$500-520$$ | $$520-540$$ | $$540-560$$ | $$560-580$$ | $$580-600$$ |
| No. of months: | $$2$$ | $$4$$ | $$3$$ | $$5$$ | $$3$$ | $$2$$ | $$1$$ | $$4$$ |
Draw a frequency polygon of the following distribution of the students
obtaining marks in Economics.
| Marks | 0-10 | 10-20 | 20-30 | 30-40 | 40-50 | 50-60 |
| Students | 5 | 12 | 15 | 22 | 14 | 4 |

What is the class interval ($$h$$) to calculate median?
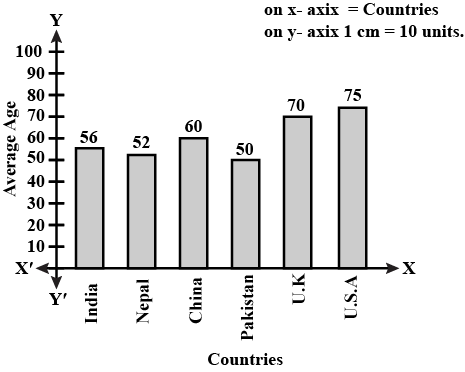
The following data shows the average age of men in various countries in a certain year:
| Country | India | Nepal | China | Pakistan | U.K. | U.S.A. |
| Average age (in years) | 55 | 52 | 60 | 50 | 70 | 75 |
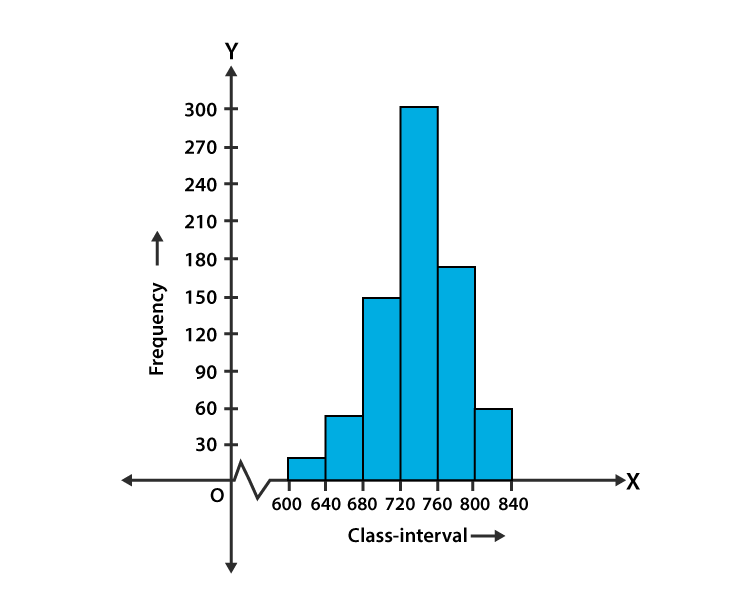
Draw a histogram for the following data:
| Class interval | $$ 600-640 $$ | $$ 640-680 $$ | $$ 680-720 $$ | $$ 720-760 $$ | $$ 760-800 $$ | $$ 800-840 $$ |
| Frequency | $$ 18 $$ | $$ 45 $$ | $$ 153 $$ | $$ 288 $$ | $$ 171 $$ | $$ 63 $$ |
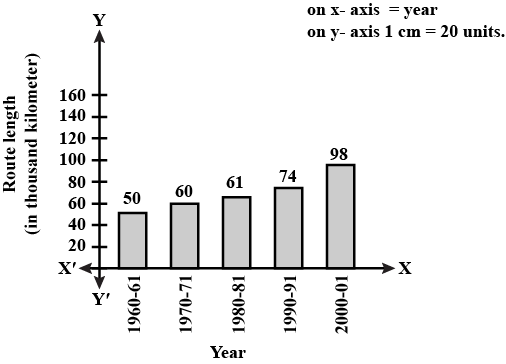
The following table gives the route length (in thousand kilometres) of the Indian Railways in some of the years:
| Year | $$1960-1961$$ | $$1970-1971$$ | $$1980-1981$$ | $$1990-1991$$ | $$2000-2001$$ |
| Route length (in thousand kilometres) | $$56$$ | $$60$$ | $$61$$ | $$74$$ | $$98$$ |
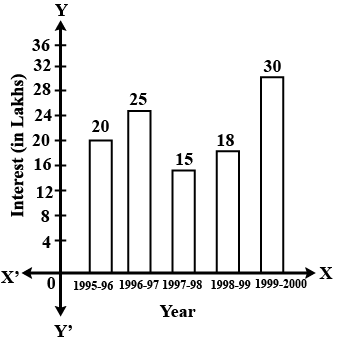
The following table shows the interest paid by a company (in lakhs):
| Year | 1995-96 | 1996-97 | 1997-98 | 1998-99 | 1999-2000 |
| Interest (in lakhs of rupees) | 20 | 25 | 15 | 18 | 30 |
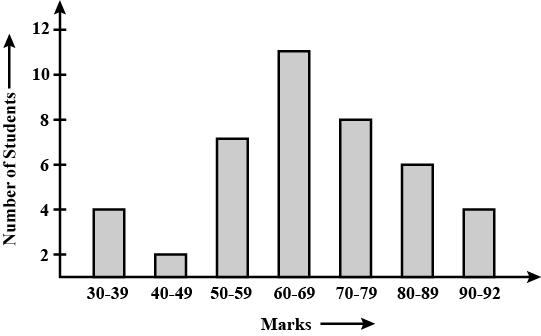
The bar graph given below shows the marks of students of a class in a particular subject:
Study the bar graph and answer the following questions:
(a) If 40 is the pass mark, then how many students have failed?
(b) How many students got marks from 50 to 69?
(c) How many students scored 90 marks and above?
(d) If students who scored marks above 80 are given merits then how many merit holders are there?
(e) What is the strength of the class?
Represent the following data in the form of a frequency distribution:
$$52, 56, 72, 68, 52, 68, 52, 68, 52, 60, 56, 72, 56, 60, 64, 56, 48, 48, 64$$ and $$64$$
Define:
frequency of an observation
The value of $$\pi$$ up to 35 decimal places is given below:
$$14159265358979323846264338327950288$$
Make a frequency distribution of the digits $$0$$ to $$9$$ after the decimal point.
Convert the given frequency distribution into a continuous grouped frequency distribution:
| Class Interval | Frequency |
| 150-153 | 7 |
| 154-157 | 7 |
| 158-161 | 15 |
| 162-165 | 10 |
| 166-169 | 5 |
| 170-173 | 6 |
The scores (out of $$100$$) obtained by $$33$$ students in a mathematics test are as follows:
$$69, 48, 84, 58, 48, 73, 83, 48, 66, 58, 84\\
66, 64, 71, 64, 66, 69, 66, 83, 66, 69, 71\\
81, 71, 73, 69, 66, 66, 64, 58, 64, 69, 69$$
Represent this data in the form of a frequency distribution.
The following are the marks (out of 100) of 60 students in mathematics.16, 13, 5, 80, 86, 7, 51, 48, 24, 56, 70, 19, 61, 17, 16, 36, 34, 42, 34, 35, 72, 55, 75,31, 52, 28,72, 97, 74, 45, 62, 68, 86, 35, 85, 36, 81, 75, 55, 26, 95, 31, 7, 78, 92, 62,52, 56, 15, 63,25, 36, 54, 44, 47, 27, 72, 17, 4,Construct a grouped frequency distribution table with width 10 of each class starting from 0 - 9.
The table shows a frequency distribution of the life time of $$400$$ radio tubes tested at a company.
| Life time (hours) | Number of tubes | Life time (hours) | Number of tubes |
| $$300-399$$ | $$14$$ | $$800-899$$ | $$62$$ |
| $$400-499$$ | $$46$$ | $$900-999$$ | $$48$$ |
| $$500-599$$ | $$58$$ | $$1000-1099$$ | $$22$$ |
| $$600-699$$ | $$76$$ | $$1100-1199$$ | $$6$$ |
| $$700-799$$ | $$68$$ | ||
| Total $$400$$ |
The weekly wages (in Rs) of $$30$$ workers in a factory are:
$$830, 835, 890, 810, 835, 836, 869, 845, 898, 890, 820, 860, 832, 833, 855,$$ $$845, 804, 808, 812, 840, 885, 835, 835, 836, 878, 840, 868, 890, 806, 840$$
What is the frequency of $$830-840$$ interval?
What is the frequency of $$830-840$$ interval?
The marks of $$30$$ students of a class, obtained in a test (out of $$75$$), are given below:
$$42, 21, 50, 37, 42, 37, 38, 42, 49, 52, 38, 53, 57, 47, 29$$
$$59, 61, 33, 17, 17, 39, 44, 42, 39, 14, 7, 27, 19, 54, 51$$.
Form a frequency table with equal class intervals.
Calculate the range from the following data.
| Marks | $$26$$ | $$38$$ | $$54$$ | $$65$$ | $$72$$ | $$88$$ |
| No. of students | $$5$$ | $$10$$ | $$15$$ | $$20$$ | $$25$$ | $$30$$ |
The following are the marks (out of 100) of 60 students in mathematics.
16, 13, 5, 80, 86, 7, 51, 48, 24, 56, 70, 19, 61, 17, 16, 36, 34, 42, 34, 35, 72, 55, 75, 31, 52, 28, 72, 97, 74, 45, 62, 68, 86, 35, 85, 36, 81, 75, 55, 26, 95, 31, 7, 78, 92, 62, 52, 56, 15, 63, 25, 36, 54, 44, 47, 27, 72, 17, 4, 30. Construct a grouped frequency distribution table with width 10 of each class, in such a way that one of the classes is $$10 - 20$$ (20 not included).
Given below are the marks obtained by $$30$$ students in an examination:
| $$08$$ | $$17$$ | $$33$$ | $$41$$ | $$47$$ | $$23$$ | $$20$$ | $$34$$ |
| $$09$$ | $$18$$ | $$42$$ | $$14$$ | $$30$$ | $$19$$ | $$29$$ | $$11$$ |
| $$36$$ | $$48$$ | $$40$$ | $$24$$ | $$22$$ | $$02$$ | $$16$$ | $$21$$ |
| $$15$$ | $$32$$ | $$47$$ | $$44$$ | $$33$$ | $$01$$ |
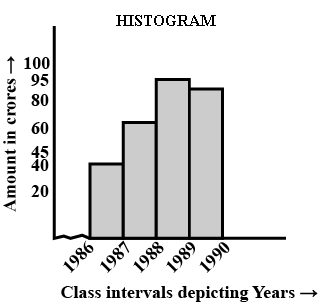
The following figures represent the amount of money spent in various years , Represent them with a suitable diagram .
| Years | $$1986-87$$ | $$1987-88$$ | $$1988-89$$ | $$1989-90$$ |
| Amount ( in crores ) | $$45$$ | $$70$$ | $$95$$ | $$90$$ |
Define raw data.
A TV channel organized a SMs (Short Message Service) poll on prohibition on smoking, giving options like A- complete prohibition, B- prohibition in public places only, C- not necessary. SMS results in one hour were $$A\ B\ A\ B\ C\ B\ A\ B\ B\ A\ C\ C\ B\ B\ A\ B\ B\ A\ B\ C\ B\ A\ B\ C\ B\ A\ B\ B\ A\ B\ B\ C\ B\ A\ B\ A\ B\ C\ B\ B\ A\ B\ C\ B\ B\ A\ B\ B\ A\ B\ B\ A\ B\ C\ B\ A\ B\ B\ A\ B\ C\ A\ B\ B\ A$$
Represent the above data as grouped frequency distribution table. How many appropriate answers were received? What was the majority of people's opinion?
Convert data into grouped frequency distribution:
$$3, 5, 1, 2, 3, 2, 2, 1, 6, 9, 5, 3, 9, 2 $$
Convert the following data into grouped frequency table:
$$12, 1, 2 , 3, 4, 4, 4, 5, 6, 3, 2, 1, 12, 4, 6, 7, 7, 4$$
Consider the following marks (out of $$50$$) scored in mathematics by $$50$$ students of $$8th$$ class:
$$41, 31, 33, 32, 28, 31, 21, 10, 30, 22,33, 37, 12,05, 08, 15, 39, 26, 41, 46, 34, 22, 09$$.
$$11, 16, 22, 25, 29, 31, 39, 23, 31, 21, 45, 47, 30, 22, 17, 36, 18, 20, 22, 44, 16, 24, 10, 27, 39, 28, 17$$.
Prepare a frequency distribution table
Forty candidates from $$10th$$ class of a school appear for a test. The number of questions (out of $$60$$) attempted by them in forty five minutes is given here.
$$52, 42, 40, 36, 12, 28, 15, 37, 35, 22, 39, 50, 54, 39, 21, 34, 46, 31, 10, 09$$,
$$13, 24, 29, 31, 49, 58, 40, 44, 37, 28, 13, 16, 29, 36, 39, 41, 47, 55, 52, 09$$.
Prepare a frequency distribution table with the class size $$10$$ and answer the following:
(i) Which class has the highest frequency?
(ii) Which class has the lowest frequency?
(iii) Write the upper and lower limits of the class $$(20 - 29)$$.
(iv) Which two classes have the same frequency?
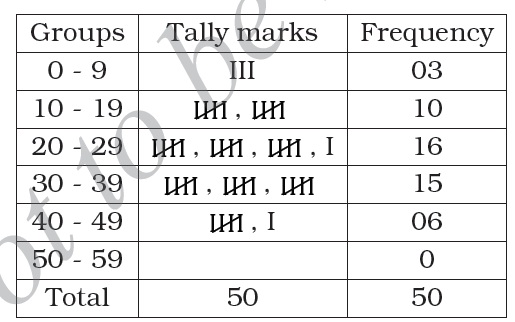
Using this table, we can observe:
(i) $$(30-39)$$ has the highest frequency i.e. $$11$$;
(ii) $$(0-9)$$ has the lowest frequency i.e. $$2$$;
(iii) upper limit is $$29.5$$ and lower limit is $$19.5$$ of the class $$(20-29)$$;
(iv) $$(10-19)$$ and $$(50-59)$$ have the same frequency.
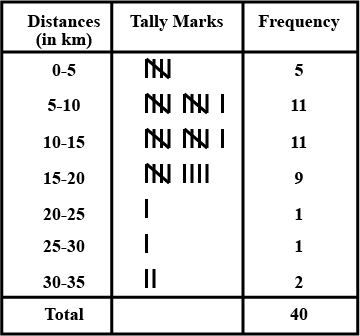
The distance (in km) of 40 engineers from their residence to their place of work were found as follows:
$$\begin{matrix} 5 & 3 & 10 & 20 & 25 & 11 & 13 & 7 & 12 & 31 \\ 19 & 10 & 12 & 17 & 18 & 11 & 32 & 17 & 16 & 2 \\ 7 & 9 & 7 & 8 & 3 & 5 & 12 & 15 & 18 & 3 \\ 12 & 14 & 2 & 9 & 6 & 15 & 15 & 7 & 6 & 12 \end{matrix}$$
Construct a grouped frequency distribution table with class size 5 for the data given above taking the first interval as $$0-5$$ (5 not included). What main features do you observe from this tabular representation?
Construct a grouped frequency distribution table with class size 5 for the data given above taking the first interval as $$0-5$$ (5 not included). What main features do you observe from this tabular representation?
Classify the following data as primary or secondary data.(1) Number of trains that passes through Thane railway station.
(2) Number of Barbie dolls available in different Barbie stores in Mumbai.
(3) Number of foodies visit the zomato website.
(4) Number of people visit in a museum during summer.
(5) Number of musicians in Mumbai city who knows both guitar and drum.
(2) Number of Barbie dolls available in different Barbie stores in Mumbai.
(3) Number of foodies visit the zomato website.
(4) Number of people visit in a museum during summer.
(5) Number of musicians in Mumbai city who knows both guitar and drum.
Find the upper limit of class $$50-55$$
Given below are the marks of students in a less than cumulative frequency distribution table. Write the frequencies of the respective classes. Also write the Greater than cumulative frequencies. How many students marks are given in the table?
| Class Interval (Marks) | $$1 - 10$$ | $$11 - 20$$ | $$21 - 30$$ | $$31 - 40$$ | $$41 - 50$$ |
| L.C.F. (No of students) | $$12$$ | $$27$$ | $$54$$ | $$67$$ | $$75$$ |
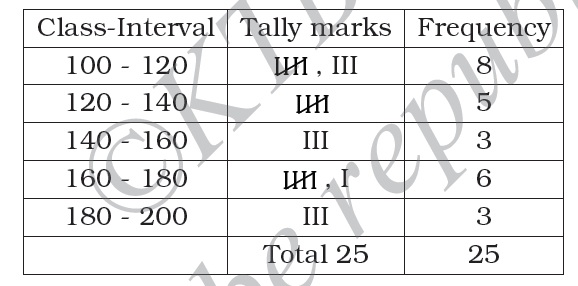
The heights of $$25$$ children in centimetre are given below:
$$174, 168, 110, 142, 156, 119, 110, 101, 190, 102, 190, 111, 172, 140,$$$$136, 174, 128, 124, 136, 147, 168, 192, 101, 129, 114$$.
Prepare a frequency distribution table, taking the size of the class interval
as $$20$$, and answer the following:
(i) Mention the class intervals of highest and lowest frequency.
(ii) What does the frequency $$6$$ corresponding to class interval $$(160-180)$$ indicate?
(iii) Find out the class mark (or midpoint) of $$(140-160)$$.
(iv) What is the range of heights?
Answers:
(i) Highest frequency: $$(100-120)$$; lowest frequency: $$(140-160)$$. and $$(180-200)$$.
(ii) There are $$6$$ children whose heights are in the range $$160 cm$$ to $$180 cm$$.
(iii) $$\text{Class mark} = \dfrac{140+160}{2} = 150$$
(iv) $$\text{Range = highest score - lowest score} \\\ \ \ \ \ \ = 192 -101 \\\ \ \ \ \ \ = 91$$
Calculate the range from the following data.
Marks $$0-5$$ $$5-10$$ $$10-15$$ $$15-20$$ $$20-25$$ No. of students $$5$$ $$12$$ $$23$$ $$8$$ $$2$$
| Marks | $$0-5$$ | $$5-10$$ | $$10-15$$ | $$15-20$$ | $$20-25$$ |
| No. of students | $$5$$ | $$12$$ | $$23$$ | $$8$$ | $$2$$ |
The electricity bills (in rupees) of $$25$$ houses in a locality are given below. Construct a grouped frequency distribution table with a class size of $$75$$.
$$170, 212, 252, 224, 310, 712, 412, 425, 322, 325, 192, 198, 230, 320, 412, 530, 602, 724, 370, 402, 317, 403, 405, 372, 413$$
Draw the histogram for the following frequency distribution.
| Class-Interval | Frequency |
| $$0 - 5$$ | $$5$$ |
| $$5 - 10$$ | $$8$$ |
| $$10 - 15$$ | $$15$$ |
| $$15 - 20$$ | $$4$$ |
| $$20 - 25$$ | $$10$$ |
Write the upper limit and the lower limit of the class $$21 - 25$$.
Find the class mark of the class $$35-39$$.
Find the class mark of the classes $$20 - 30$$ and $$30 - 40$$
Write the lower class limit of class $$20-30$$.
Write the class-size in each of the following :
$$10-19,20-29,30-39$$
Write the class size and class limits in each of the following:.
$$104,114,124,134,144,154$$ and $$164$$
The marks of $$30$$ student of a class, obtained in a test (out of $$75$$), are given below:
$$4,21,50,37,68,42,37,38,42,49,52,38,53,57,47,29,64,
29,63,33,17,17,39,44,42,7,27,19,54,51$$
Form a frequency table with equal class intervals.
Write the class-size in each of the following :
i) $$0-4,5-9,10-14$$
Is it true to say that class-mark of a class interval is $$1/2(lower+Upper limit)?$$
The following table gives the weekly wages (in Rs.) of workers in a factory:
| Weekly wages (in Rs.) | $$50-55$$ | $$55-60$$ | $$60-65$$ | $$65-70$$ | $$70-75$$ | $$75-80$$ | $$80-85$$ | $$85-90$$ |
| No. of workers | $$5$$ | $$20$$ | $$10$$ | $$10$$ | $$9$$ | $$6$$ | $$12$$ | $$8$$ |
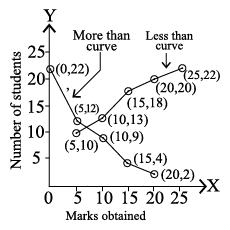
construct a L.C.F and G.C.F. curve for the following data.
| Marks obtained | 0-5 | 5-10 | 10-15 | 15-20 | 20-25 |
| No. of students | 10 | 3 | 5 | 2 | 2 |
| $$Marks\,obtained$$ | $$No.\,of\,students$$ $$(G.C.F.)$$ |
| More than $$0$$ | $$22$$ |
| More than $$5$$ | $$12$$ |
| More than $$10$$ | $$9$$ |
| More than $$15$$ | $$4$$ |
| More than $$20$$ | $$2$$ |
| $$Marks\,obtained$$ | $$No.\,of\,students$$ $$(L.C.F)$$ |
| Less than $$5$$ | $$10$$ |
| Less than $$10$$ | $$13$$ |
| Less than $$15$$ | $$18$$ |
| Less than $$20$$ | $$20$$ |
| Less than $$25$$ | $$22$$ |
There are following the weights of $$30$$ students of class $$10$$ of a secondary school:
$$34,\ 34,\ 36,\ 37,\ 38,\ 33,\ 34,\ 35,\ 36,\ 37,\ 38,\ 33,\ 34,\ 35,\ 34,\ 33$$,$$\ 35,\ 34,\ 38,\ 36,\ 35,\ 34,\ 35,\ 37,\ 38,\ 34,\ 35,\ 35,\ 37$$
Represent the above data in the form of a frequency distribution table.
Represent the above data in the form of a frequency distribution table.
Write the class-size in each of the following :
$$100-120,120-140,160-180$$
Give the formula for class marks and class size of a data
Define primary and secondary data.
Write the class-size in each of the following :
$$5-5.01,5.01-5.02,5.02-5.03$$
The mid-value of a class interval isIf the class-size is 10, find the upper and lower limits of the class.
Write the class-size in each of the following :
$$0-0.25,0.25-0.50,0.50-0.75$$
Read the given instruction and answer the following questions:$$\left(i\right)$$ What information is depicted in the histogram?$$\left(ii\right)$$ There is a 'kink' before the class interval $$125-130$$ on the horizontal axis.What does it mean?
Find the class mark of $$80-90$$
From the data given below find the mean .
| Age in years | Frequency |
| $$0-5$$ | $$3$$ |
| $$6-10$$ | $$4$$ |
| $$11-15$$ | $$5$$ |
| $$16-20$$ | $$8$$ |
The two consecutive class marks of a distribution are $$52$$ and $$57$$ . Find the class limit of the two intervals.
Arrange the following data in ascending order and prepare the frequency table:
$$9,4,3,1,7,10,4,3,3,4,9,8,1,6,3,7,9,1,8,10$$
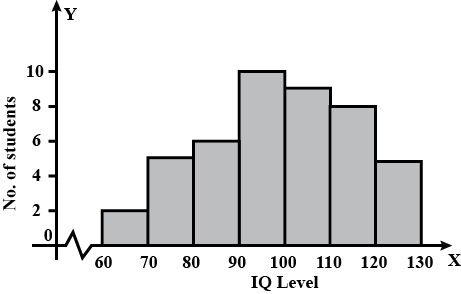
The following table gives the distribution of $$45$$ students across the different levels of intelligent quotient. Draw the histogram for the data.
IQ Level 60-70 70-80 80-90 90-100 100-110 110-120 120-130 No. of Students 2 5 6 10 9 8 5
| IQ Level | 60-70 | 70-80 | 80-90 | 90-100 | 100-110 | 110-120 | 120-130 |
| No. of Students | 2 | 5 | 6 | 10 | 9 | 8 | 5 |
Construct a frequency distribution table for the data on the weights (in kg) of $$20$$ students of a class using intervals $$30 - 35, 35 - 40$$ ans so on____
$$40, 38, 33, 48, 60, 53, 31, 46, 34, 36, 49, 41, 55, 49, 65, 42, 44, 47, 38, 39$$.
The following is the distribution of weights (in kg) of $$52$$ persons:
| Weight (in kg) | persons |
| $$30-40$$ | 10 |
| $$40-50$$ | 15 |
| $$50-60$$ | 17 |
| $$60-70$$ | 6 |
| $$70-80$$ | 4 |
The following bar graph shows the number of children, in various classes, in a school in Delhi.
Using the given bar graph, find:
the total number of children from Class $$1$$ to Class $$8$$

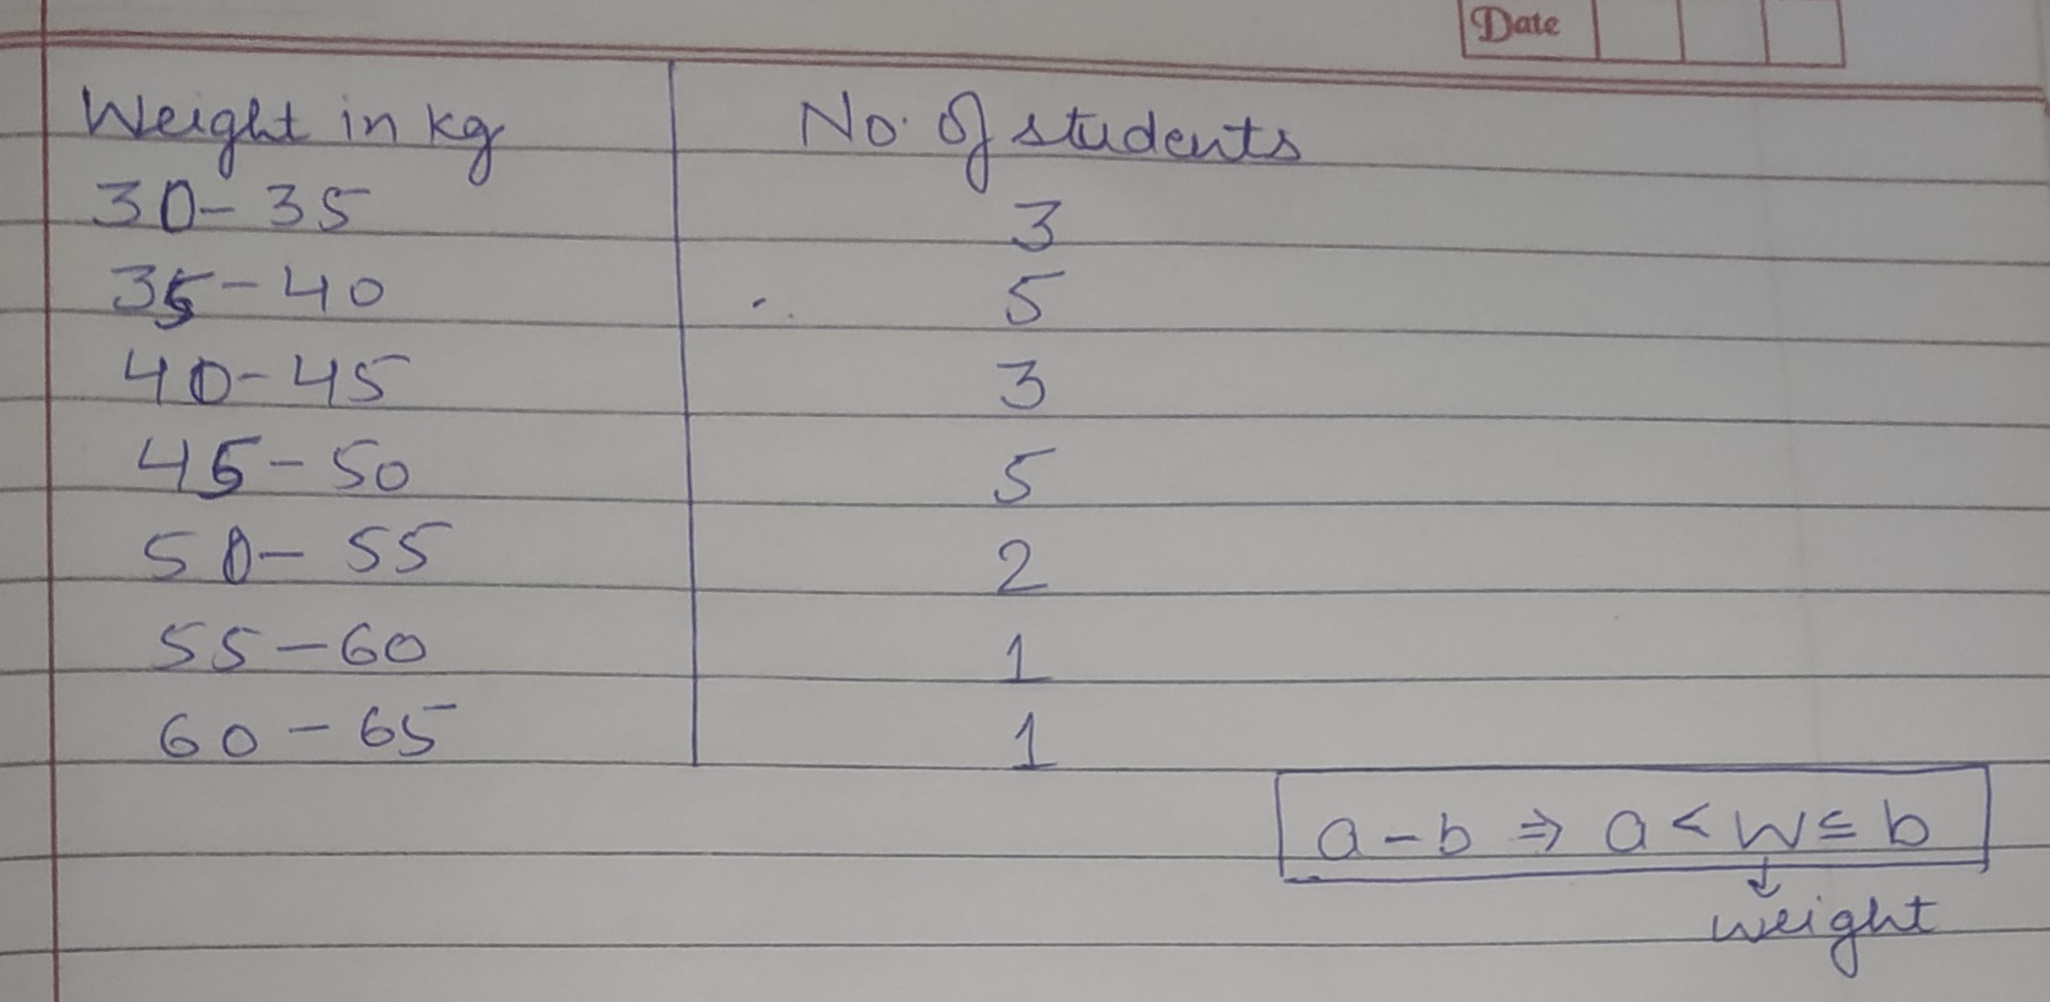
What is the class size for the given data?
| Marks | Number of student |
| $$30-35$$ | $$5$$ |
| $$35-40$$ | $$8$$ |
| $$40-45$$ | $$15$$ |
| $$45-50$$ | $$20$$ |
| $$50-55$$ | $$5$$ |
| $$55-60$$ | $$4$$ |
| $$60-65$$ | $$4$$ |
| $$65-70$$ | $$2$$ |
| $$70-75$$ | $$3$$ |
If the mean of the following distribution is $$6$$, find the value of $$p$$
| $$X$$ | $$2$$ | $$4$$ | $$6$$ | $$10$$ | $$P+5$$ |
| $$f$$ | $$3$$ | $$2$$ | $$3$$ | $$1$$ | $$2$$ |
The weights of new born babies (in kg) in a hospital on a particular day are as follows:$$2.3, 2.2, 2.1, 2.7, 2.6, 3.0, 2.5, 2.9, 2.8, 3.1, 2.5, 2.8, 2.7, 2.9, 2.4$$How many babies weigh below $$2.5 kg$$ ?
Consider the following frequency distribution.
| Class | $$0-5$$ | $$6-11$$ | $$12-17$$ | $$18-23$$ | $$24-29$$ |
| Frequency | $$13$$ | $$10$$ | $$18$$ | $$8$$ | $$11$$ |
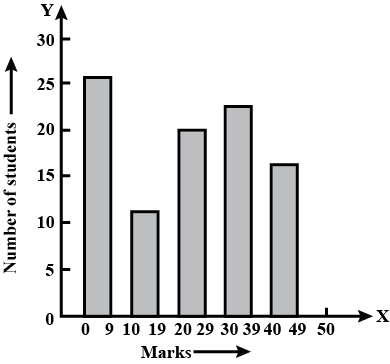
Given above is the bar graph indicating the marks obtained out of $$50$$ in mathematics paper by $$100$$ students. Read the bar and answer the following questions:
What is the number of students belonging to the highest mark group?
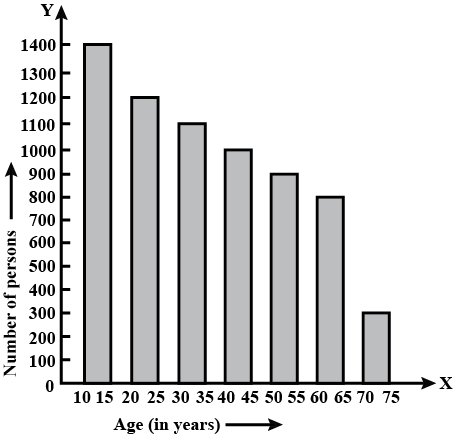
Study the bar graph representing the number of persons in various age groups in a town shown. Observe the bar graph and answer the following questions:
What is the number of persons in the age-group $$60-65$$?

If median of the distribution given is $$28.5$$, find the values of $$x$$ and $$y$$.
| Class | $$0-10$$ | $$10-20$$ | $$20-30$$ | $$30-40$$ | $$40-50$$ | $$50-60$$ | Total |
| Frequency | $$5$$ | $$X$$ | $$20$$ | $$15$$ | $$y$$ | $$5$$ | $$60$$ |
Study the bar graph representing the number of persons in various age groups in a town shown. Observe the bar graph and answer the following questions:
What is the total number of persons living in the town in the age-groups $$50-55$$?
The range of the data $$ 6,8, 16, 22, 8, 20, 7, 25 $$ is _____
In the class interval $$ 26 - 33, 33 $$ is known as_____
In the class interval $$ 20 - 30 $$ the lower class limit is ______
The bar graph given below represents the approximate length (in kilometers) of some National Highways in India. Study the bar graph and answer the following questions:
Length of which National Highway is about three times
the National Highway $$10$$?

Find the class mark of classes $$15.5-18.5$$ and $$50-75.$$
The sixth class interval for a grouped data whose first two class intervals are $$ 10 -15 $$ and $$ 15 -20 $$ is _______
In the class intervals $$ 10 -20 , 20 -30 $$ etc. respectively, $$ 20 $$ lies in the class_______
The difference between the upper and lower limit of a class interval is called the ________ of the class interval.
In a histogram, class intervals and frequencies are taken along ______ axis and ______ axis.
The arithmetic mean of the following frequency distribution is $$53$$. Find the value of p:
| Class | 0-20 | 20-40 | 40-60 | 60-80 | 80-100 |
| Frequency | 12 | 15 | 32 | p | 13 |
The mean of the following frequency distribution is $$62.8$$ and the sum of all frequency is $$50$$. Compute the missing frequency $$f_{ 1}$$ and $$f_{ 2 }$$ :
| Class | 0-20 | 20-40 | 40-60 | 60-80 | 80-100 | 100-120 | Total |
| Frequency | 5 | $$f_{ 1 }$$ | 10 | $$f_{ 2 }$$ | 7 | 8 | 50 |
The mean of the following frequency distribution is $$62.8$$. Find the missing frequency x:
| Class | 0-20 | 20-40 | 40-60 | 60-80 | 80-100 | 100-120 |
| Frequency | 5 | 8 | x | 12 | 7 | 8 |
Marks scored by $$30$$ students of class $$VI$$ are as given below:
$$38, 46, 33, 45, 63, 53, 40, 85, 52, 75, 60, 73, 62, 22, 69, 43, 45, 33, 47, 41, 29, 43, 37, 49, 83, 44, 55, 22, 35$$ and $$45$$.
State:
the range of marks
The class size of the class interval $$ 60 -68 $$ is $$8 $$.
If the mean of the following distribution is $$5$$. Find the value of $$f_{ 1 }$$:
| Class | 0-20 | 20-40 | 40-60 | 60-80 | 80-100 |
| Frequency | 17 | 28 | 32 | $$f_{ 1 }$$ | 19 |
Fill in the blanks:
The class mark of class interval $$22-29$$ is.......
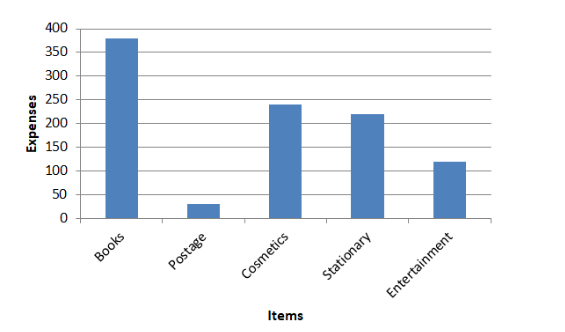
A student spends his pocket money on various items, as given below:
Books: $$Rs. 380$$, Postage: $$Rs. 30$$, Toilet items: $$Rs. 240$$,
Stationary: $$Rs. 220$$ and Entertainment : $$Rs. 120$$
Draw a bar graph to represent his expenses.
The required bar graph of the given data will be as shown below:
Here scale = Rs.50
on $$x-axis$$: Items
on $$y-axis$$: Expenses (in Rs).
The following bar graph shows the number of children, in various classes, in a school in Delhi.
Using the given bar graph, find:
the total number of children from class $$6$$ to Class $$8$$

The following bar graph shows the number of children, in various classes, in a school in Delhi.
Using the given bar graph, find:
the total number of children in each class.

Using the data, given below, construct a frequency distribution table:
$$46, 44, 42, 54, 52, 60, 50, 58, 56, 62, 50, 56, 54, 58$$ and $$48$$. Now answer the following:
What is the range of the numbers?
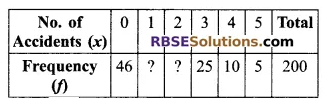
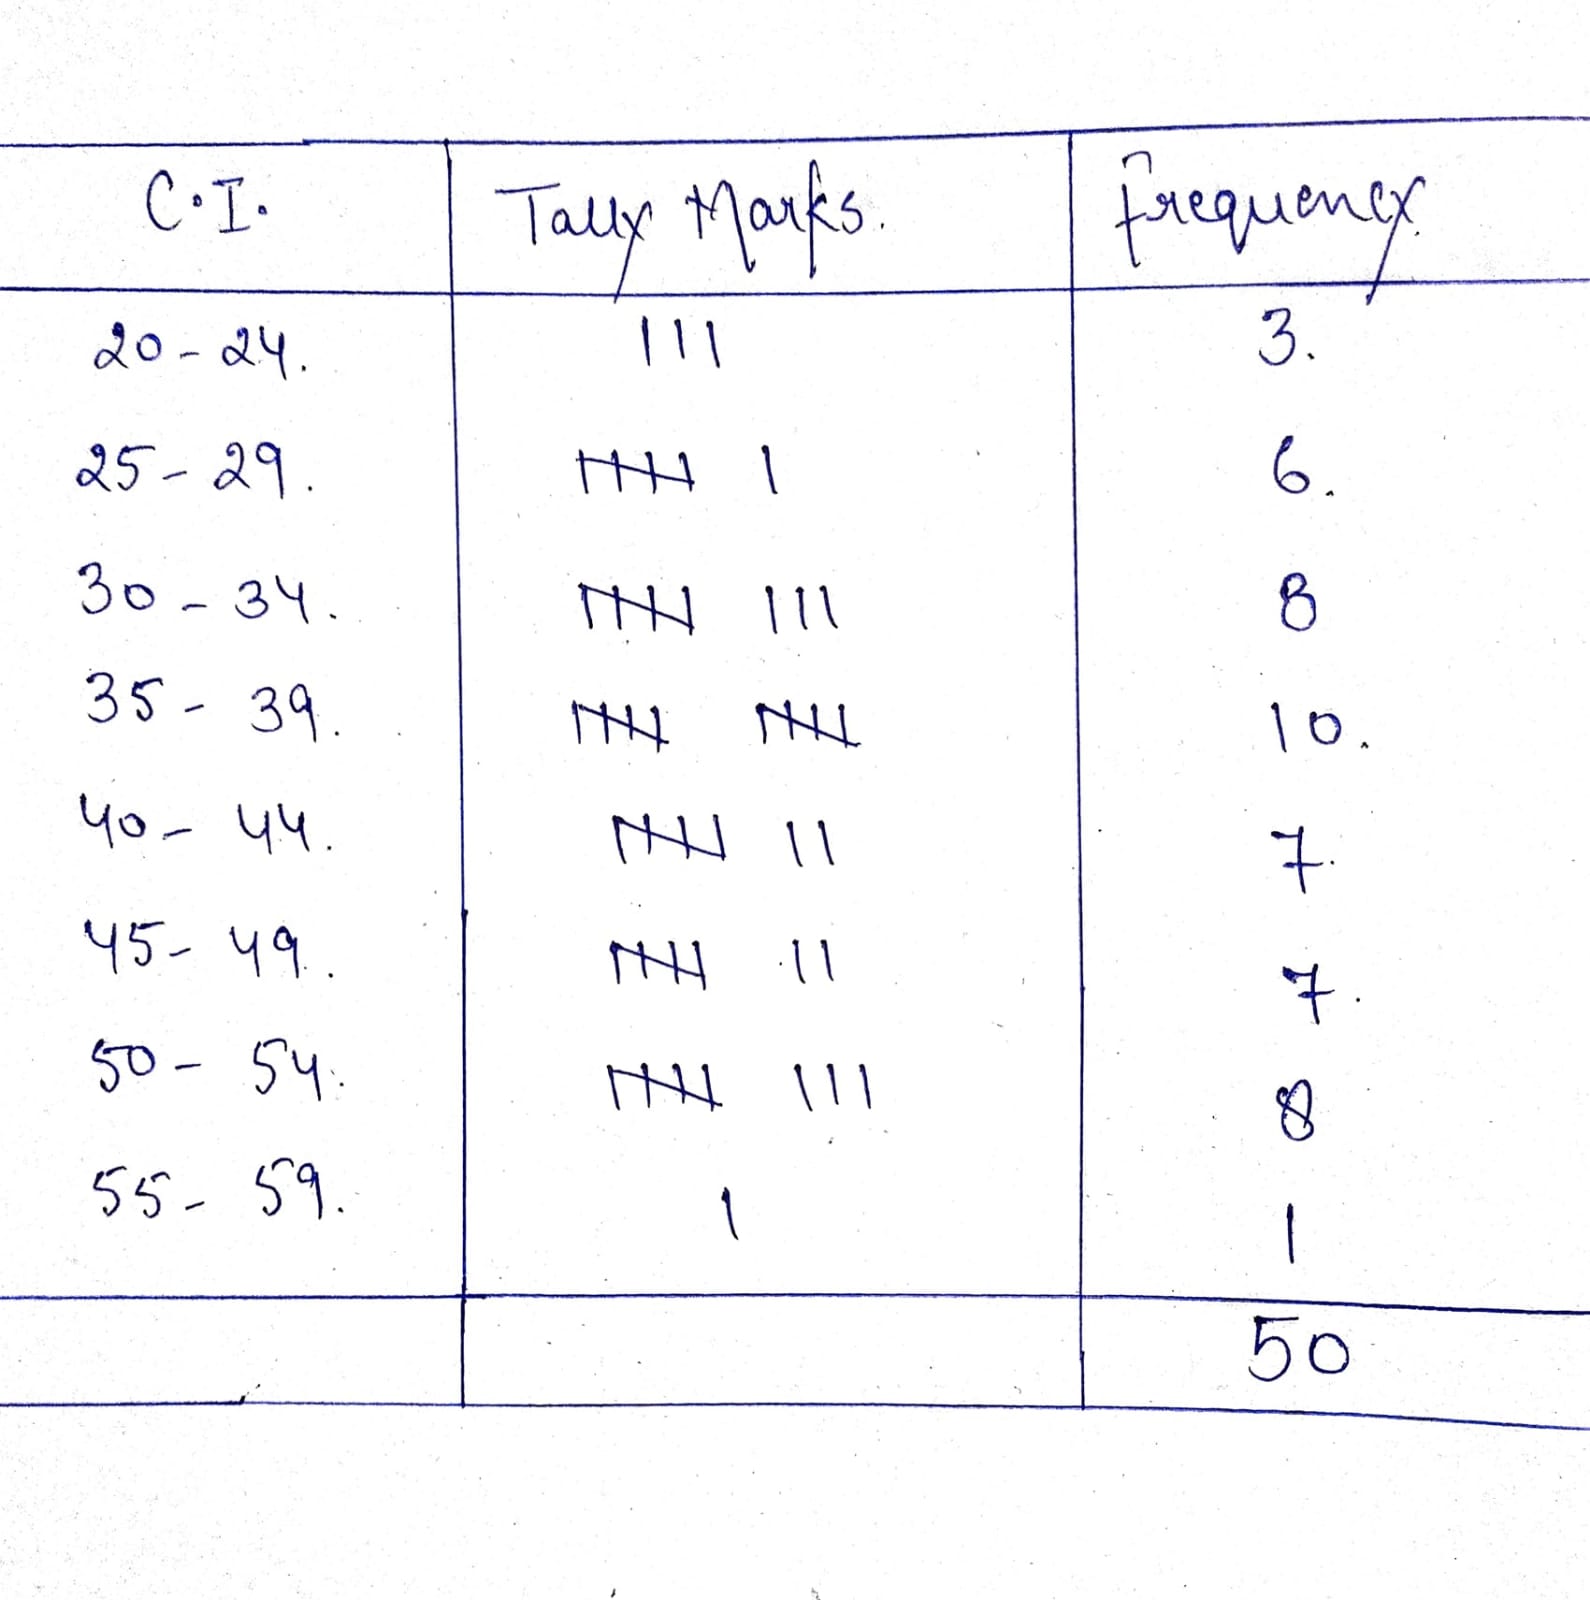
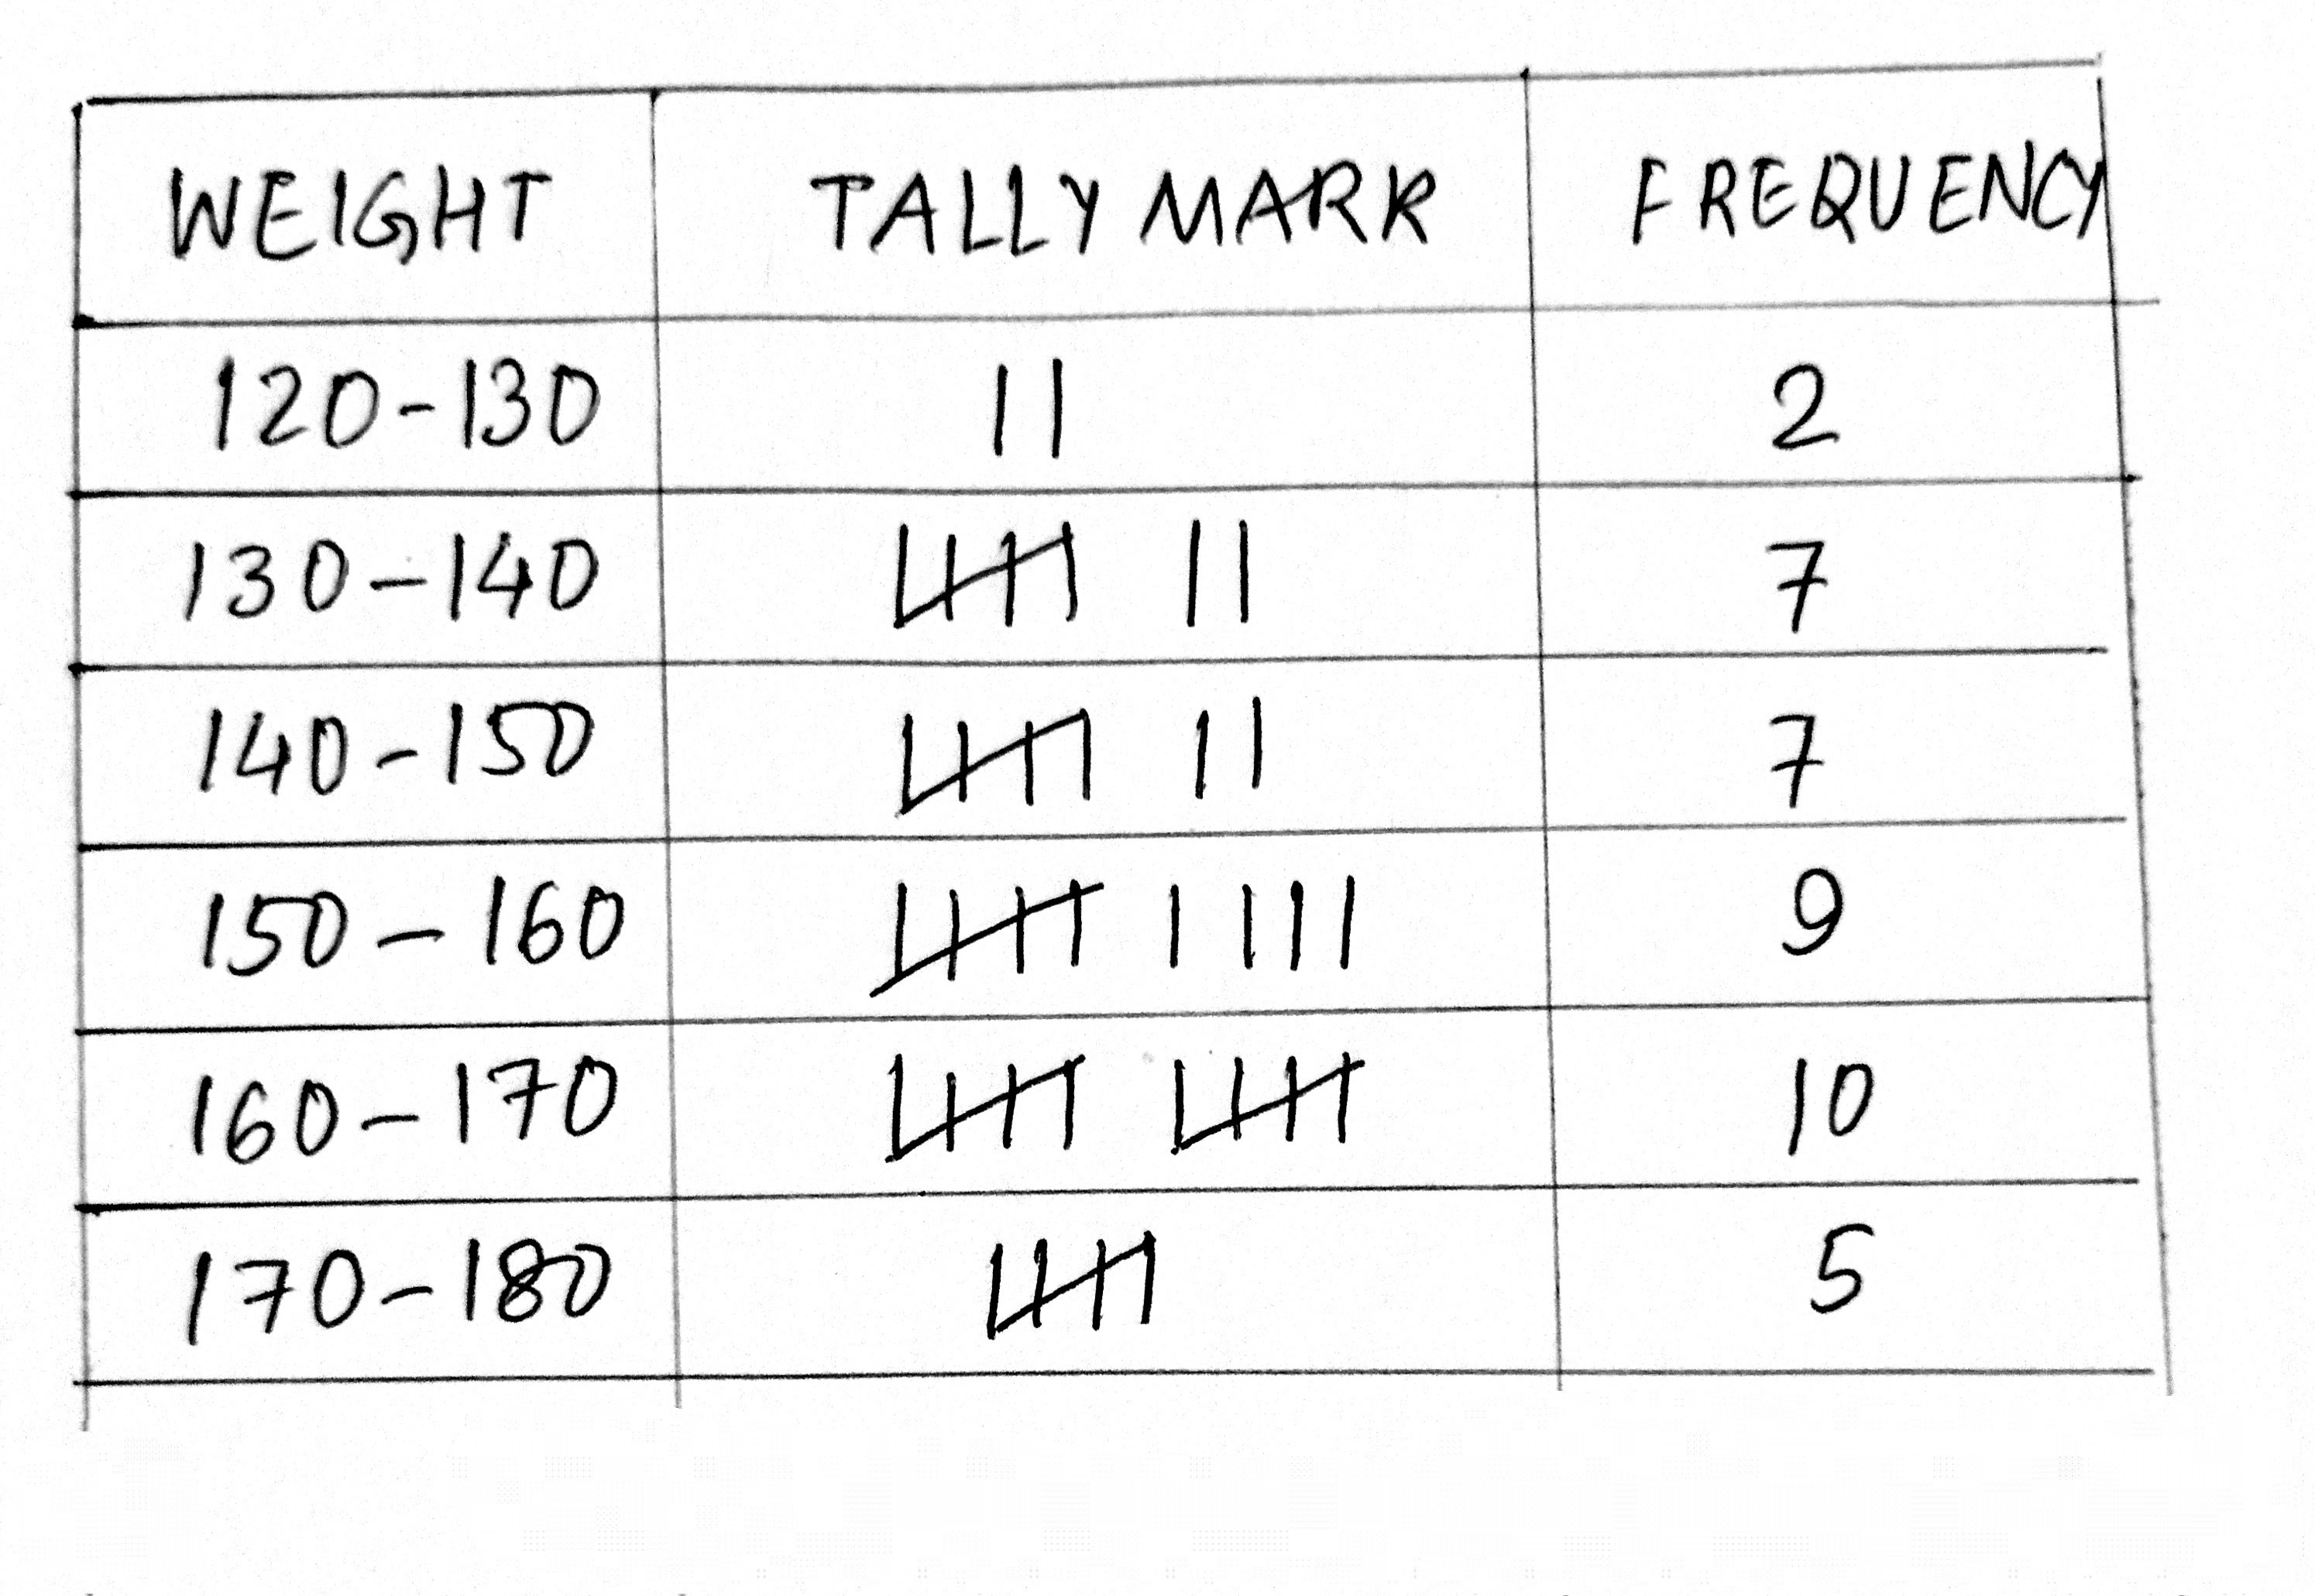
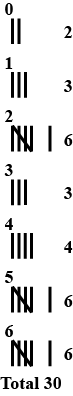
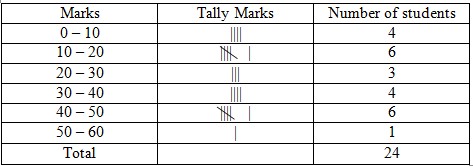
In a study of number of accidents per day, the observations for $$30$$ days were obtained as follows:
$$6\ 3\ 5\ 6\ 4\ 3\ 2\ 5\ 4\ 2$$
$$4\ 0\ 5\ 3\ 6\ 1\ 5\ 5\ 2\ 6$$
$$2\ 1\ 2\ 2\ 0\ 5\ 4\ 6\ 1\ 6$$
Construct a suitable frequency distribution table.
No. of accidents Tally marks Frequency
Given below are the marks obtained by 30 students in an examination :
| 08 | 17 | 33 | 41 | 47 | 23 | 20 | 34 |
| 09 | 18 | 42 | 14 | 30 | 19 | 29 | 11 |
| 36 | 48 | 40 | 24 | 22 | 02 | 16 | 21 |
| 15 | 32 | 47 | 44 | 33 | 01 |
| Class-intervals | $$50-60$$ | $$60-70$$ | $$70-80$$ | $$80-90$$ | $$90-100$$ | $$100-110$$ |
| Frequency | $$30$$ | $$25$$ | $$45$$ | $$15$$ | $$20$$ | $$40$$ |
The marks of $$24$$ candidates in the subject mathematics are given below:
| 45 | 48 | 15 | 23 | 30 | 35 | 40 | 11 |
| 29 | 0 | 3 | 12 | 48 | 50 | 18 | 30 |
| 15 | 30 | 11 | 42 | 23 | 2 | 3 | 44 |
The marks of $$24$$ candidates in the subject mathematics are given below :
| $$45$$ | $$48$$ | $$15$$ | $$23$$ | $$30$$ | $$35$$ | $$40$$ | $$11$$ |
| $$29$$ | $$00$$ | $$03$$ | $$12$$ | $$48$$ | $$50$$ | $$18$$ | $$30$$ |
| $$15$$ | $$30$$ | $$11$$ | $$42$$ | $$23$$ | $$02$$ | $$03$$ | $$44$$ |
The class marks of a distribution are $$2.03$$, $$2.23$$, $$2.43$$, $$2.63$$, $$2.83$$, $$3.03$$ and $$3.23$$ Determine the class size and the class boundaries
Find the number of examinees who have obtained 600 and more than marksEnter 0 if answer is 216, else 1.
Construct
the following table into cumulative frequency table.
| Marks | $$100$$ | $$50$$ | $$60$$ |
| Students | $$4$$ | $$5$$ | $$10$$ |
Convert the following data into grouped frequency distribution:
$$3, 4, 5, 6, 6, 5, 4, 3, 2, 2, 2, 1, 7, 7, 8, 2$$
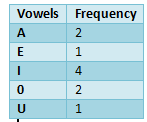
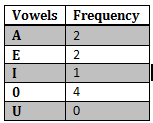
"A bird in hand is worth two in the bush" from this sentence select the vowels for frequency column. Form a ungrouped frequency distribution table.
The number of occurrences of $$a, e, i, o$$ and $$u$$ are $$2, 1, 4, 2$$ and $$1$$
So, the ungrouped frequency is drawn in the table.
The weight of $$30$$ students of a class ($$kg$$) are as given: $$ 43, 45, 64, 42, 54, 78, 91, 90, 56, 37, 48, 90, 50, 48, 67$$$$85, 30, 39, 49, 40, 50, 45, 68, 90, 50, 34, 56, 88, 43, 50$$
Convert the data in the form of grouped data frequency distribution.
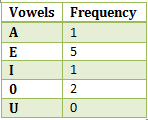
Draw a ungrouped frequency distribution for the vowels used in the given sentence.
"Empty vessels make the most noise"
The number of occurrences of $$a, e, i, o$$ and $$u$$ are $$1, 5, 1, 2$$ and $$0$$.
So, the ungrouped frequency is drawn in the table.
The height of $$20$$ students of a class ($$cm$$) are as given: $$132, 131, 135, 136, 134, 132, 131, 142, 142, 152, 151, 151, 148, 145, 131, 132, 142, 156, 155, 152$$. Arrange the data in the form of table of grouped data frequency distribution.
The following data represent the number of hours of playing per week ($$X$$) for $$25$$ people.
$$3, 4, 6, 1, 2, 6, 6, 4, 3, 1, 3, 6, 7, 8, 1, 5, 8, 9, 5, 9, 4, 3, 7, 1, 7$$.
Picture the following data into ungrouped frequency table.
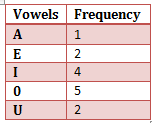
Sketch a ungrouped frequency distribution for the vowels used in the given sentence.
"An ounce of discretion is worth a pound of wit"
The number of occurrences of $$a, e, i, o$$ and $$u$$ are $$1, 2, 4, 5$$ and $$2$$.
So, the ungrouped frequency is drawn in the table.
Form a ungrouped frequency distribution table for the vowels used in the given sentence.
"A rolling stone gathers no moss"
The number of occurrences of $$a, e, i, o$$ and $$u$$ are $$1, 2, 4, 5$$ and $$2$$
So, the ungrouped frequency is drawn in the table.
| Interval | $$10-15$$ | $$15-20$$ | $$20-25$$ | $$25-30$$ | $$30-35$$ |
| $$x$$ | $$2$$ | $$1$$ | $$4$$ | $$6$$ | $$5$$ |
|
X |
Interval |
|
$$10-15$$ |
$$2$$ |
|
$$15-20$$ |
$$1$$ |
|
$$20-25$$ |
$$4$$ |
|
$$25-30$$ |
$$6$$ |
|
$$30-35$$ |
$$5$$ |
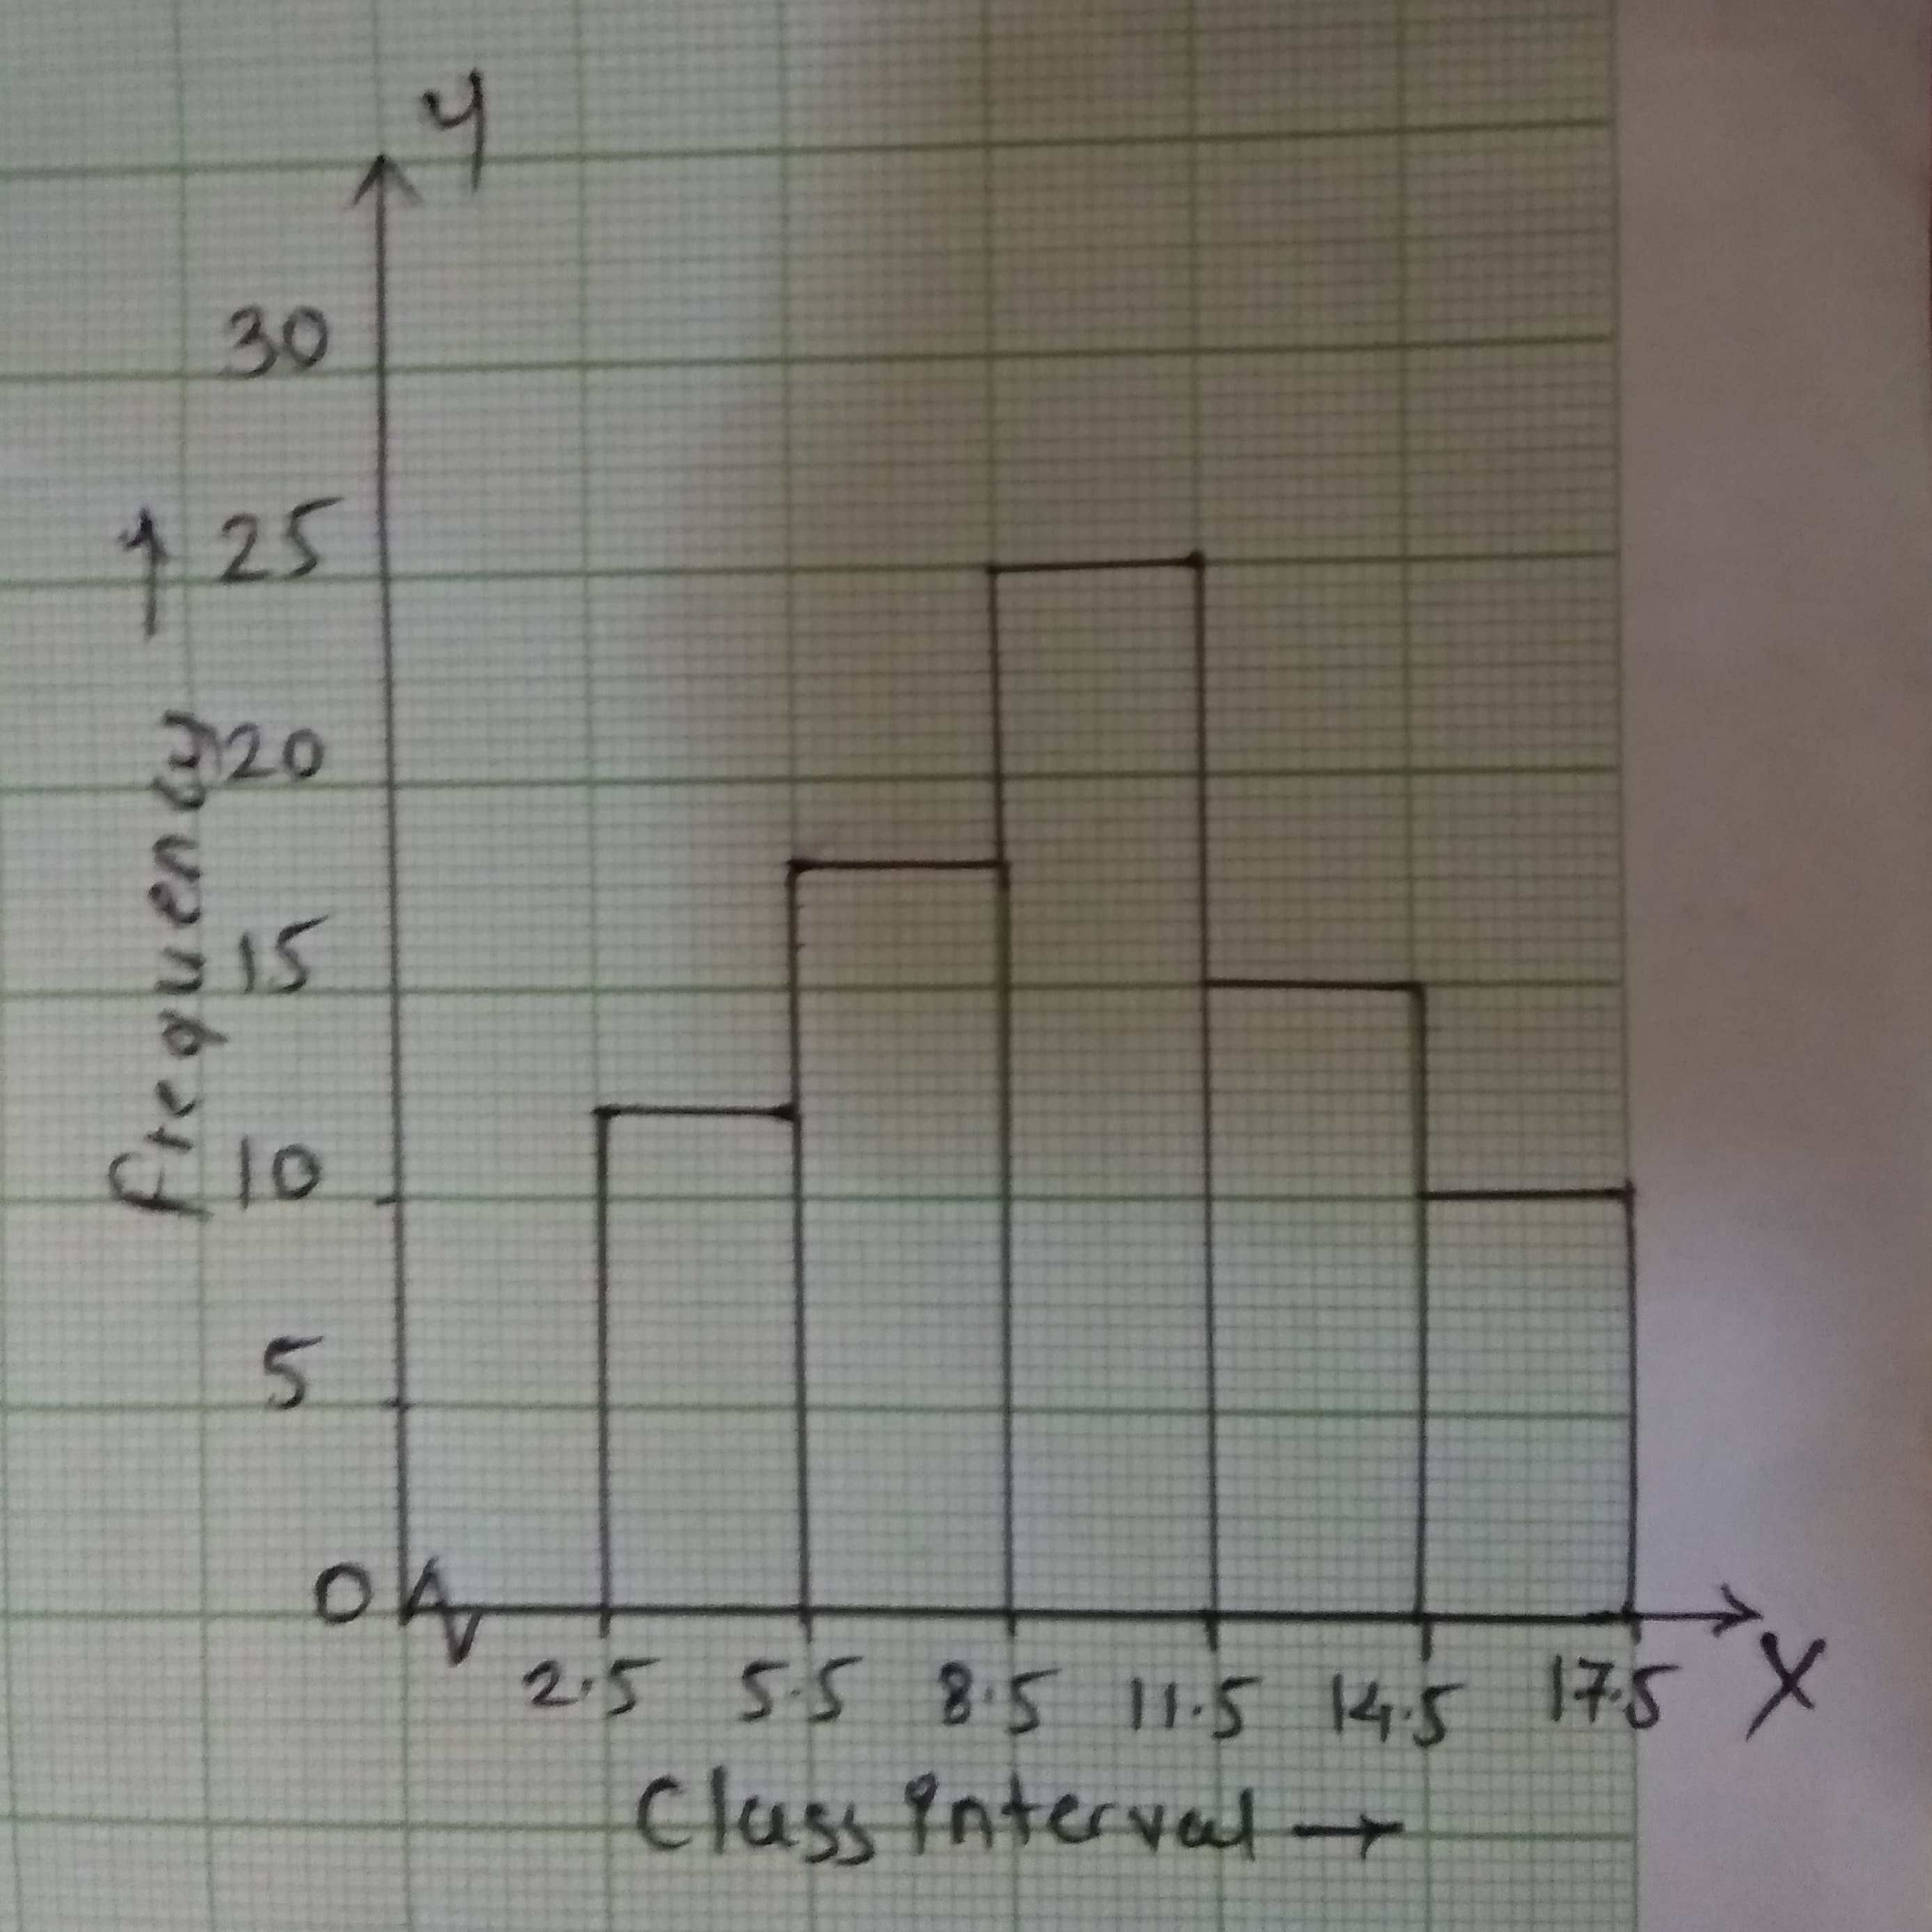
Form a histogram for the following data.
| X | 3-5 | 6-8 | 9-11 | 12-14 | 15-17 |
| frequency | 12 | 18 | 25 | 15 | 10 |
| $$CI$$ | $$Frequency$$ |
| $$2.5-5.5$$ | $$12$$ |
| $$5.5-8.5$$ | $$18$$ |
| $$8.5-11.5$$ | $$25$$ |
| $$11.5-14.5$$ | $$15$$ |
| $$14.5-17.5$$ | $$10$$ |
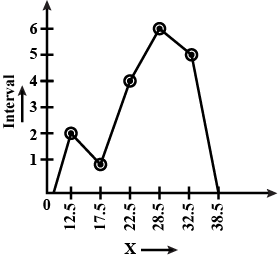
Sketch frequency polygon for the following table:
| $$x$$ | $$1-3$$ | $$3-5$$ | $$5-7$$ | $$7-9$$ | $$9-11$$ | $$11-13$$ |
| frequency | $$2$$ | $$1$$ | $$4$$ | $$2$$ | $$3$$ | $$6$$ |
|
X |
Frequency |
|
|
$$1-3$$ |
$$2$$ |
|
|
$$3-5$$ |
$$1$$ |
|
|
$$5-7$$ |
$$4$$ |
|
|
$$7-9$$ |
$$2$$ |
|
|
$$9-11$$ |
$$3$$ |
|
|
$$11-13$$ |
$$6$$ |
|
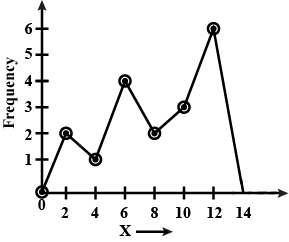
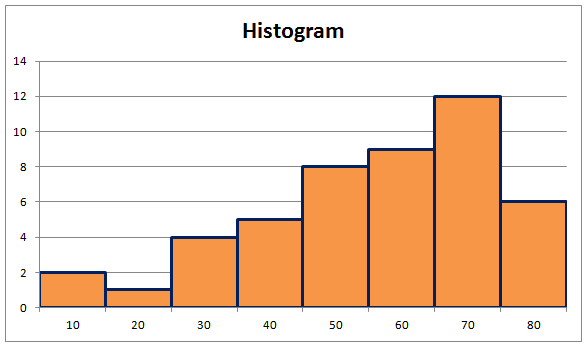
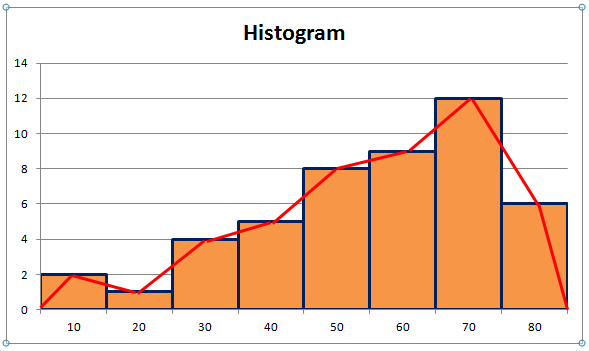
Draw frequency polygon for the following histogram.
The blood groups of 30 students of Class VIII are recorded as follows:
$$A, B, O, O, AB, O, A, O, B, A, O, B, A, O, O,$$
$$A, AB, O, A, A, O, O, AB, B, A, O, B, A, B, O$$.
Represent this data in the form of a frequency distribution table. Which is the most common, and which is the rarest, blood group among these students?
The following table gives the life times of $$400$$ neon lamps:
(i) Represent the given information with the help of a histogram.
(ii) How many lamps have a life time of more than $$700$$ hours?
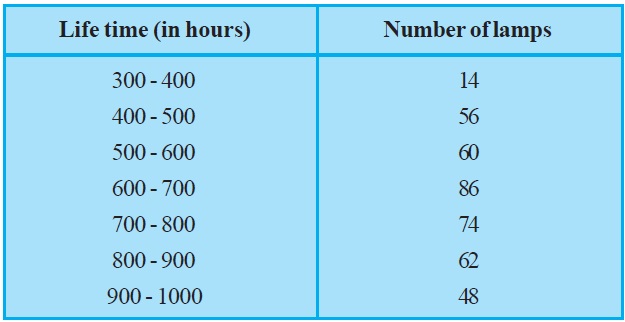
$$\therefore$$ Number of neon lamps $$= 74+62+48 = 184$$

The value of $$\pi$$ upto 50 decimal places is given below:
$$3.14159265358979323846264338327950288419716939937510$$
(i) Make a frequency distribution of the digits from $$0$$ to $$9$$ after the decimal point.
(ii) What are the most and the least frequently occurring digits?
The relative humidity (in %) of a certain city for a month of 30 days was as follows:
$$\begin{matrix} 98.1 & 98.6 & 99.2 & 90.3 & 86.5 & 95.3 & 92.9 & 96.3 & 94.2 & 95.1 \\ 89.2 & 92.3 & 97.1 & 93.5 & 92.7 & 95.1 & 97.2 & 93.3 & 95.2 & 97.3 \\ 96.2 & 92.1 & 84.9 & 90.2 & 95.7 & 98.3 & 97.3 & 96.1 & 92.1 & 89 \end{matrix}$$
(i) Construct a grouped frequency distribution table with classes $$84-86, 86-88$$, etc.
(ii) Which month or season do you think this data is about?
(iii) What is the range of this data?
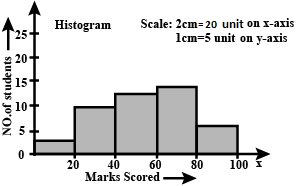
The histogram below represents the scores obtained by $$25$$ students in a Mathematics mental test. Use the data to frame a frequency distribution table.

The following are the daily expeditures (in $$Rs$$) of $$30$$ student in a school.
| Ependiture (in $$Rs$$) | No. of students |
| $$10-15$$ | $$3$$ |
| $$15-20$$ | $$5$$ |
| $$20-25$$ | $$10$$ |
| $$25-30$$ | $$6$$ |
| $$30-35$$ | $$4$$ |
| $$35-40$$ | $$2$$ |
| Total | $$30$$ |
A study was conducted to find out the concentration of sulphur dioxide in the air in parts per million (ppm) of a certain city. The data obtained for 30 days is as follows:
$$\begin{matrix} 0.03 & 0.08 & 0.08 & 0.09 & 0.04 & 0.17 \\ 0.16 & 0.05 & 0.02 & 0.06 & 0.18 & 0.20 \\ 0.11 & 0.08 & 0.12 & 0.13 & 0.22 & 0.07 \\ 0.08 & 0.01 & 0.10 & 0.06 & 0.09 & 0.18 \\ 0.11 & 0.07 & 0.05 & 0.07 & 0.01 & 0.04 \end{matrix}$$
(i) Make a grouped frequency distribution table for this data with class intervals as $$0.00-0.04, 0.04-0.08$$, and so on.
(ii) For how many days, was the concentration of sulphur dioxide more than $$0.11$$ parts per million?
(i) Make a grouped frequency distribution table for this data with class intervals as $$0.00-0.04, 0.04-0.08$$, and so on.
(ii) For how many days, was the concentration of sulphur dioxide more than $$0.11$$ parts per million?
A company manufactures car batteries of a particular type. The lives (in years) of 40 such batteries were recorded as follows:
$$\begin{matrix} 2.6 & 3.0 & 3.7 & 3.2 & 2.2 & 4.1 & 3.5 & 4.5 \\ 3.5 & 2.3 & 3.2 & 3.4 & 3.8 & 3.2 & 4.6 & 3.7 \\ 2.5 & 4.4 & 3.4 & 3.3 & 2.9 & 3.0 & 4.3 & 2.8 \\ 3.5 & 3.2 & 3.9 & 3.2 & 3.2 & 3.1 & 3.7 & 3.4 \\ 4.6 & 3.8 & 3.2 & 2.6 & 3.5 & 4.2 & 2.9 & 3.6 \end{matrix}$$
Construct a grouped frequency distribution table for this data, using class intervals of size $$0.5$$ starting from the interval $$2-2.5$$.
Construct a grouped frequency distribution table for this data, using class intervals of size $$0.5$$ starting from the interval $$2-2.5$$.
Thirty children were asked about the number of hours they watched TV programmes in the previous week. The results were found as follows:
$$\begin{matrix} 1 & 6 & 2 & 3 & 5 & 12 & 5 & 8 & 4 & 8 \\ 10 & 3 & 4 & 12 & 2 & 8 & 15 & 1 & 17 & 6 \\ 3 & 2 & 8 & 5 & 9 & 6 & 8 & 7 & 14 & 12 \end{matrix}$$
(i) Make a grouped frequency distribution table for this data, taking class width $$5$$ and one of the class intervals as $$5-10$$.
(ii) How many children watched television for 15 or more hours a week?
(i) Make a grouped frequency distribution table for this data, taking class width $$5$$ and one of the class intervals as $$5-10$$.
(ii) How many children watched television for 15 or more hours a week?
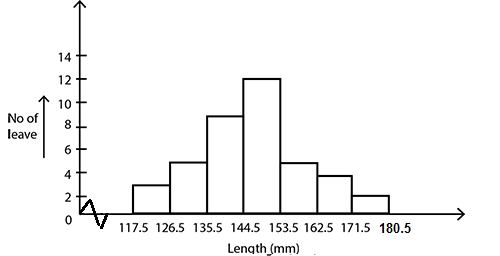
The length of $$40$$leaves of a plant are measured correct to one millimetre, and the obtained data is represented in the following table:
(i) Draw a histogram to represent the given data. [Hint: First make the class intervals continuous]
(ii) Is there any other suitable graphical representation for the same data?
(iii) Is it correct to conclude that the maximum number of leaves are $$153 mm$$ long? Why?
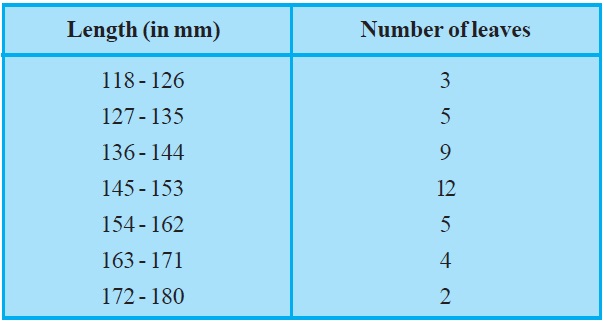
| Length (in mm) | New length (in mm) | No. of leaves |
| 118 - 126 | 117.5 - 126.5 | 3 |
| 127 - 135 | 126.5 - 135.5 | 5 |
| 136 - 144 | 135.5 - 144.5 | 9 |
| 145 - 153 | 144.5 - 153.5 | 12 |
| 154 - 162 | 153.5 - 162.5 | 5 |
| 163 - 171 | 162.5 - 171.5 | 4 |
| 172 - 180 | 171.5 - 180.5 | 2 |
(iii) No. It is a range. The maximum number of leaves lies in between $$144.5 mm - 154.5 mm$$. Not necessary that it all occurs as $$153 mm$$ length.
Three coins were tossed 30 times simultaneously. Each time the number of heads occurring was noted down as follows:
$$\begin{matrix} 0 & 1 & 2 & 2 & 1 & 2 & 3 & 1 & 3 & 0 \\ 1 & 3 & 1 & 1 & 2 & 2 & 0 & 1 & 2 & 1 \\ 3 & 0 & 0 & 1 & 1 & 2 & 3 & 2 & 2 & 0 \end{matrix}$$
Prepare a frequency distribution table for the data given above.
The marks scored by students in Mathematics in a certain examination are given below:
| Marks Scored | Number of Students |
| $$0 - 20$$ | $$3$$ |
| $$20 - 40$$ | $$8$$ |
| $$40 - 60$$ | $$15$$ |
| $$60 - 80$$ | $$17$$ |
| $$80 - 100$$ | $$7$$ |
The heights of 50 students, measured to the nearest centimetres, have been found to be as follows:
$$\begin{matrix} 161 & 150 & 154 & 165 & 168 & 161 & 154 & 162 & 150 & 151 \\ 162 & 164 & 171 & 165 & 158 & 154 & 156 & 172 & 160 & 170 \\ 153 & 159 & 161 & 170 & 162 & 165 & 166 & 168 & 165 & 164 \\ 154 & 152 & 153 & 156 & 158 & 162 & 160 & 161 & 173 & 166 \\ 161 & 159 & 162 & 167 & 168 & 159 & 158 & 153 & 154 & 159 \end{matrix}$$
(i) Represent the data given above by a grouped frequency distribution table, taking the class intervals as $$160-165, 165-170,$$ etc.
(ii) What can you conclude about their heights from the table?
(ii) What can you conclude about their heights from the table?
A random survey of the number of children of various age group playing in a park was found as follows:
Draw a histogram to represent the data above.
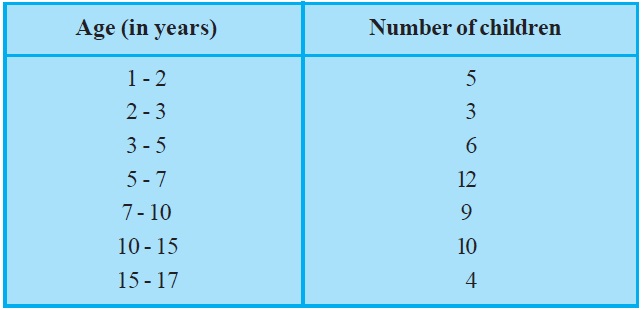
| Age (in years) | Frequency | Width | Length of the rectangle |
| 1 - 2 | 5 | 1 | $$\dfrac 51 \times 1 = 5$$ |
| 2 - 3 | 3 | 1 | $$\dfrac 31 \times 1 = 3$$ |
| 3 - 5 | 6 | 2 | $$\dfrac 62 \times 1 = 3$$ |
| 5 - 7 | 12 | 2 | $$\dfrac {12}{2} \times 1 = 6$$ |
| 7 - 10 | 9 | 3 | $$\dfrac 93 \times 1 = 3$$ |
| 10 - 15 | 10 | 5 | $$\dfrac {10}{5} \times 1 = 2$$ |
| 15 - 17 | 4 | 2 | $$\dfrac 42 \times 1 = 2$$ |

Give one example of a situation in which
(i) the mean is an appropriate measure of central tendency.
(ii) the mean is not an appropriate measure of central tendency but the medians is an appropriate measure of central tendency.
The marks scored by $$40$$ candidates in an examination (out of $$100$$) is given below:$$75, 65, 57, 50, 32, 54, 75, 67, 75, 88, 80, 42, 40, 41,34, 78, 43, 61, 42, 46$$$$68, 52, 43, 49, 59, 49, 67, 34, 33, 87, 97, 47, 46, 54, 48, 45, 51, 47, 41, 43$$.
Prepare a frequency distribution table with the class size $$10$$. Take the class intervals as $$(30 - 39), (40 - 49), . . .$$ and answer the following questions:(i) Which class intervals have the highest and lowest frequency?(ii) Write the upper and lower limits of the class interval $$30-39$$.
Given below are the ages of $$45$$ people in a colony.
$$33\ 8\ 7\ 25\ 31\ 26\ 5\ 50\ 25\ 48\ 56\ 33\ 28\ 22\ 15\ 62\ 59\ 16\ 14\ 19\ 24$$$$35\ 26\ 9\ 12\ 46\ 15\ 42\ 63\ 32\ 5\ 22\ 11\ 42\ 23\ 52\ 48\ 62\ 10\ 24\ 43\ 51\ 37\ 48\ 36$$ Construct grouped frequency distribution for the given data with $$6$$ class intervals.
Cumulative frequency table is given below. Which type of cumulative frequency is given. Try to build the frequencies of respective class intervals.
| Runs | $$0 - 10$$ | $$10 - 20$$ | $$20 - 30$$ | $$30 - 40$$ | $$40 - 50$$ |
| No of cricketers | $$3$$ | $$8$$ | $$19$$ | $$25$$ | $$30$$ |
Prepare the frequency distribution table for the given set of scores:
$$39, 16, 30, 37, 53, 15, 16, 60, 58, 26, 28, 19, 20, 12, 14, 24,$$ $$59, 21, 57, 38, 25, 36, 24, 15, 25, 41, 52, 45, 60, 63, 18, 26,$$$$43, 36, 18, 27, 59, 63, 46, 25, 33, 46, 42, 48, 35, 64, 24$$.Take class intervals as $$(10 - 20), (20 - 30), ....$$ and answer the following:
(i) What does the frequency corresponding to the third class interval mean?
(ii) What is the size of each class interval? Find the midpoint of the class interval $$30 - 40$$.
(iii) What is the range of the given set of scores?
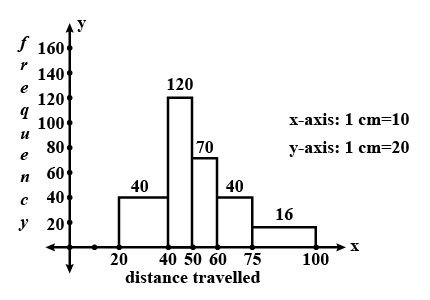
The following is the number of daily commuters who travel different distances every day. Draw the histogram.
| Distance (in km) | $$20-40$$ | $$40-50$$ | $$50-60$$ | $$60-75$$ | $$75-100$$ |
| No. of commuters | $$80$$ | $$120$$ | $$70$$ | $$60$$ | $$40$$ |
| Distance(Class interval) | Commuters | Class width | Length of rectangle $$=\dfrac{f\times C}{width}$$ |
| $$20-40$$ | $$80$$ | $$20$$ | $$\dfrac{80}{20}\times 10=40$$ |
| $$40-50$$ | $$120$$ | $$10$$ | $$\dfrac{120}{10}\times 10=120$$ |
| $$50-60$$ | $$70$$ | $$10$$ | $$\dfrac{70}{10}\times 10=70$$ |
| $$60-75$$ | $$60$$ | $$15$$ | $$\dfrac{60}{15}\times 10=40$$ |
| $$75-100$$ | $$40$$ | $$25$$ | $$\dfrac{40}{25}\times 10=16$$ |
Here distance is the class intervals and number of commuters is the frequency.
Now, taking $$1$$ cm $$= 10$$ on $$X$$-axis and $$1$$ cm $$= 10$$ on $$Y$$-axis, we can draw the histogram of varying width. We get the histogram of this kind.
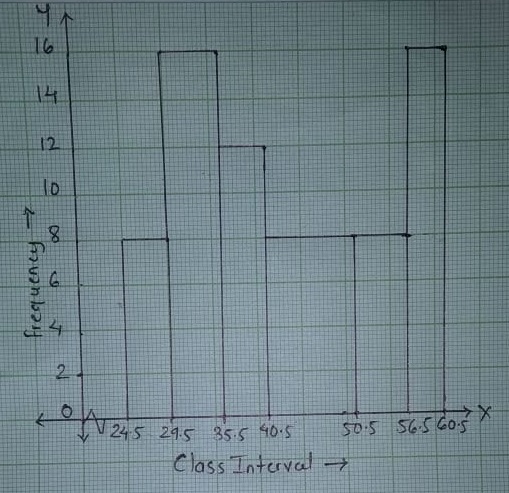
Construct histogram of variable width for the following data.
| $$CI$$ | $$25-29$$ | $$30-35$$ | $$36-40$$ | $$41-50$$ | $$51-56$$ | $$57-60$$ |
| $$f$$ | $$10$$ | $$24$$ | $$15$$ | $$20$$ | $$12$$ | $$16$$ |
| $$CI$$ | $$f$$ | $$Class-size$$ | $$Adjusted\,frequency$$ |
| $$24.5-29.5$$ | $$10$$ | $$5$$ | $$8$$ |
| $$29.5-35.5$$ | $$24$$ | $$6$$ | $$16$$ |
| $$35.5-40.5$$ | $$15$$ | $$5$$ | $$12$$ |
| $$40.5-50.5$$ | $$20$$ | $$10$$ | $$8$$ |
| $$50.5-56.5$$ | $$12$$ | $$6$$ | $$8$$ |
| $$56.5-60.5$$ | $$16$$ | $$4$$ | $$16$$ |
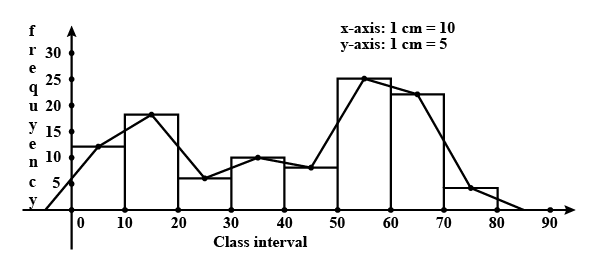
Draw a frequency polygon for the following frequency distribution.
| $$CI$$ | $$0-10$$ | $$10-20$$ | $$20-30$$ | $$30-40$$ | $$40-50$$ | $$50-60$$ | $$60-70$$ | $$70-80$$ |
| $$f$$ | $$12$$ | $$18$$ | $$6$$ | $$10$$ | $$8$$ | $$25$$ | $$22$$ | $$4$$ |
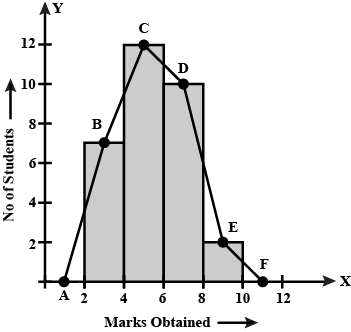
Marks of $$30$$ students in mathematics test are given in the adjacent grouped frequency distribution.
| Sl. No | Marks | No of students |
| $$1$$ | $$0 - 5$$ | $$5$$ |
| $$2$$ | $$5 - 10$$ | $$7$$ |
| $$3$$ | $$10 - 15$$ | $$10$$ |
| $$4$$ | $$15 - 20$$ | $$6$$ |
| $$5$$ | $$20 - 25$$ | $$2$$ |
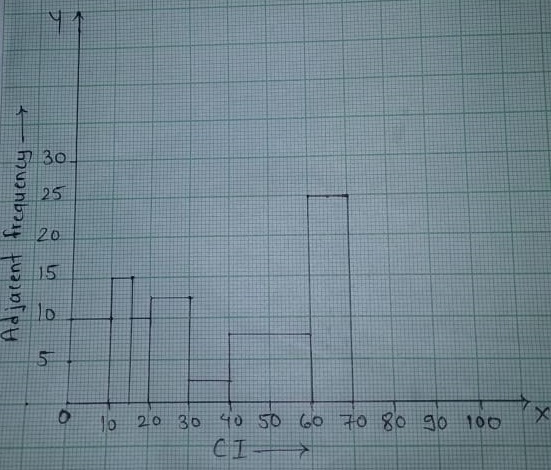
Construct histogram of variable width for the following data.
| $$CI$$ | $$0-10$$ | $$10-15$$ | $$15-20$$ | $$20-30$$ | $$30-40$$ | $$40-60$$ | $$60-70$$ |
| $$f$$ | $$20$$ | $$15$$ | $$10$$ | $$25$$ | $$5$$ | $$30$$ | $$50$$ |
| $$CI$$ | $$Frequency$$ | $$Class\, size$$ | $$Adjacent\,frequency$$ |
| $$0-10$$ | $$20$$ | $$10$$ | $$10$$ |
| $$10-15$$ | $$15$$ | $$5$$ | $$15$$ |
| $$15-20$$ | $$10$$ | $$5$$ | $$10$$ |
| $$20-30$$ | $$25$$ | $$10$$ | $$12.5$$ |
| $$30-40$$ | $$5$$ | $$ 10$$ | $$2.5$$ |
| $$40-60$$ | $$30$$ | $$20$$ | $$7.5$$ |
| $$60-70$$ | $$50$$ | $$10$$ | $$25$$ |
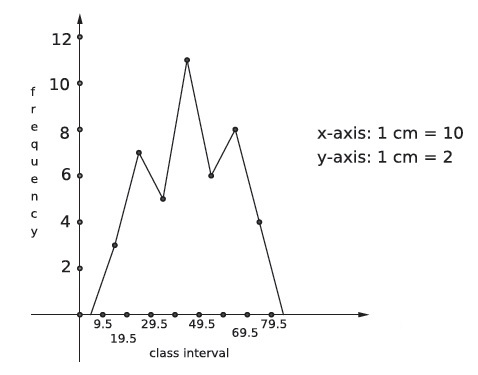
Draw a frequency polygon of the following data:
| $$CI$$ | $$10-19$$ | $$20-29$$ | $$30-39$$ | $$40-49$$ | $$50-59$$ | $$60-69$$ | $$70-79$$ | $$80-90$$ |
| $$f$$ | $$3$$ | $$7$$ | $$5$$ | $$11$$ | $$6$$ | $$8$$ | $$4$$ | $$5$$ |
Observe that the class intervals are given in inclusive form. They are to be converted in to exclusive form by adding the correction factor. The correction factor is $$0.5$$. This is subtracted from the lower limit and added to the upper limit. Converting the data into exclusive form we get:
| CI | $$9.5-19.5$$ | $$19.5-29.5$$ | $$29.5-39.5$$ | $$39.5-49.5$$ | $$49.5-59.5$$ | $$59.5-69.5$$ | $$69.5-79.5$$ | $$79.5-89.5$$ |
| M.P. | $$14.5$$ | $$24.5$$ | $$34.$$ | $$44.5$$ | $$54.5$$ | $$64.5$$ | $$74.5$$ | $$84.5$$ |
| $$f$$ | $$3$$ | $$7$$ | $$5$$ | $$11$$ | $$6$$ | $$8$$ | $$4$$ | $$5$$ |
The number of goals scored by a hockey team in $$20$$ matches is given here:
$$4, 6, 3, 2, 2, 4, 1, 5, 3, 0, 4, 5, 4, 5, 4, 0, 4, 3, 6, 4$$.
Find the mean.
Calculate the range and coefficient of range from the following data:
The heights of $$10$$ children in $$cm : 122, 144, 154, 101, 168, 118, 155, 133, 160, 140$$
Three coins were tossed $$30$$ times simultaneously. Each time the number of heads occurring was noted down as follows;
$$1\ 2\ 3\ 2\ 3\ 1\ 1\ 1\ 0\ 3\ 2\ 1\ 2\ 2\ 1\ 1\ 2\ 3\ 2\ 0\ 3\ 0\ 1\ 2\ 3\ 2\ 2\ 3\ 1\ 1$$
Prepare a frequency distribution table for the data given above
The frequency distribution of the age of persons (in years) attending trekking camp is given below:
| Age (in years) | Number of persons |
| $$15-19$$ | $$16$$ |
| $$20-24$$ | $$60$$ |
| $$25-29$$ | $$50$$ |
| $$30-34$$ | $$30$$ |
The marks obtained by $$36$$ students in a test in statistics (out of $$50$$) are as below.
$$3\ 5\ 1\ 15\ 35\ 45\ 23\ 31\ 40\ 21\ 13\ 15\ 20\ 47\ 48\ 42\ 34\ 43\ 45\ 33\ 37\ 11\ 13\ 27\ 18\ 12\ 37\ 39\ 38\ 16\ 13\ 18$$ $$5\ 41\ 47\ 43$$
Construct a frequency distribution table with equal class intervals, one of them being $$10-20$$ ($$20$$ is not included)
Weekly wages of $$250$$ workers in a factory are given in the following table. Construct the histogram and frequency polygon on the same graph for the data given.
| Weekly wages | $$500 - 550$$ | $$550 - 600$$ | $$600 - 650$$ | $$650 - 700$$ | $$700 - 750$$ | $$750 - 800$$ |
| No of workers | $$30$$ | $$42$$ | $$50$$ | $$55$$ | $$45$$ | $$28$$ |
| $$Class-interval$$ | $$Frequency$$ | $$Class-mark$$ |
| $$450-500$$ | $$0$$ | $$475$$ |
| $$500-550$$ | $$30$$ | $$525$$ |
| $$550-600$$ | $$42$$ | $$575$$ |
| $$600-650$$ | $$50$$ | $$625$$ |
| $$650-700$$ | $$55$$ | $$675$$ |
| $$700-750$$ | $$45$$ | $$725$$ |
| $$750-800$$ | $$28$$ | $$775$$ |
| $$800-850$$ | $$0$$ | $$825$$ |
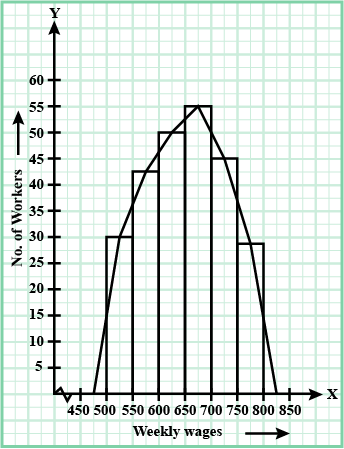
A company manufactures car batteries of a particular type. The life (in years) of 40 batteries were recorded as follows:
$$2.6\ 3.0\ 3.7\ 3.2\ 2.2\ 4.1\ 3.5\ 4.5$$
$$3.5\ 2.3\ 3.2\ 3.4\ 3.8\ 3.2\ 4.6\ 3.7$$
$$2.5\ 4.4\ 3.4\ 3.3\ 2.9\ 3.0\ 4.3\ 2.8$$
$$3.5\ 3.2\ 3.9\ 3.2\ 3.2\ 3.1\ 3.7\ 3.4$$
$$4.6\ 3.8\ 3.2\ 2.6\ 3.5\ 4.2\ 2.9\ 3.6$$
Construct a grouped frequency distribution table with exclusive classes for this data, using class intervals of size $$0.5$$ starting from the interval $$2 - 2.5$$
Ages of $$60$$ teachers in primary schools of a Mandal are given in the following frequency distribution table. Construct the Frequency polygon and frequency curve for the data without using the histogram. (Use separate graph sheets)
| Ages | $$24 - 28$$ | $$28 - 32$$ | $$32 - 36$$ | $$36 - 40$$ | $$40 - 44$$ | $$44 - 48$$ |
| No of teachers | $$12$$ | $$10$$ | $$15$$ | $$9$$ | $$8$$ | $$6$$ |
| $$Ages$$ | $$Class-mark$$ | $$No.\,of\,teachers$$ |
| $$20-24$$ | $$22$$ | $$0$$ |
| $$24-28$$ | $$26$$ | $$12$$ |
| $$28-32$$ | $$30$$ | $$10$$ |
| $$32-36$$ | $$34$$ | $$15$$ |
| $$36-40$$ | $$38$$ | $$9$$ |
| $$40-44$$ | $$42$$ | $$8$$ |
| $$44-48$$ | $$46$$ | $$6$$ |
| $$48-52$$ | $$50$$ | $$0$$ |
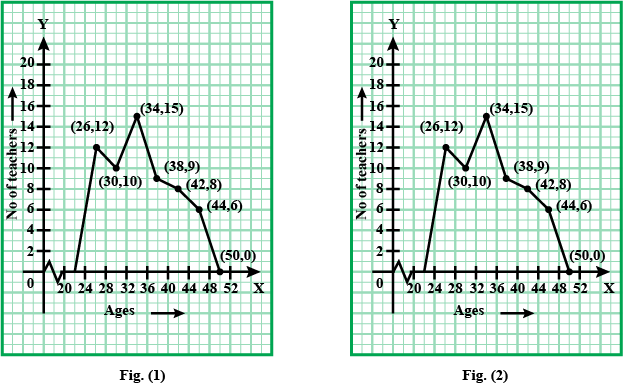
The age (in years) of $$360$$ patients treated in the hospital on a particular day are given below.
| Age in years | $$10-20$$ | $$20-30$$ | $$30-50$$ | $$50-60$$ | $$60-70$$ |
| No. of patients | $$80$$ | $$50$$ | $$80$$ | $$120$$ | $$30$$ |
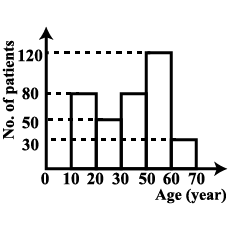
The following is the frequency distribution of waiting time at $$A$$ centre; draw histogram to represent the data.
| Waiting time(in seconds) | Number of Customers |
| $$0-30$$ | $$5$$ |
| $$30-60$$ | $$50$$ |
| $$60-90$$ | $$64$$ |
| $$90-120$$ | $$23$$ |
| $$120-150$$ | $$15$$ |
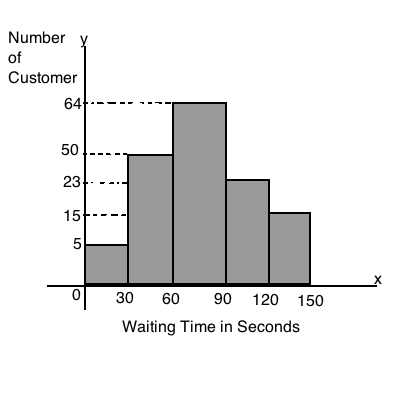
Draw a histogram for the following table which represent the marks obtained by $$100$$ students in an examination.
| Marks | $$0-10$$ | $$10-20$$ | $$20-30$$ | $$30-40$$ | $$40-50$$ | $$50-60$$ | $$60-70$$ | $$70-80$$ |
| Number of students | $$5$$ | $$10$$ | $$15$$ | $$20$$ | $$25$$ | $$12$$ | $$8$$ | $$5$$ |
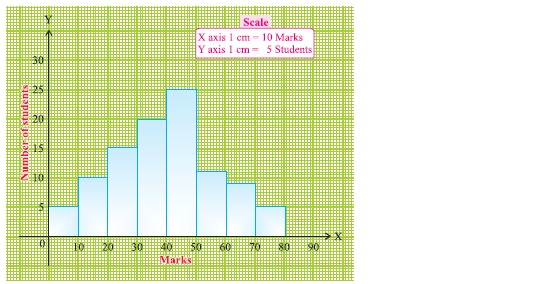
The marks obtained by $$50$$ students in a Mathematics test with maximum mrks of $$100$$ are given as follows.
43, 88, 25, 93, 68, 81, 29, 41, 45, 87, 34, 50, 61, 75, 51, 96, 20, 13, 18, 35, 25, 77, 62, 98, 47, 36, 15, 40, 9, 25, 39, 60, 37, 50, 19, 86, 42, 29, 32, 61, 45, 68, 41, 87, 61, 44, 67, 30, 54, 8.
Prepare a frequency table for the above data using class interval.
Range $$=$$ Highest value $$-$$ Lowest value
$$=98-8=90$$
Let us divide the given data into $$10$$ classes.
$$\therefore$$ Length of the Class interval $$=\displaystyle\frac{Range}{\text{Number of class interval}}$$
$$=\displaystyle\frac{90}{10}=10$$
The frequency table of the marks obtained by $$50$$ students in a mathematics test is as follows.
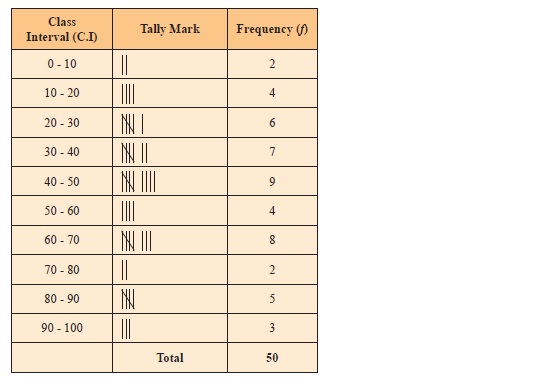
Draw a histogram for the following data:
| Marks | No. of Students |
| $$10-20$$ | $$15$$ |
| $$20-30$$ | $$30$$ |
| $$30-40$$ | $$50$$ |
| $$40-50$$ | $$40$$ |
| $$50-60$$ | $$20$$ |
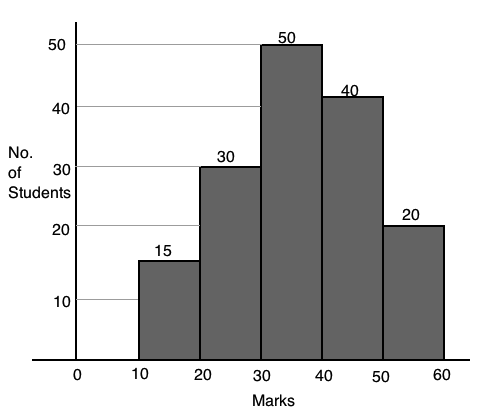
Construct a histogram and frequey polygon for the following data.
| Class interval | $$0-10$$ | $$10-20$$ | $$20-30$$ | $$30-40$$ | $$40-50$$ | $$50-60$$ |
| Frequency | $$7$$ | $$10$$ | $$23$$ | $$11$$ | $$8$$ | $$5$$ |
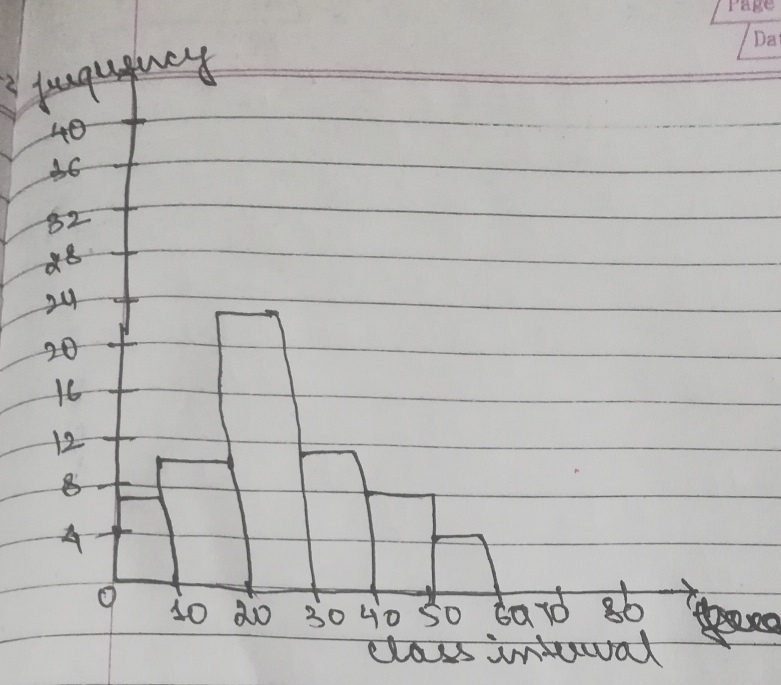
Draw a Histogram for the following data :
| Class Interval | Frequency |
| $$0-10$$ | $$ 35$$ |
| $$10-20$$ | $$ 70$$ |
| $$20-30$$ | $$ 20$$ |
| $$30-40$$ | $$ 40$$ |
| $$40-50$$ | $$ 50$$ |
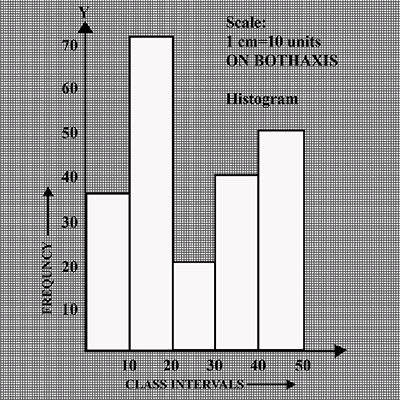
Consider the following data.
$$15, 17, 17, 20, 15, 18, 16, 25, 16, 15,$$
$$16, 18, 20, 28, 30, 27, 18, 18, 20, 25,$$
$$16, 16, 20, 28, 15, 18, 20, 20, 20, 25$$. Form a frequency table.
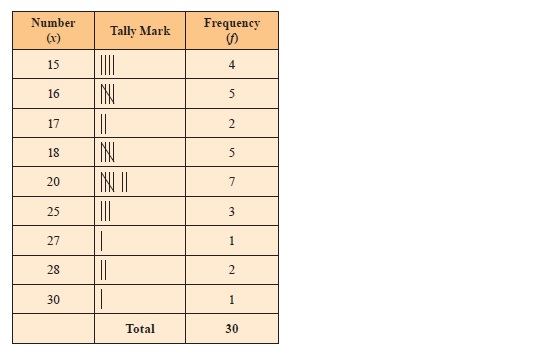
Given below are marks obtained by $$20$$ students in Math out of $$25$$.
$$21, 23, 19, 17, 12, 15, 15, 17, 17, 19, 23, 23, 21, 23, 25, 25, 21, 19, 19, 19$$
Prepare a frequency distribution table for the given data.
Calculate the frequency data of age of class students.
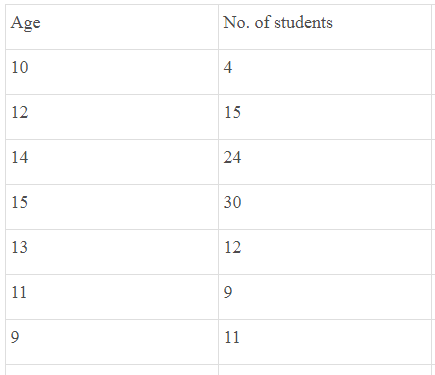
Create an Ungrouped Frequency Distribution table with the data from the survey, accomplished among the students of university, which answered the question of how many books they read per year. The answers are presented below:
| 7 | 8 | 9 | 5 | 4 | 6 | 7 | 3 | 4 |
Find the median for the following frequency distribution
| Height (in $$cm$$) | $$160-162$$ | $$163-165$$ | $$166-168$$ | $$169-171$$ | $$172-174$$ |
| Frequency | $$15$$ | $$117$$ | $$136$$ | $$110$$ | $$14$$ |
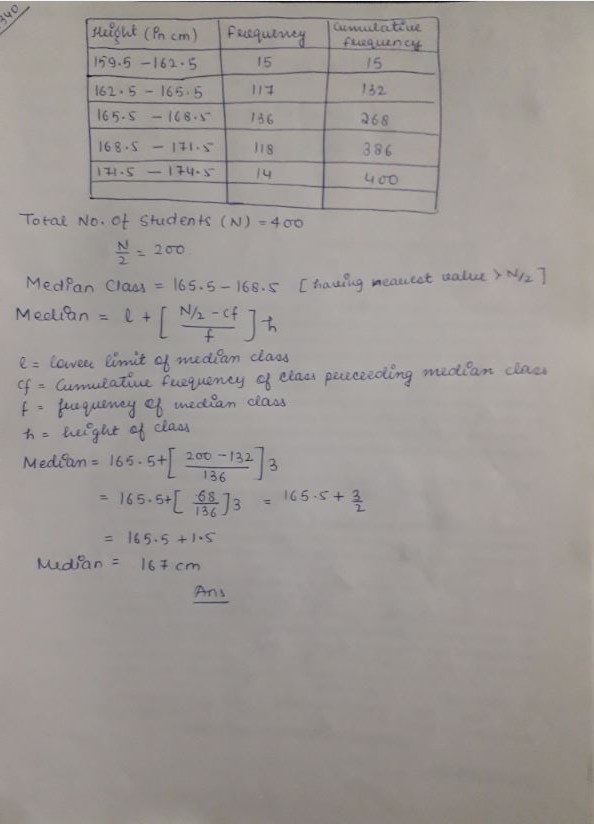
Draw the or give the less than and more than of the date given below (Ex 14.03.02) and find the median
| Class Interval | Frequency |
| 0-10 | 5 |
| 10-20 | 8 |
| 20-30 | 20 |
| 30-40 | 15 |
| 40-50 | 7 |
| 50-60 | 5 |
| Total | 60 |
| Class Interval | Frequency | Less Than Cummulative Frequency | More Than Cummulative Frequency |
| $$0-10$$ | $$ 5$$ | $$5$$ | $$ 60$$ |
| $$10-20$$ | $$ 8$$ | $$ 5+8=13$$ | $$60-5=55 $$ |
| $$ 20-30$$ | $$ 20$$ | $$13+20=33$$ | $$55-8=47$$ |
| $$ 30-40$$ | $$ 15$$ | $$ 33+15=48$$ | $$47-20=27$$ |
| $$40-50$$ | $$ 7$$ | $$48+7=55$$ | $$27-15=12$$ |
| $$ 50-60$$ | $$5$$ | $$ 55+5=60$$ | $$12-7=5$$ |
| $$ 60$$ |
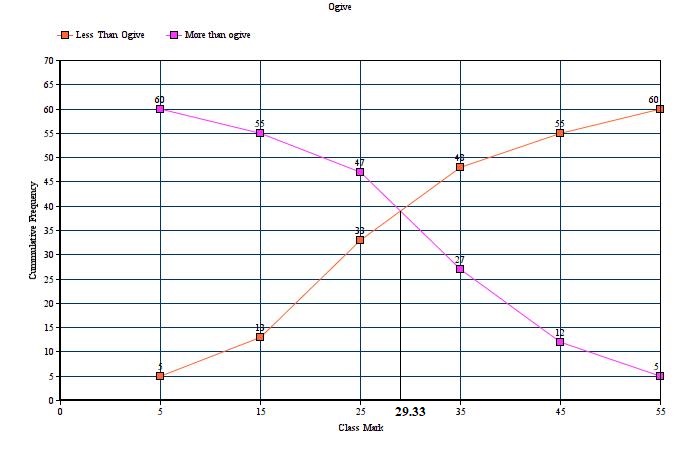
Find the missing frequencies in the following frequency distribution if it is known that the mean of the distribution is $$50$$.
| $$x$$: | $$10$$ | $$30$$ | $$50$$ | $$70$$ | $$90$$ | |
| $$f$$: | $$17$$ | $${f}_{1}$$ | $$32$$ | $${f}_{2}$$ | $$19$$ | Total:$$120$$ |
A consumer buys a certain quantity of a good at a price of $$Rs. 10$$ per unit. When price falls to $$Rs. 8$$ per unit, she buys $$40$$ per cent quantity. Calculate price elasticity of demand.
Giving reason, comment on the shape of production possibilities curve based on the following schedule:
| Good-X (Units) | $$0$$ | $$1$$ | $$2$$ | $$3$$ | $$4$$ |
| Good-Y (Units) | $$16$$ | $$12$$ | $$8$$ | $$4$$ | $$0$$ |
The marginal utility from the consumption of commodity - X is given in following table:
| Units of $$X$$ | $$1$$ | $$2$$ | $$3$$ | $$4$$ | $$5$$ |
| $$MU_{x}$$ | $$10$$ | $$9$$ | $$7$$ | $$3$$ | $$-5$$ |
Write the frequency distribution table for the following data.
| Marks | Below $$10$$ | Below $$15$$ | Below $$20$$ | Below $$30$$ | Below $$35$$ | Below $$40$$ |
| Number of students | $$0$$ | $$15$$ | $$20$$ | $$30$$ | $$35$$ | $$40$$ |
| Profits per shop | $$0-50$$ | $$50-100$$ | $$100-150$$ | $$150-200$$ | $$200-250$$ | $$250-300$$ |
| No. of shops | $$12$$ | $$18$$ | $$27$$ | $$20$$ | $$17$$ | $$6$$ |
| $$Profit\,per\,shop$$ | $$Mid-value$$ | $$No.of\,shops$$ |
| Less than $$0$$ | $$0$$ | $$0$$ |
| $$0-50$$ | $$25$$ | $$12$$ |
| $$50-100$$ | $$75$$ | $$18$$ |
| $$100-150$$ | $$125$$ | $$27$$ |
| $$150-200$$ | $$175$$ | $$20$$ |
| $$200-250$$ | $$225$$ | $$17$$ |
| $$250-300$$ | $$275$$ | $$6$$ |
| More than $$300$$ | $$0$$ | $$0$$ |
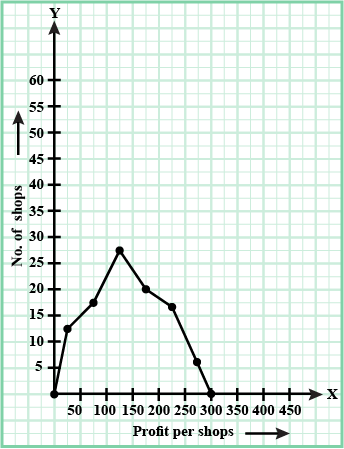
A consumer buys $$18$$ units of a good at a price of $$Rs. 9$$ per unit. The price elasticity of demand for the good is $$(-) 1$$. How many units the consumer will buy at a price of $$Rs. 10$$ per unit? Calculate.
For the frequency distribution given, find the class length of each class
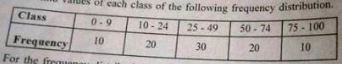
| Production yield $$(kg/ha)$$ | $$10-20$$ | $$20-30$$ | $$30-40$$ | $$40-50$$ | $$50-60$$ | $$60-70$$ |
| Number of farms | $$10$$ | $$15$$ | $$30$$ | $$32$$ | $$8$$ | $$5$$ |
| $$Production\,yield\,(kg/ha)$$ | $$No.\,of\,farms$$ |
| Less than $$20$$ | $$10$$ |
| Less than $$30$$ | $$10+15=25$$ |
| Less than $$40$$ | $$25+30=55$$ |
| Less than $$50$$ | $$55+32=87$$ |
| Less than $$60$$ | $$87+8=95$$ |
| Less than $$70$$ | $$95+5=100$$ |
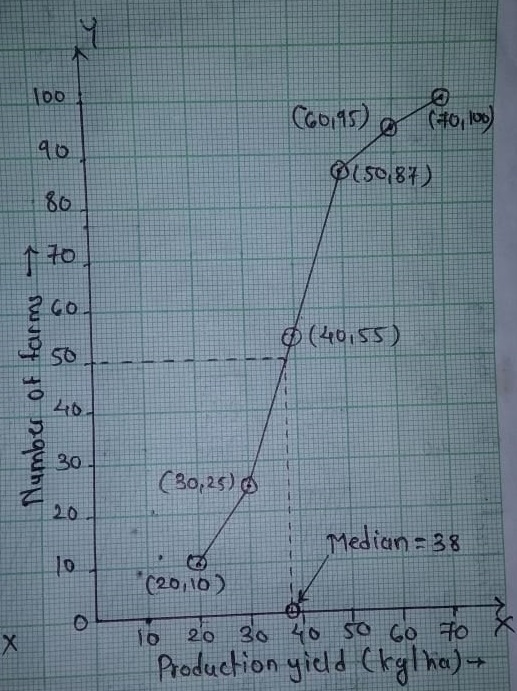
Construct a frequency distribution table with class interval of 5 for the following data:
2,4,8,11,14,16,20,28,25,40,30,48,5,22,29,13,22,17,17,7.
We have,
$$2,4,8,11,14,16,20,28,25,40,30,48,5,22,29,13,22,17,17,7$$
Take a look at the table below to understand the concept better:-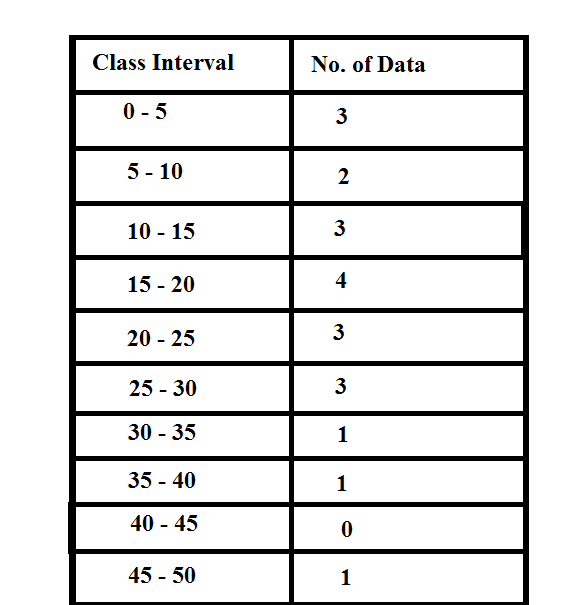
Which value decides the width of each rectangle in the histogram ?
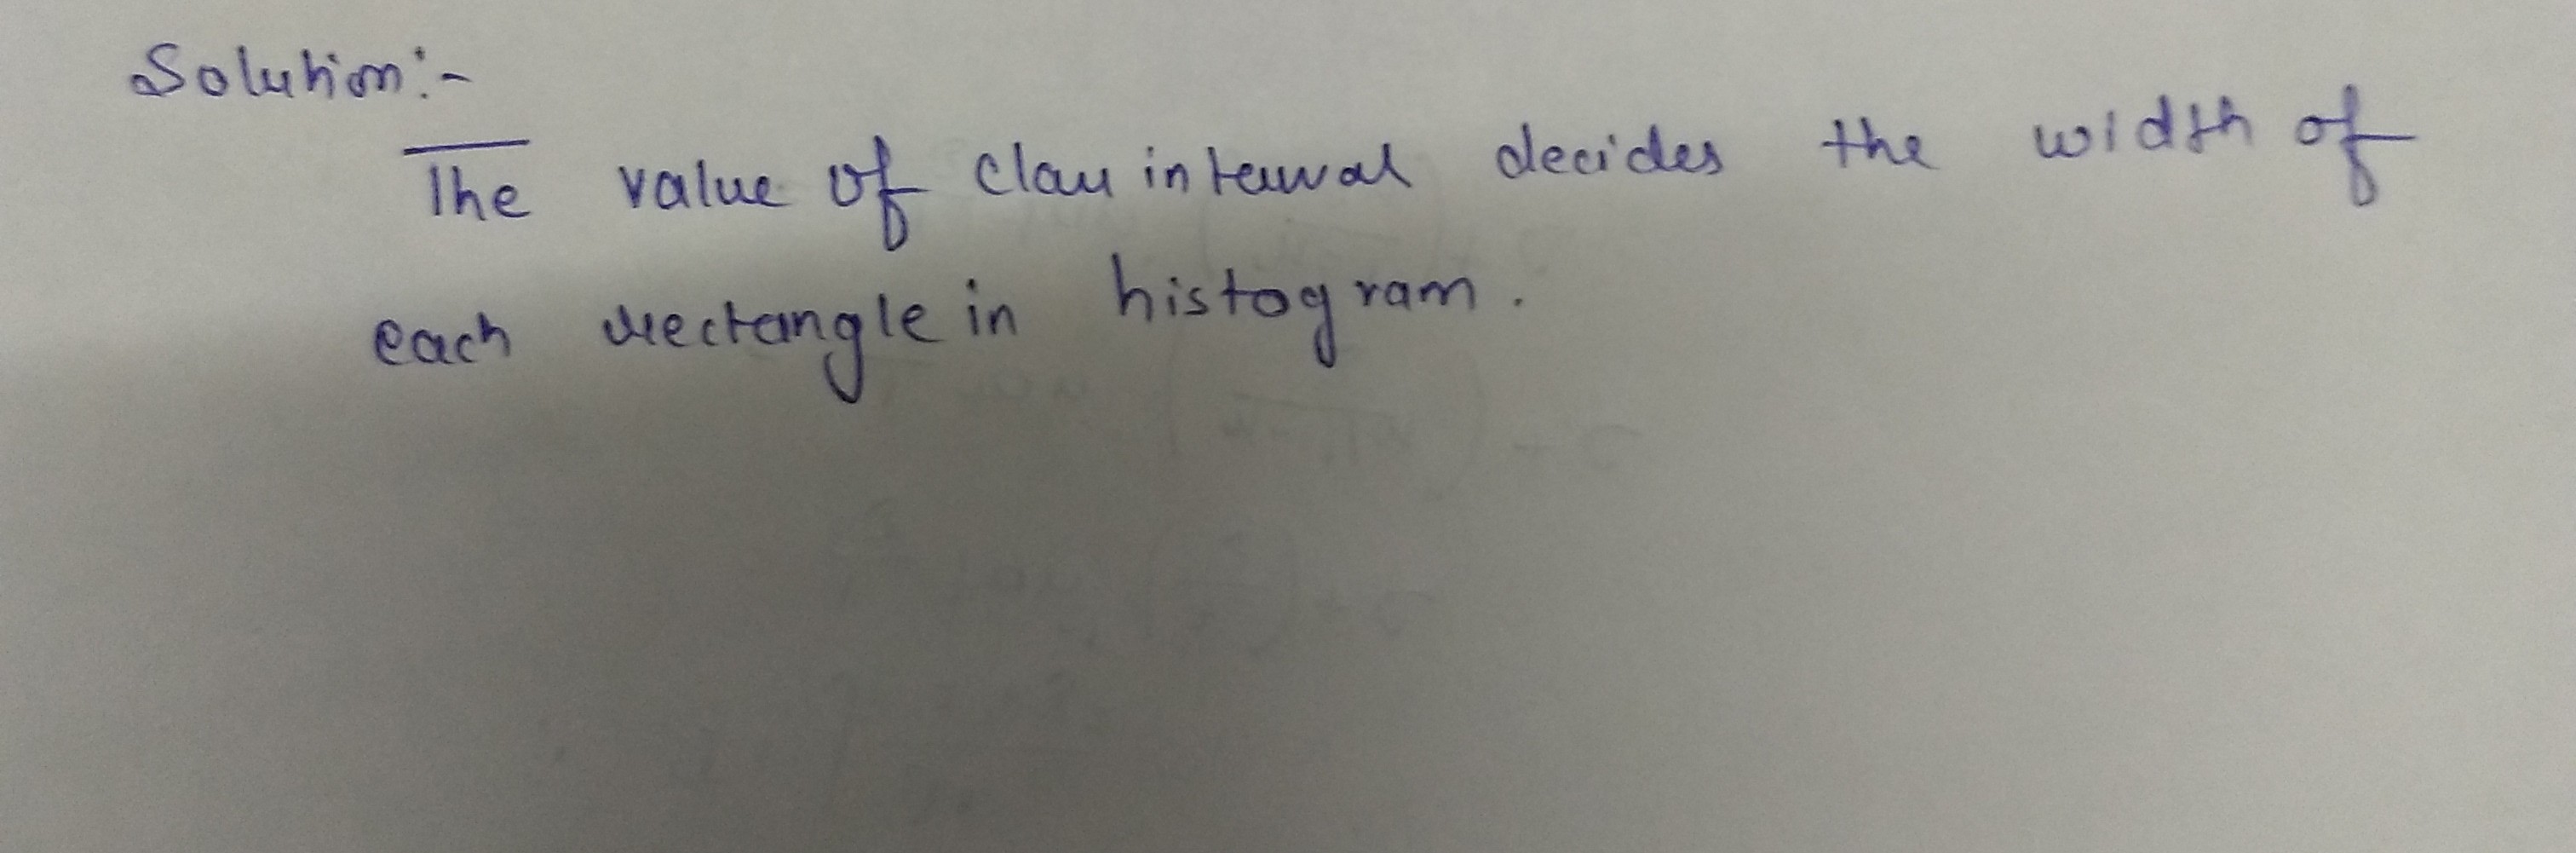
Draw the frequency polygon of the following data:
| Marks | 0-10 | 10-20 | 20-30 | 30-40 | 40-50 |
| Number of students | 5 | 10 | 12 | 13 | 15 |
| $$Marks$$ | $$Mid-value$$ $$(Marks)$$ | $$Number\,of\,students$$ |
| Less than $$0$$ | $$0$$ | $$0$$ |
| $$0-10$$ | $$5$$ | $$5$$ |
| $$10-20$$ | $$15$$ | $$10$$ |
| $$20-30$$ | $$25$$ | $$12$$ |
| $$30-40$$ | $$35$$ | $$13$$ |
| $$40-50$$ | $$45$$ | $$15$$ |
| More than $$50$$ | $$0$$ | $$0$$ |
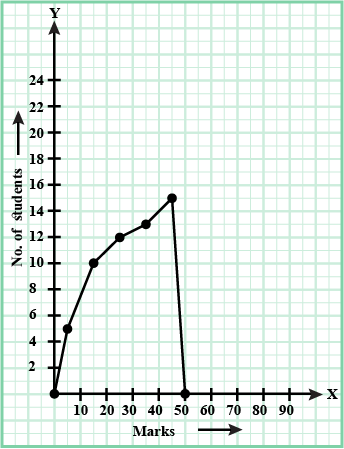
Construct a histogram for the marks obtained by $$600$$ students in the VII class annual examinations.
| Marks | $$360$$ | $$400$$ | $$440$$ | $$480$$ | $$520$$ | $$560$$ |
| No. of students | $$100$$ | $$125$$ | $$140$$ | $$95$$ | $$80$$ | $$60$$ |
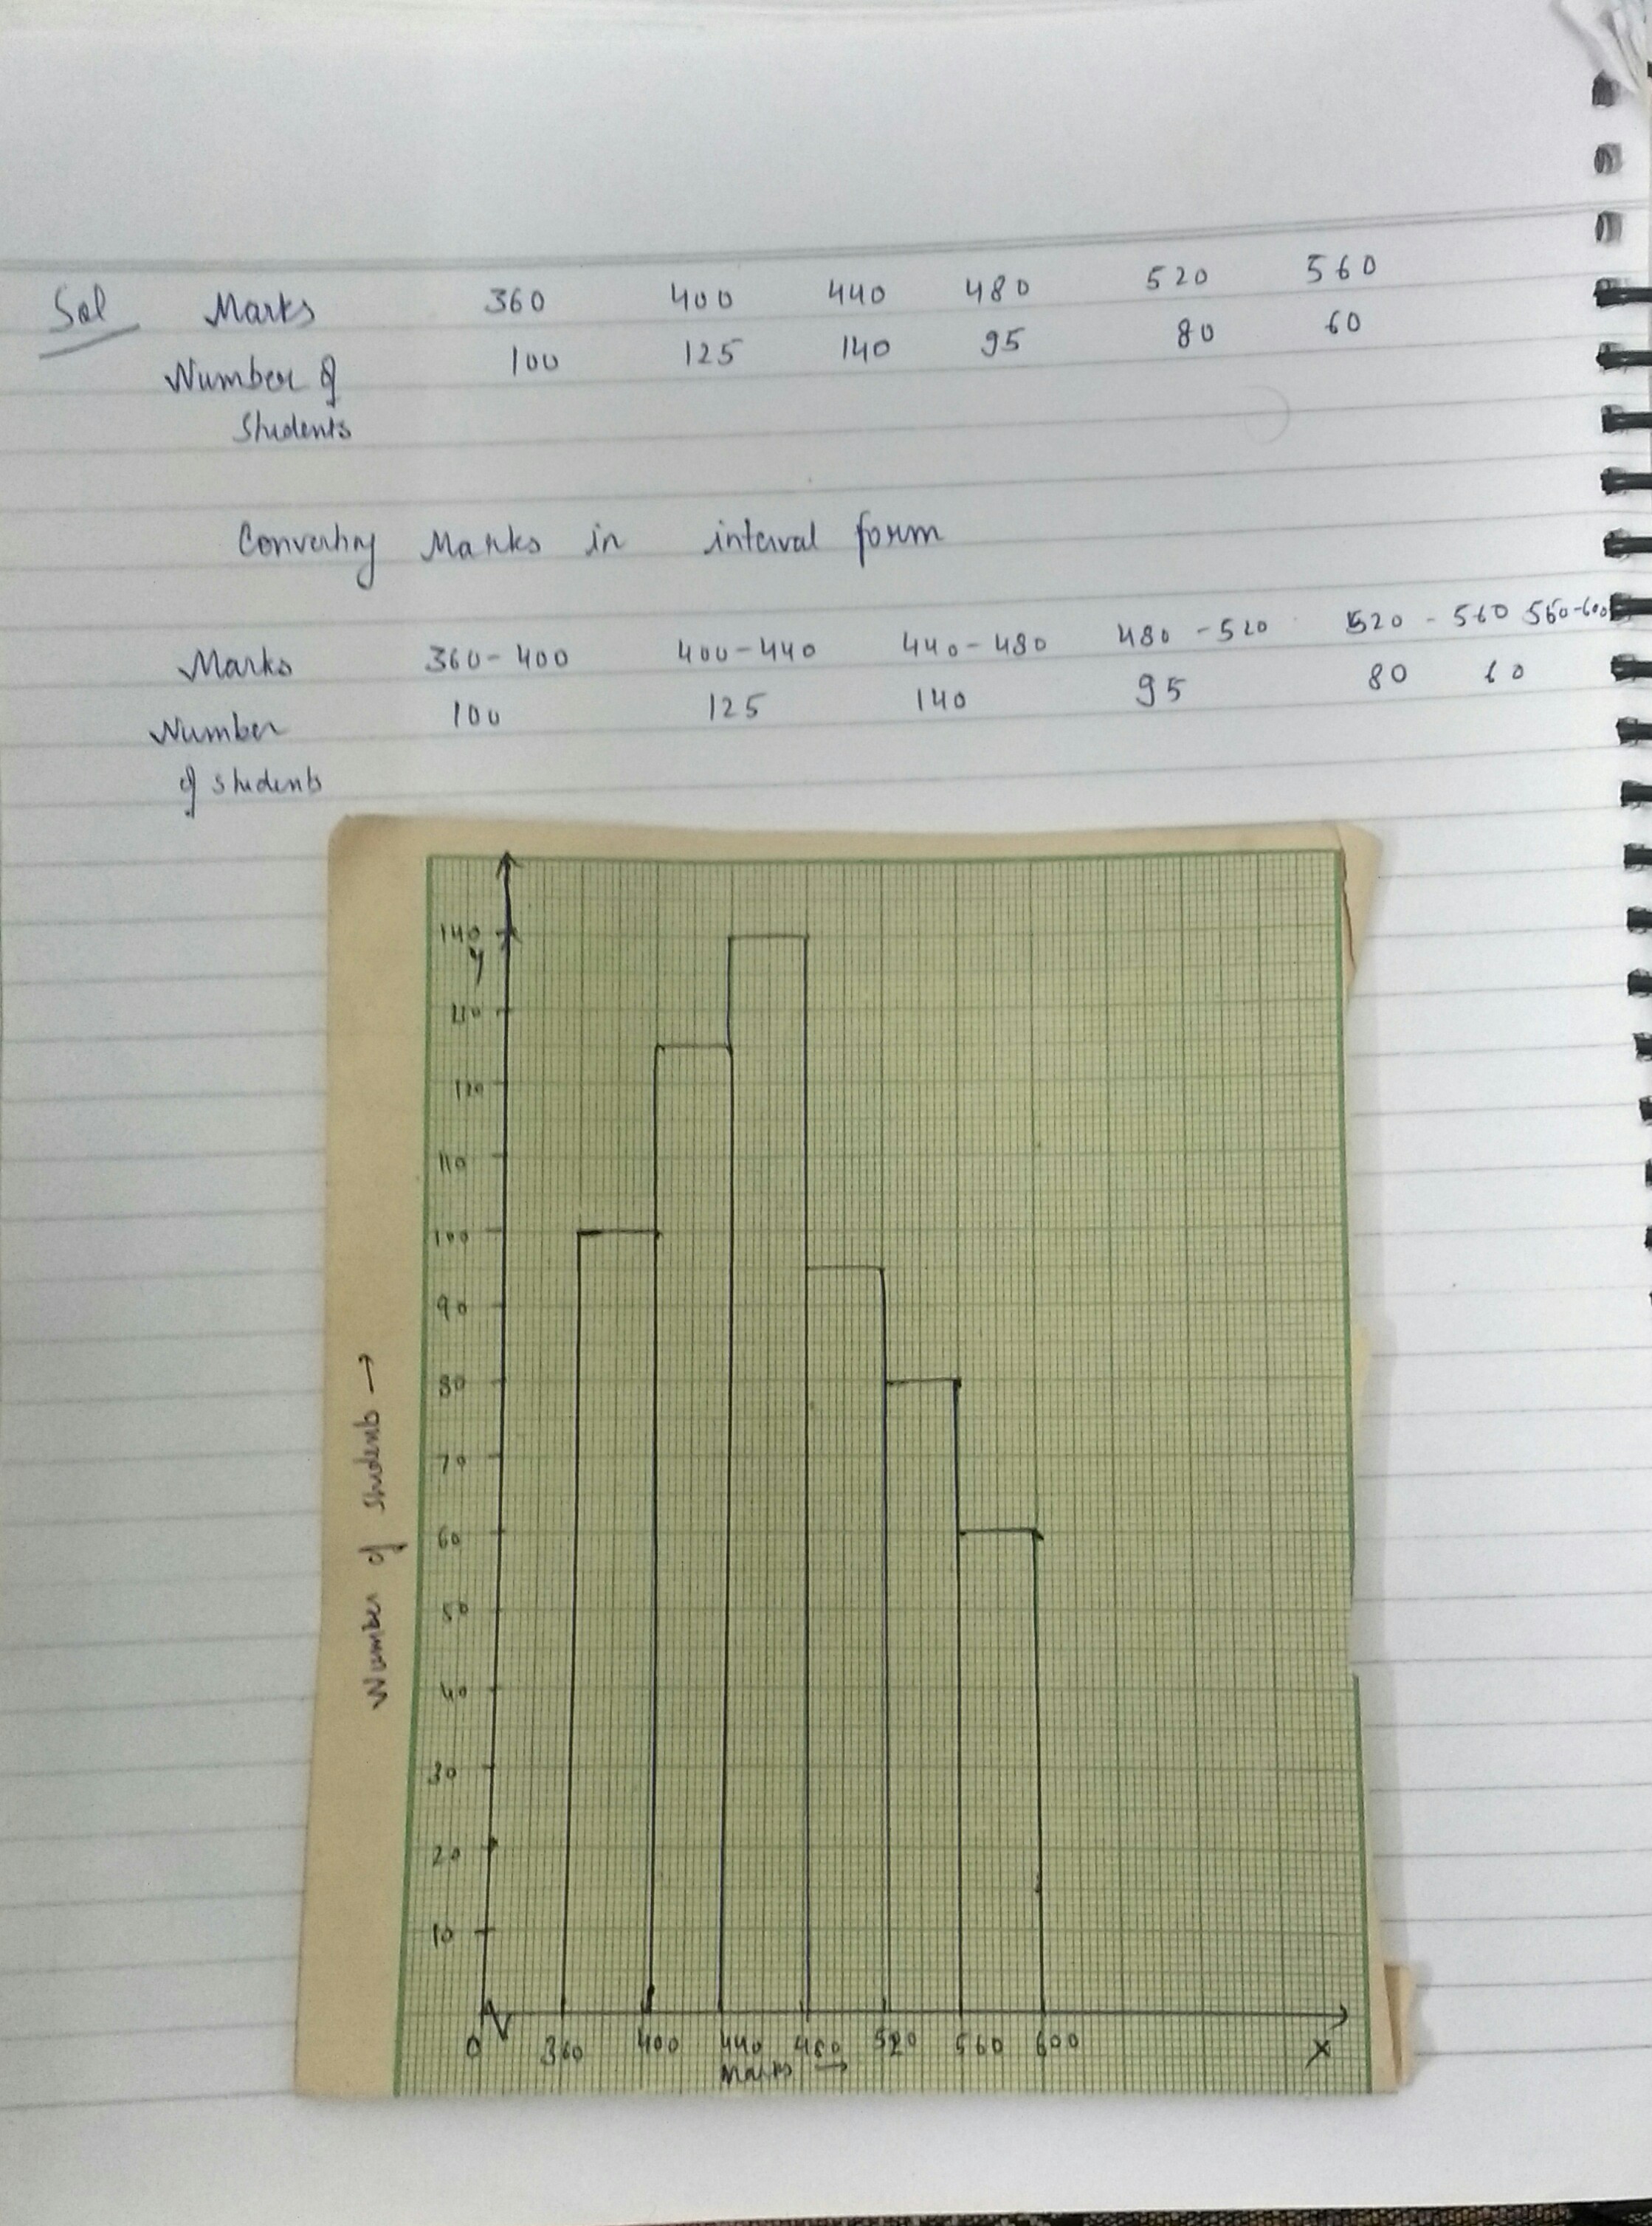
Given below are the ages of 45 people in a colony.
| 33 | 8 | 7 | 25 | 31 | 26 | 5 | 20 | 25 | 48 | 56 |
| 33 | 28 | 22 | 15 | 62 | 59 | 16 | 14 | 19 | 24 | 35 |
| 26 | 9 | 12 | 46 | 15 | 42 | 63 | 32 | 5 | 22 | 11 |
| 42 | 23 | 52 | 48 | 62 | 10 | 24 | 43 | 51 | 37 | 48 |
| 36 |
If the collection of data in Q.no.1 be grouped into the class intervals $$40-45,45-50,50-55,55-60,60-65,65-70$$ then answer the following.1)What are the class limits and class boundaries of the class interval $$60-65$$?
2)What are the class size and the class mark of the class interval $$45-50$$?
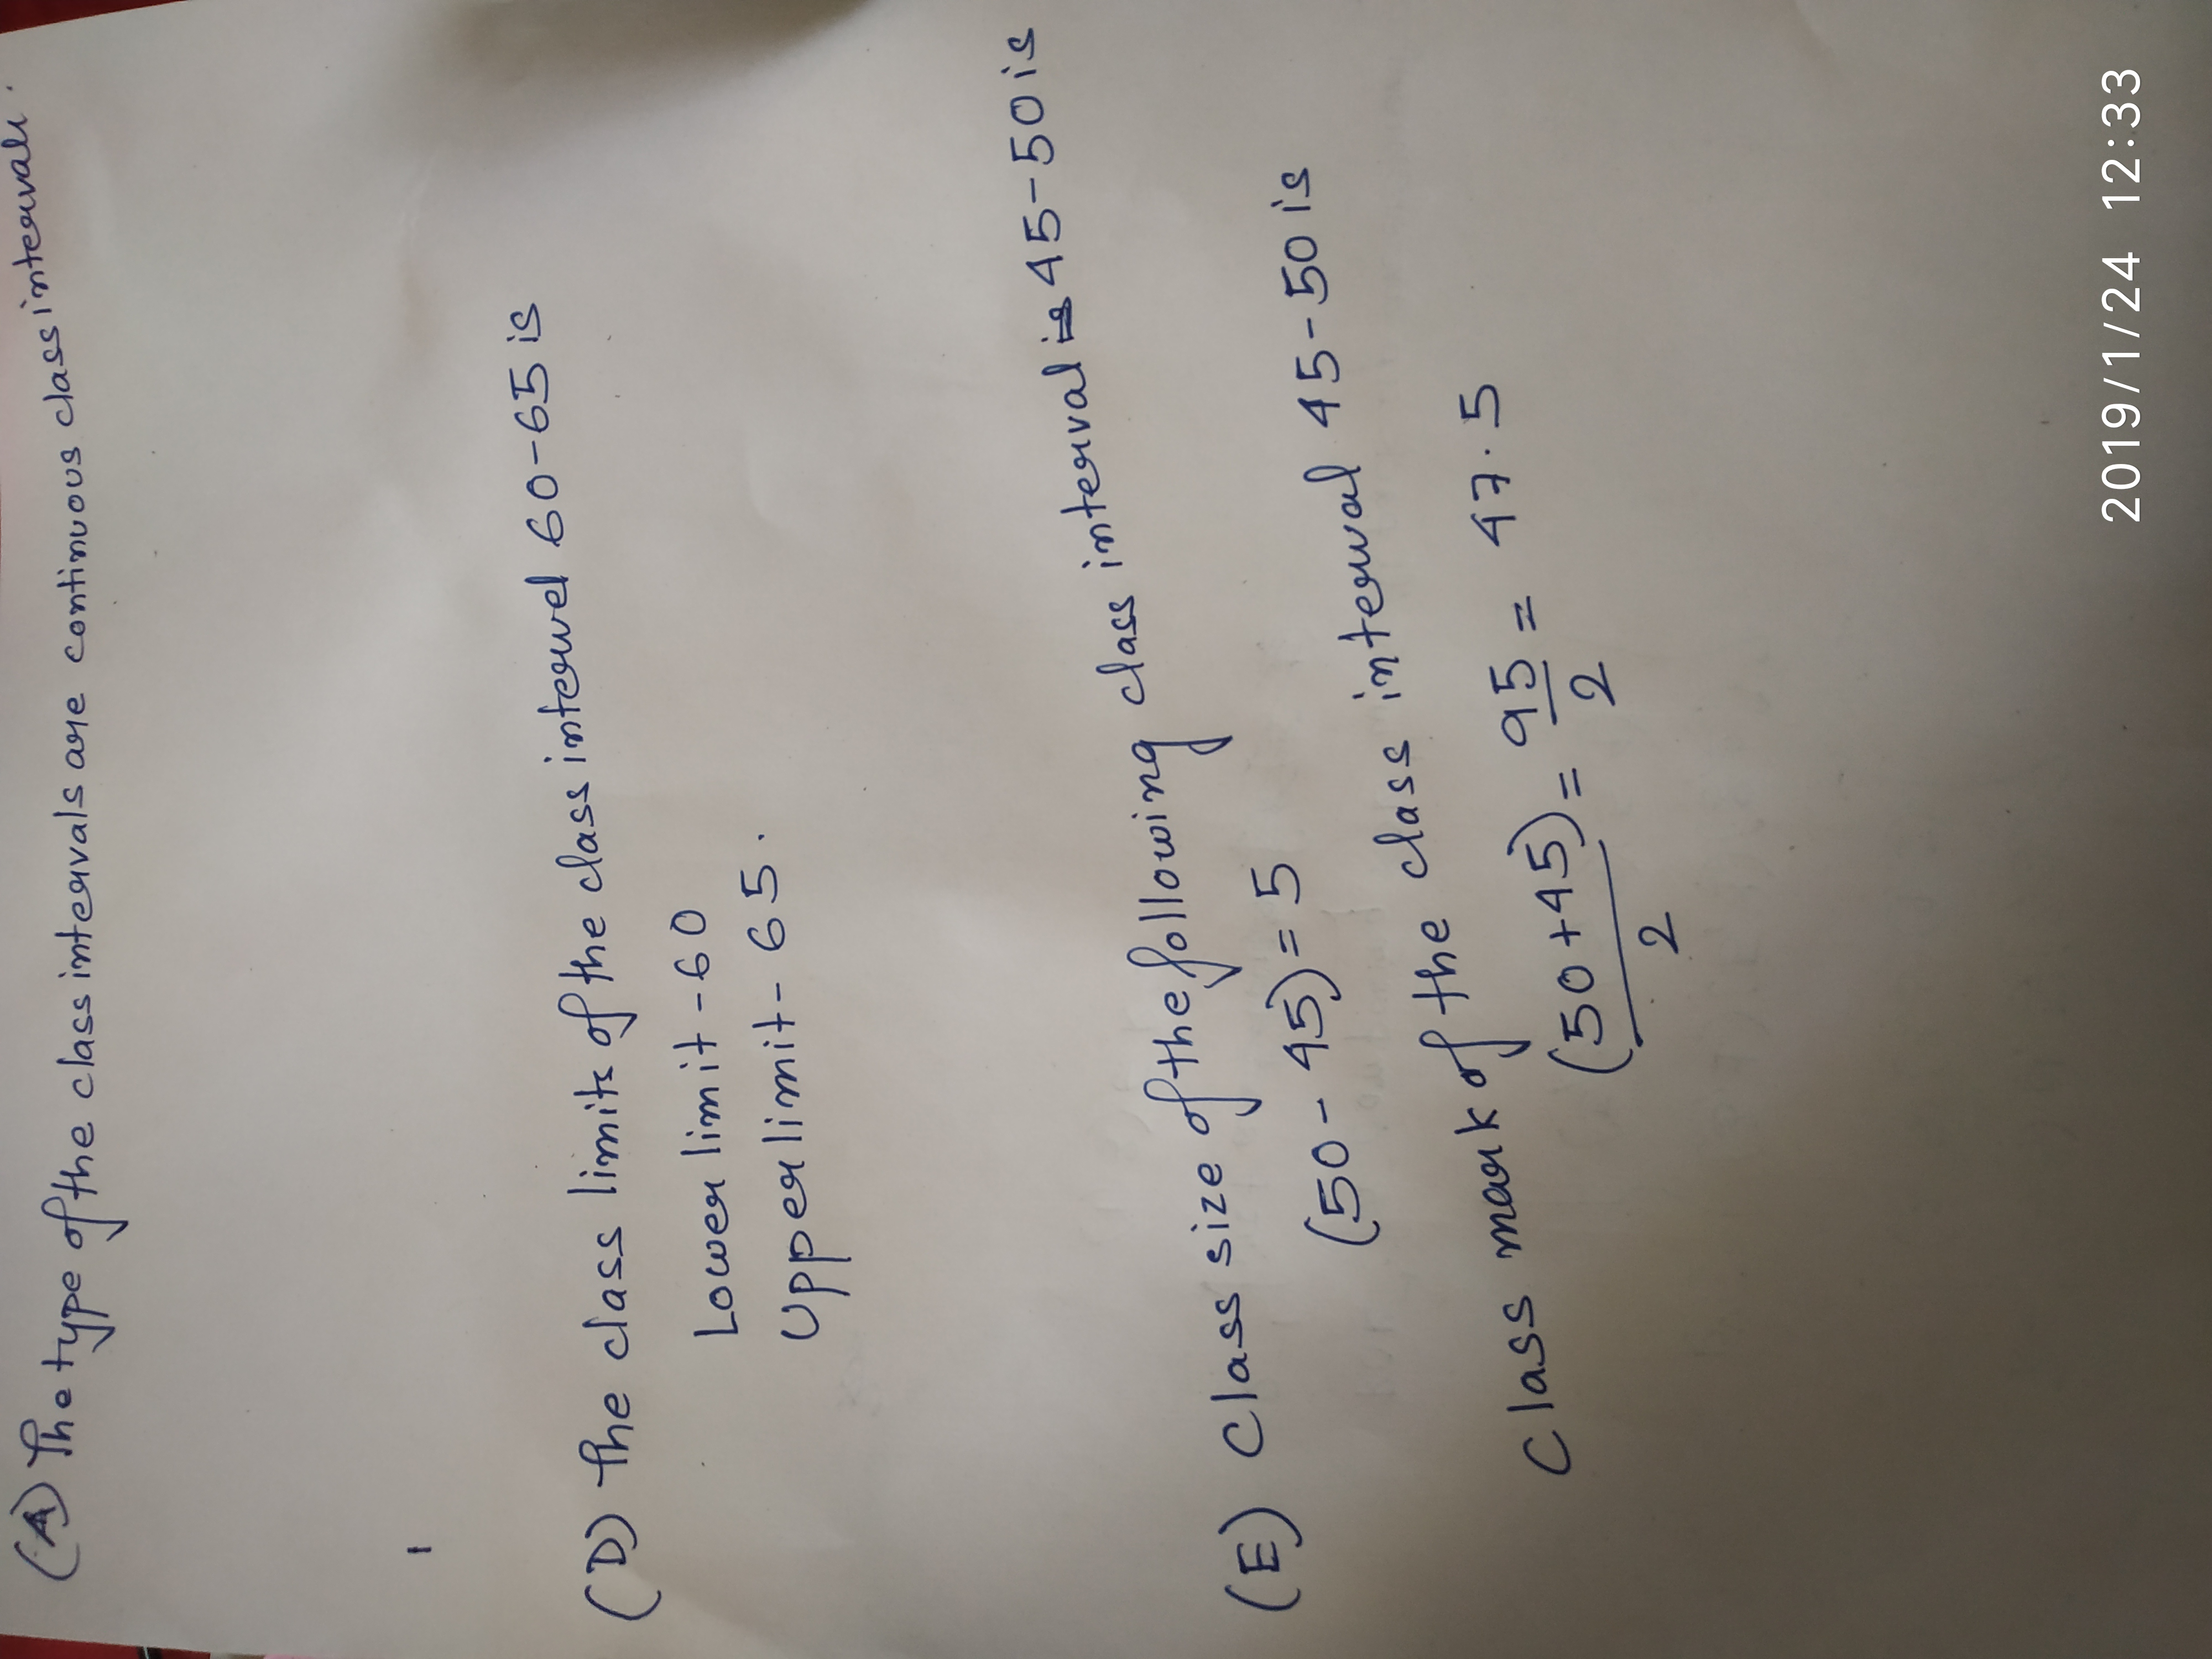
Time alloted for the preparation of an examination by some students is shown in the table. Draw a histogram to show the information.
| Time (minutes) | $$60-80$$ | $$80-100$$ | $$100-120$$ | $$120-140$$ | $$140-160$$ |
| No. of students | $$14$$ | $$20$$ | $$24$$ | $$22$$ | $$16$$ |
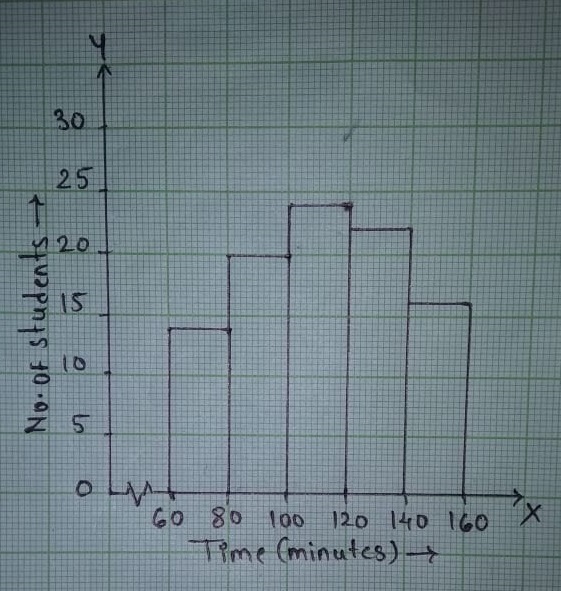
Find the class mark of class interval $$50-60.$$
The newspapers Hindu (H), Times of India (T), Indian Express (I), and Deccan chronicle (D) are read by 24 members are as follows:
H, H, I, D, T, H, T, D, I, T, D, D, H, I, T, H, D, I, D, D, H, I, T, T
Represent the above data in the form of a frequency distribution table.
H, H, I, D, T, H, T, D, I, T, D, D, H, I, T, H, D, I, D, D, H, I, T, T
Represent the above data in the form of a frequency distribution table.
If the class intervals of a frequency distribution be $$16-25, 26-35, 36-45, 46-55$$, then determine
(a) the class limits and class boundaries of the class $$36-45$$
(b) the class size and the class mark of the class interval $$26-35$$
(c) the class intervals when changed into overlapping class interval
The following table gives the distribution of students of two sections according the marks obtained by them:
| Section A | Section B | ||
| Marks | Frequency | Marks | Frequency |
| 0 - 10 10 - 20 20 - 30 30 - 40 40 - 50 | 3 9 17 12 9 | 0 - 10 10 - 20 20 - 30 30 - 40 40 - 50 | 5 19 15 10 1 |
| $$Marks$$ | $$Class-mark$$ | $$Section\,A\,frequency$$ | $$Section\,B\,frequency$$ |
| $$0-10$$ | $$5$$ | $$3$$ | $$5$$ |
| $$10-20$$ | $$15$$ | $$9$$ | $$19$$ |
| $$20-30$$ | $$25$$ | $$17$$ | $$15$$ |
| $$30-40$$ | $$35$$ | $$12$$ | $$10$$ |
| $$40-50$$ | $$45$$ | $$9$$ | $$1$$ |
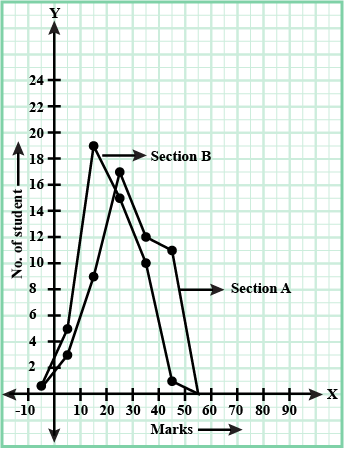
| C.I | 0-4 | 4-8 | 8-12 | 12-16 | 16-20 | 20-24 |
| frequency | 4 | 7 | 10 | 15 | 11 | 6 |
| $$C.I.$$ | $$class-mark$$ | $$Frequency$$ |
| Less than $$0$$ | $$0$$ | $$0$$ |
| $$0-4$$ | $$2$$ | $$4$$ |
| $$4-8$$ | $$6$$ | $$7$$ |
| $$8-12$$ | $$10$$ | $$10$$ |
| $$12-16$$ | $$14$$ | $$15$$ |
| $$16-20$$ | $$18$$ | $$11$$ |
| $$20-24$$ | $$22$$ | $$6$$ |
| More than $$24$$ | $$0$$ | $$0$$ |
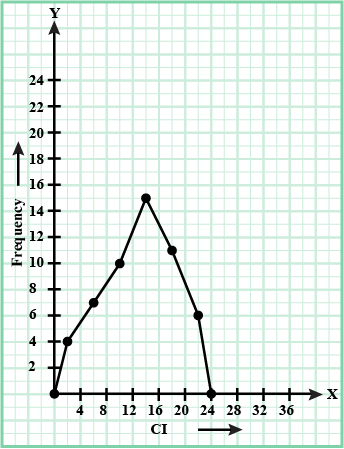
Weekly wages of 250 worker in a factory are given in the following table. Construct the histogram and frequeney polygon on the same graph for the data given:
| Weekly wage | 500-550 | 550-600 | 600-650 | 650-700 | 700-750 | 750-800 |
| No of worker | 30 | 42 | 50 | 55 | 45 | 28 |
| Weekly wages $$\left( \text{in Rs.} \right)$$ | No. of workers |
| $$500-550$$ | $$30$$ |
| $$550-600$$ | $$42$$ |
| $$600-650$$ | $$50$$ |
| $$650-700$$ | $$55$$ |
| $$700-750$$ | $$45$$ |
| $$750-800$$ | $$28$$ |
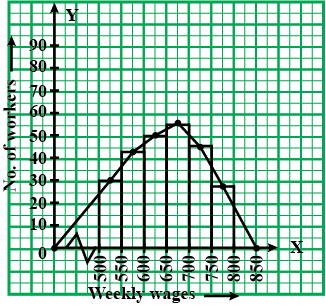
Draw a histogram for the following distribution table of marks scored by $$75$$ students of class $$IV$$:
| Marks obtained | $$0-10$$ | $$10-20$$ | $$20-40$$ | $$40-45$$ | $$45-60$$ | $$60-70$$ | $$70-85$$ |
| No. of students | $$4$$ | $$8$$ | $$20$$ | $$10$$ | $$12$$ | $$6$$ | $$15$$ |
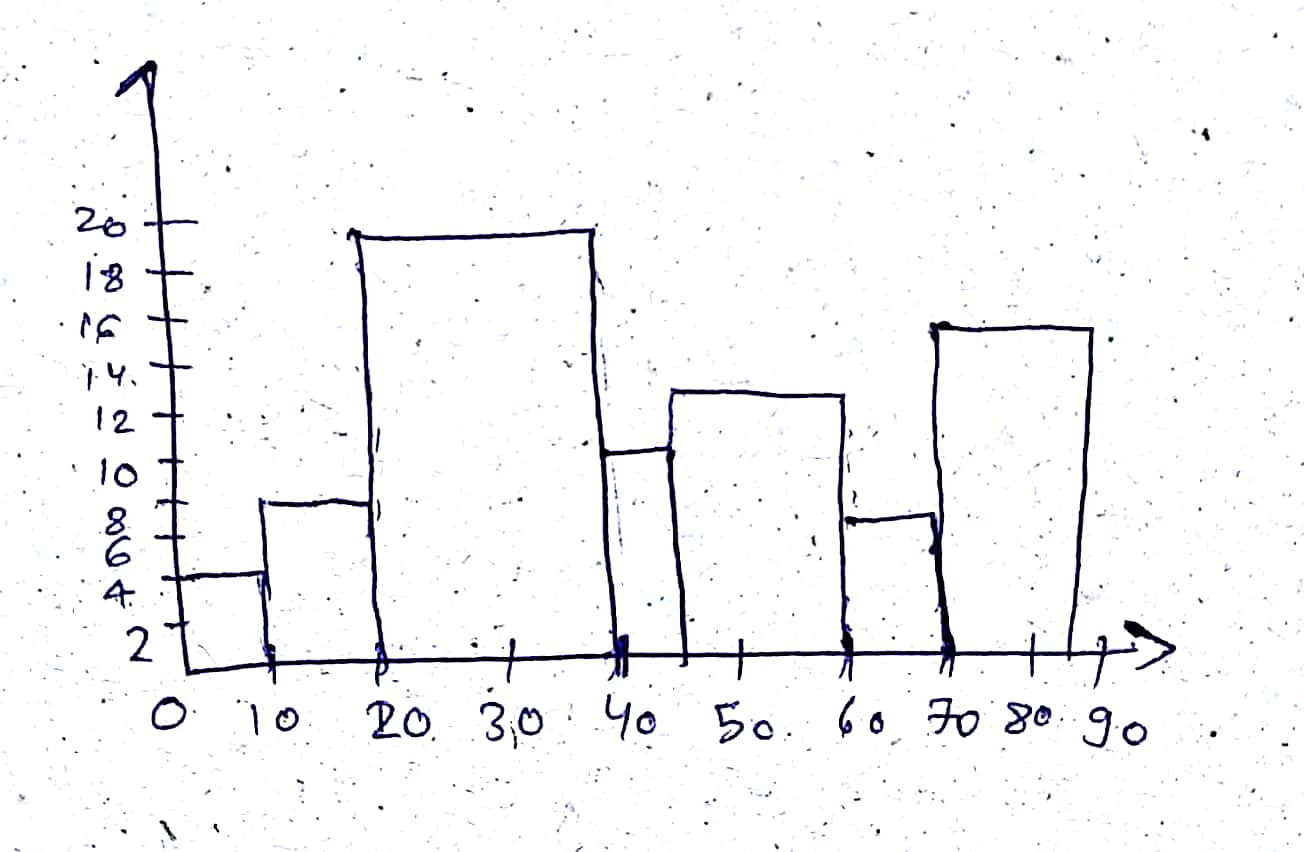
draw a histogram to represent the following data of the earnings of workers :
| Monthly earning | Number of workers |
| 80-120 | 4 |
| 120-160 | 7 |
| 160-200 | 13 |
| 200-240 | 8 |
| 240-280 | 5 |
| 280-320 | 2 |
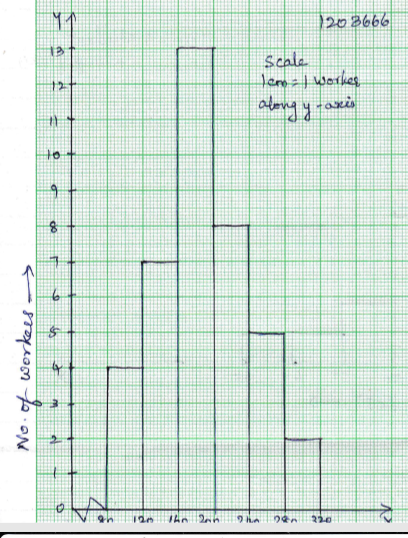
Following is the choice of 20 students of class VI of a school:
Banana, Apple, Guava, Orange, Apple, Banana, Orange, Guava, Banana, Guava, Banana, Banana, Apple, Banana, Apple, Banana, Orange, Guava, Apple, Banana, Guava, Banana.
(i) Arrange the name of fruits in a table using tally marks.
(ii) Which fruit is liked by maximum number of students?
(iii) Which fruit is liked by minimum number of students?
(ii) Frequency is maximum for Banana. Hence, banana is most liked fruit.
(iii) Frequency is minimum for Orange. Hence, orange is least liked fruit.
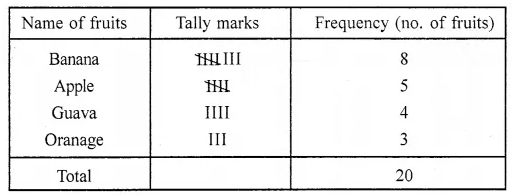
If class mark is $$25$$ and class width is $$10$$, then find the class.
For a given frequency distribution, $$Z + M = 34$$ and $$M + \bar{x} = 40$$. Then, find $$M$$.
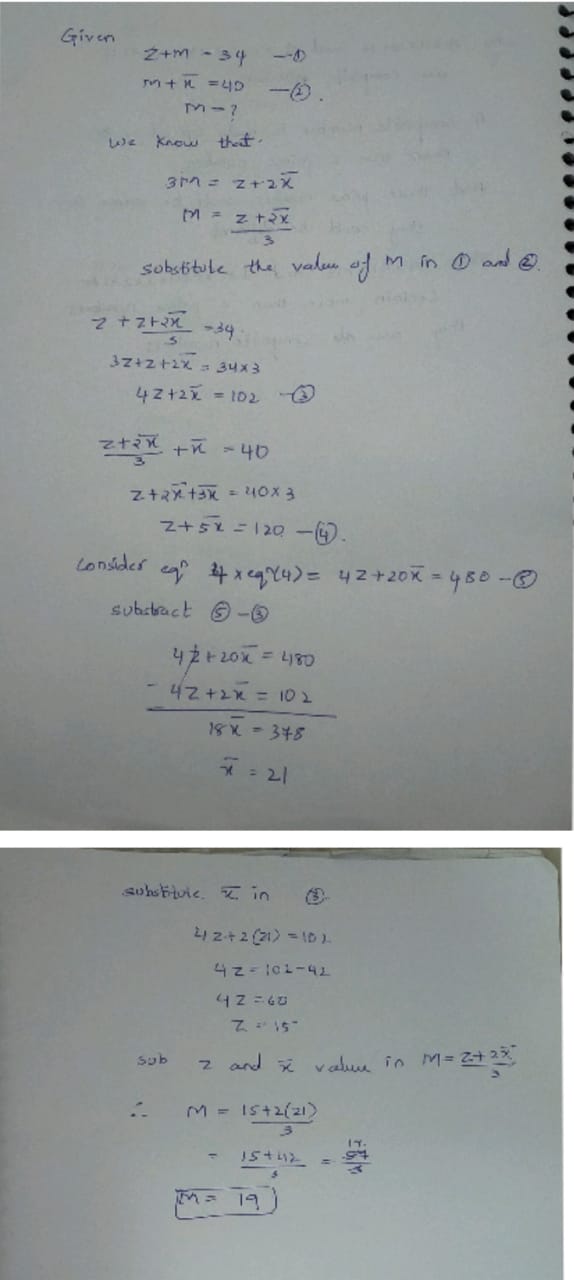
In certain towns, literacy rate (in %) is given in the following table:
| Literacy rate (in %) | 10-20 | 20-30 | 30-40 | 40-50 | 50-60 | 60-70 | 70-80 | 80-90 |
| Number of towns | 5 | 8 | 10 | x | 15 | 8 | y | 6 |
If mode of the data is $$53\% $$, find the missing frequencies, when if is given that sum of the frequencies is $$70$$.
Class intervals in a grouped frequency distribution are given as $$4 - 11,12 - 19,20 - 27$$ $$28 - 35,36 - 43 .$$ Write the next two class intervals.
The following are the daily expeditures (in $$Rs$$) of $$30$$ student in a school.
| Ependiture (in $$Rs$$) | No. of students |
| $$10-15$$ | $$3$$ |
| $$15-20$$ | $$5$$ |
| $$20-25$$ | $$10$$ |
| $$25-30$$ | $$6$$ |
| $$30-35$$ | $$4$$ |
| $$35-40$$ | $$2$$ |
| Total | $$30$$ |
Show the following data by a frequency polygon.
| Electricity bill ($$Rs$$) | $$0-200$$ | $$200-400$$ | $$400-600$$ | $$600-800$$ | $$800-1000$$ |
| Families | $$240$$ | $$300$$ | $$450$$ | $$350$$ | $$160$$ |
| Electricity Bill | x | F |
| 0-200 200-400 400-600 600-800 800-1000 | 100 300 500 700 900 | 240 300 450 350 160 |
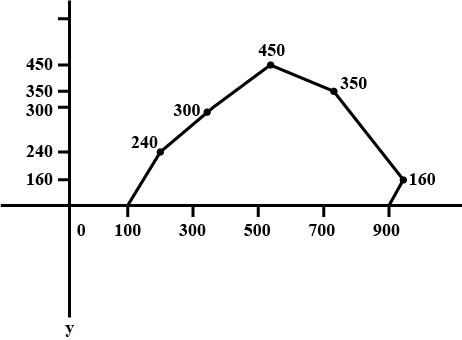
The median of the following data is $$525$$. Finds the values of $$x$$ and $$y$$ if the total frequency is $$100$$.
| Class interval | Frequency |
| $$0-100$$ | $$2$$ |
| $$100-200$$ | $$5$$ |
| $$200-300$$ | $$x$$ |
| $$300-400$$ | $$12$$ |
| $$400-500$$ | $$17$$ |
| $$500-600$$ | $$20$$ |
| $$600-700$$ | $$y$$ |
| $$700-800$$ | $$9$$ |
| $$800-900$$ | $$7$$ |
| $$900-1000$$ | $$4$$ |
The blood groups of 30 students of class X are: AB, O, O, A, B, O, A,O, B, A, O, B, A, O, O, A, AB, O, A, A, O, O, B, O, B, A, B, O.
i) Prepare a frequency distribution table from the data.
ii) Which is the most common and which is the rarest blood among these students ?
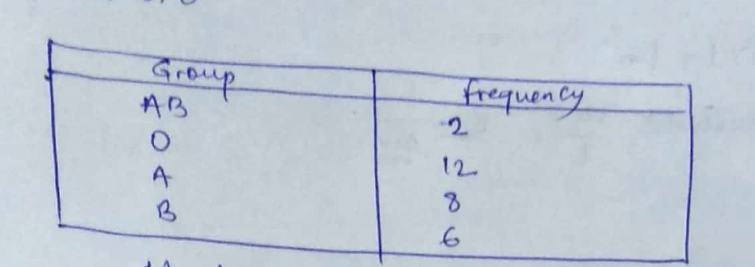
Three dice were thrown, the outcomes are noted and added (The results can be $$3,4,5,6 , \dots , 18$$). Four players played the game $$10$$ times each. Their scores were:
$$5,7,9,8,6,4,6,12,15,18,17,12,10,3,13,7,11,17,10,5 ,$$
$$4,6,8,16,18,14,6,18,9,10,15,14,3,7,9,17,11,4,12,16$$.
Divide this data into class intervals of size $$3$$ and draw a histogram.
| Players | Outcomes |
| $$3-6$$ | $$7$$ |
| $$6-9$$ | $$9$$ |
| $$9-12$$ | $$8$$ |
| $$12-15$$ | $$6$$ |
| $$15-18$$ | $$7$$ |
| $$18-21$$ | $$3$$ |
| Total | $$40$$ |
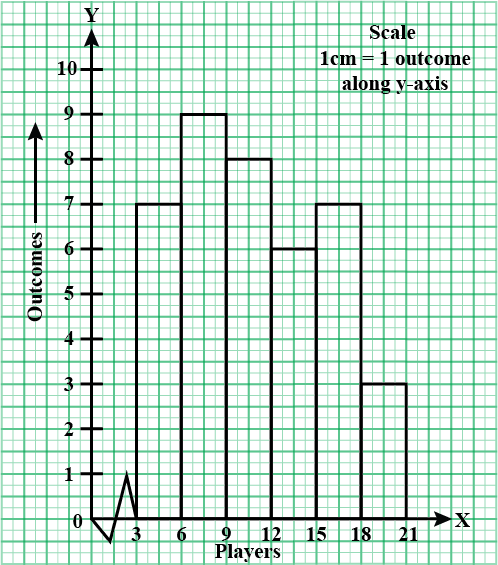
Draw a histogram to represent the following data :
| Marks obtained | $$0-10$$ | $$10-20$$ | $$20-30$$ | $$30-40$$ | $$40-50$$ | $$50-60$$ |
| No. of student | $$4$$ | $$7$$ | $$12$$ | $$20$$ | $$9$$ | $$2$$ |
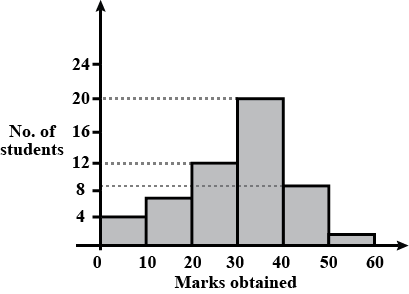
Use the table given below to find:
(a) The actual class limits of the fourth class
(b) The class boundaries of the sixth class.
(c) The class mark of the third class.
(d) The upper and lower limits of the fifth class.
(e) The size of the third class.
| Class interval | $$30-34$$ | $$35-39$$ | $$40-44$$ | $$45-49$$ | $$50-54$$ | $$55-59$$ |
| Frequency | $$7$$ | $$10$$ | $$12$$ | $$13$$ | $$8$$ | $$4$$ |
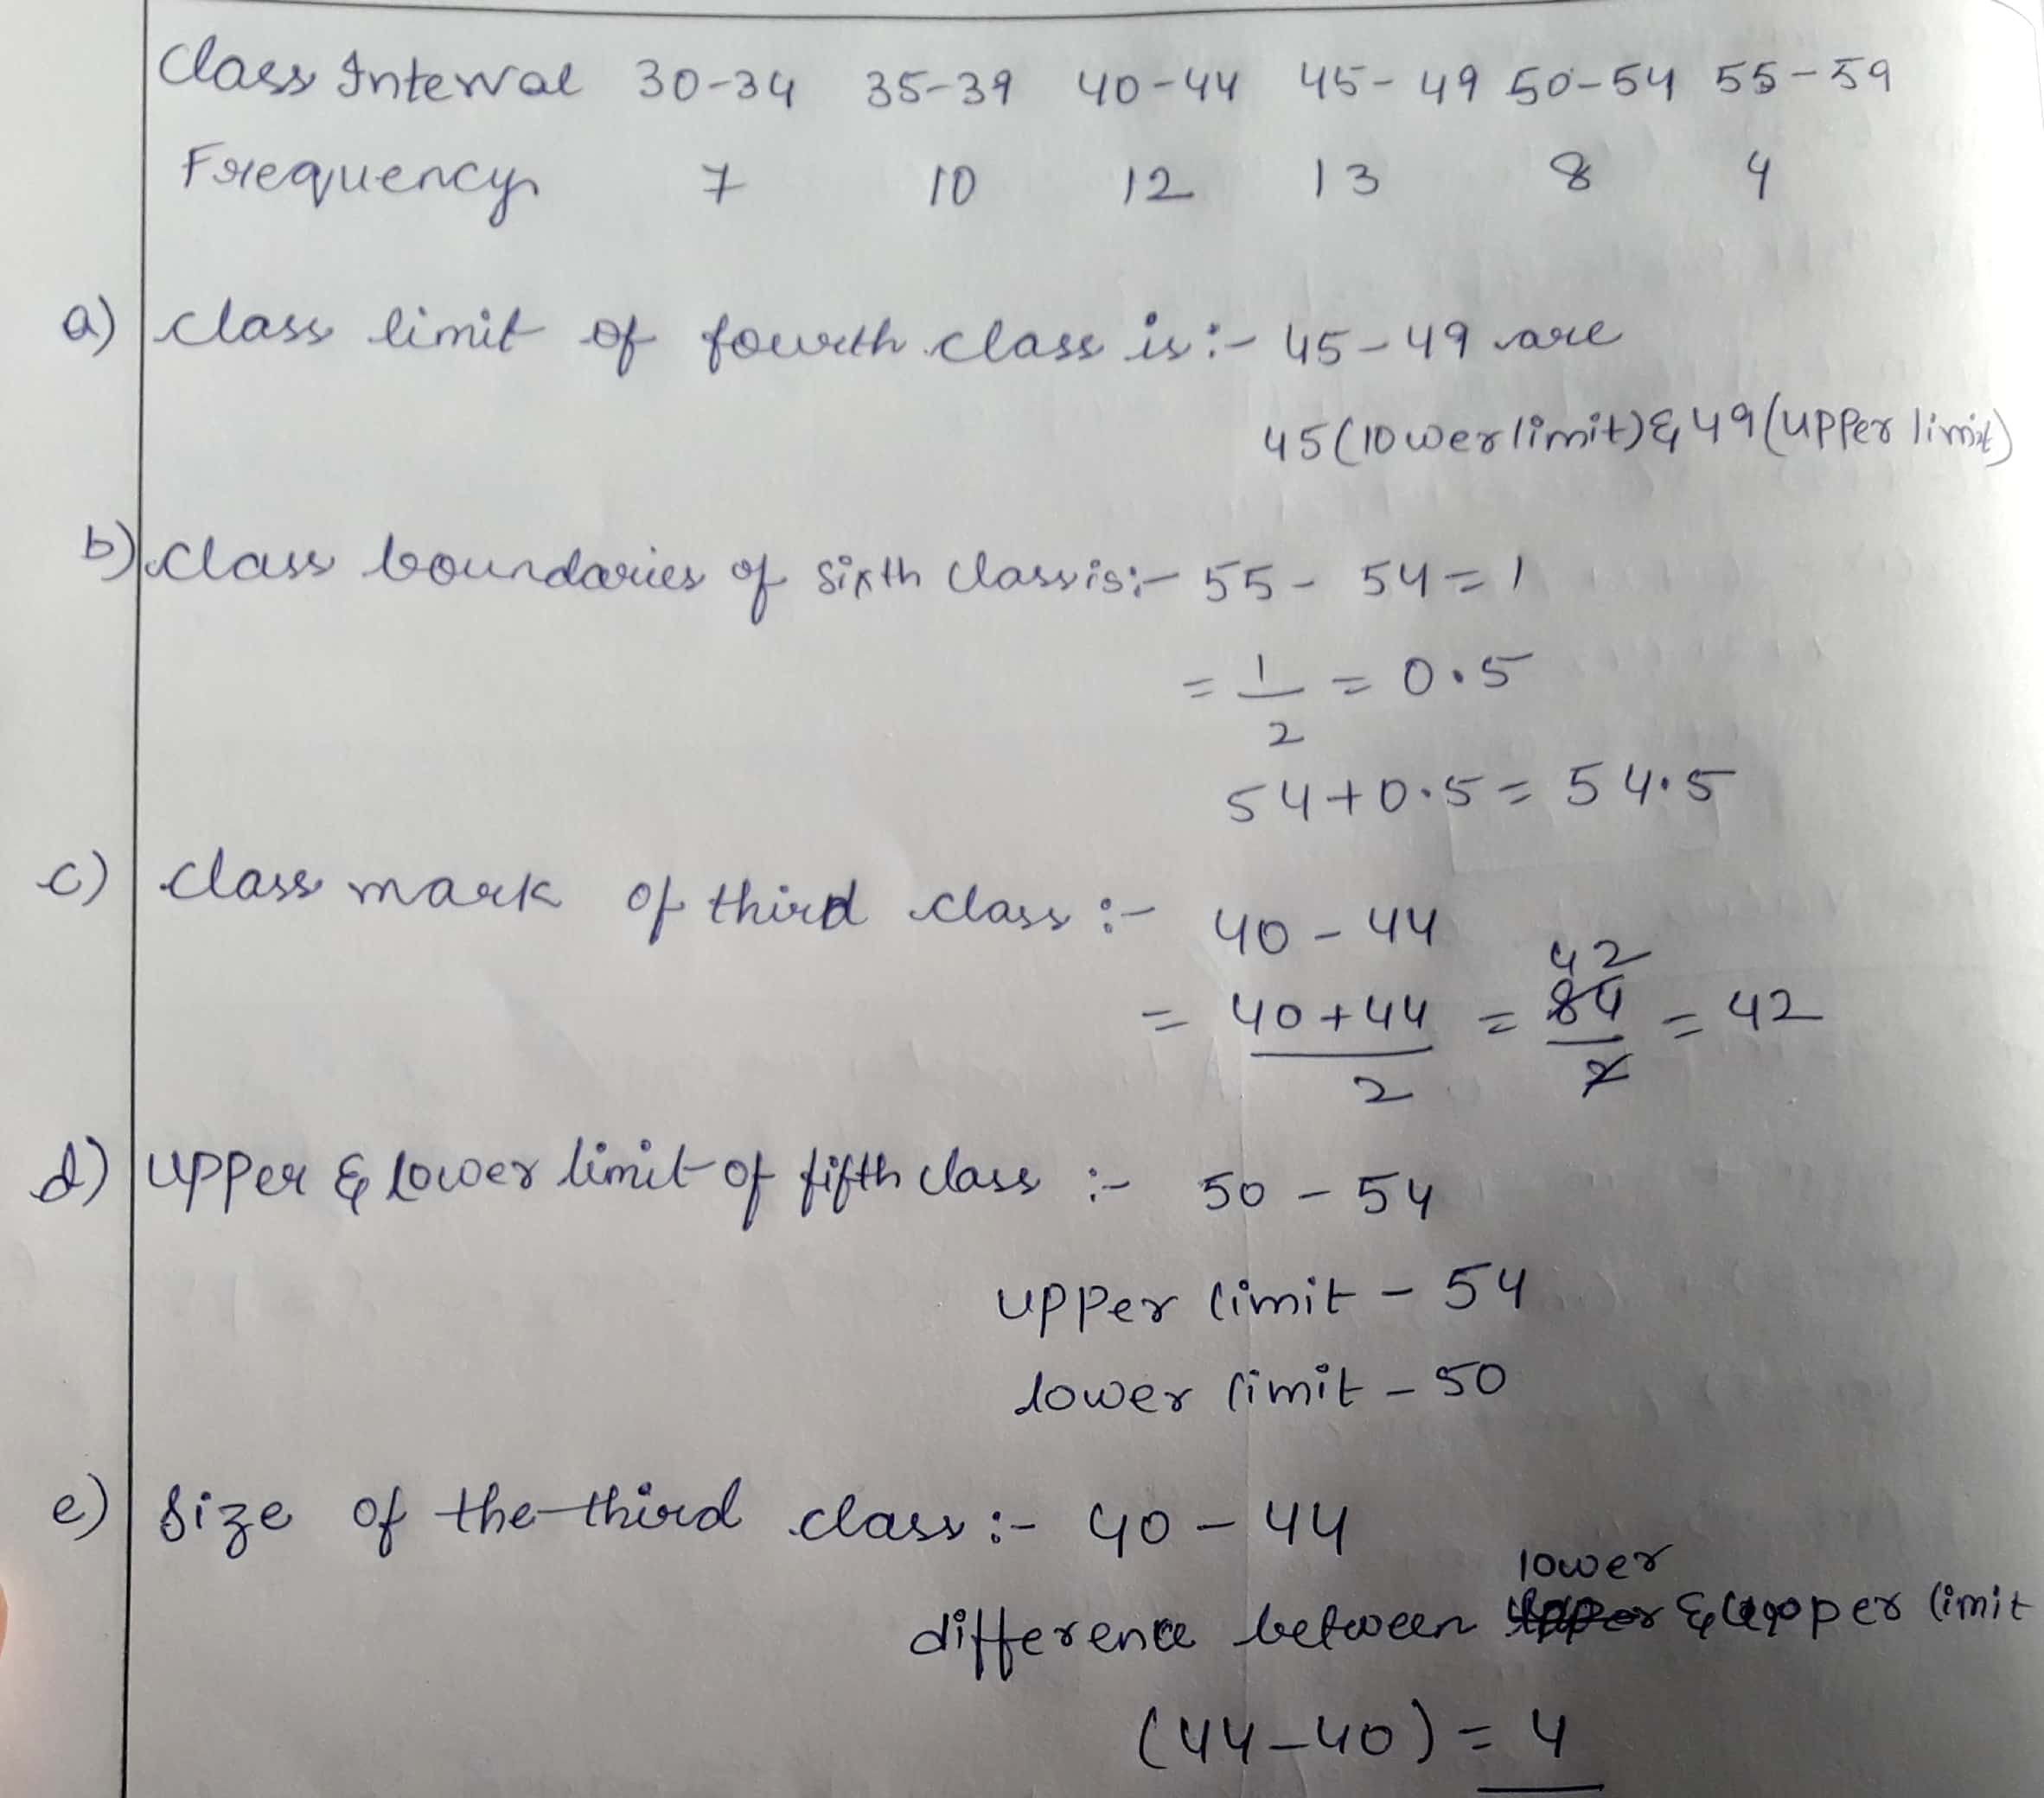
The following table gives the distribution of 45 students across the different levels of intelligent quotient. Draw the histogram for the data.
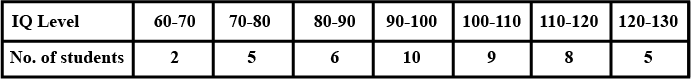
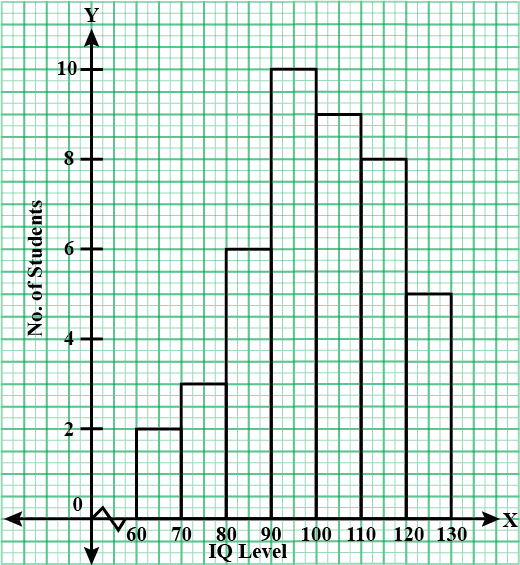
The following table shows the utilisation of electricity for difference appliances in a home. Represent the information using a pie chart.
| Appliances | Lamps | Freeze | Geiser | Other |
| Utilisation of electricity | $$35\%$$ | $$20\%$$ | $$15\%$$ | $$30\%$$ |
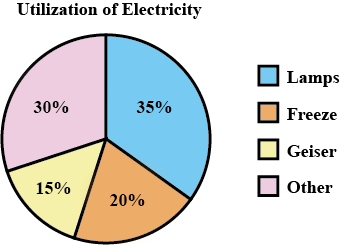
Represent the following data by histogram.
| Price of Sugar per kg | 18-20 | 20-22 | 22-24 | 24-26 | 26-28 |
| No. of weeks | 4 | 8 | 22 | 12 | 6 |
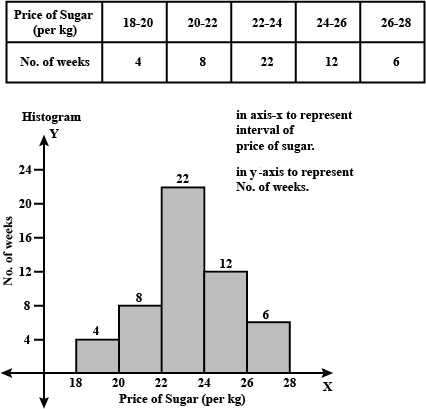
Marks secured by $$60$$ students of a class in a test are given below.
Draw histogram for the given data. Marks $$0 - 10 $$ $$10 - 20$$ $$20 - 30 $$ $$30 - 40$$ $$40 - 50$$ $$50 - 60 $$ Number of students $$7$$ $$10$$ $$14$$ $$20$$ $$6$$ $$3$$
| Marks | $$0 - 10 $$ | $$10 - 20$$ | $$20 - 30 $$ | $$30 - 40$$ | $$40 - 50$$ | $$50 - 60 $$ |
| Number of students | $$7$$ | $$10$$ | $$14$$ | $$20$$ | $$6$$ | $$3$$ |
Marks are taken on $$X$$ -axis.
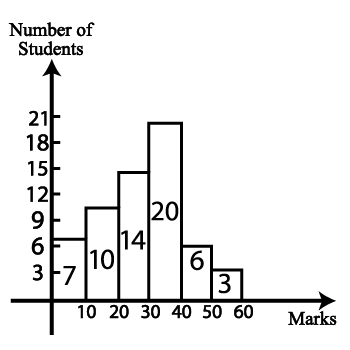
The median of the data in the following table is $$27$$. Find the missing frequencies $$f_{1}$$ and $$f_{2}$$
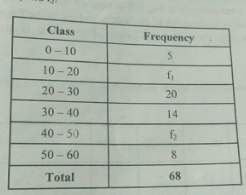
The performance of Tanik during the two terms in different subjects is as given in the table.
| English | Hindi | Maths | Science | S.Studies | |
| 1st term | 75 | 68 | 80 | 85 | 78 |
| 2nd term | 72 | 75 | 85 | 90 | 82 |
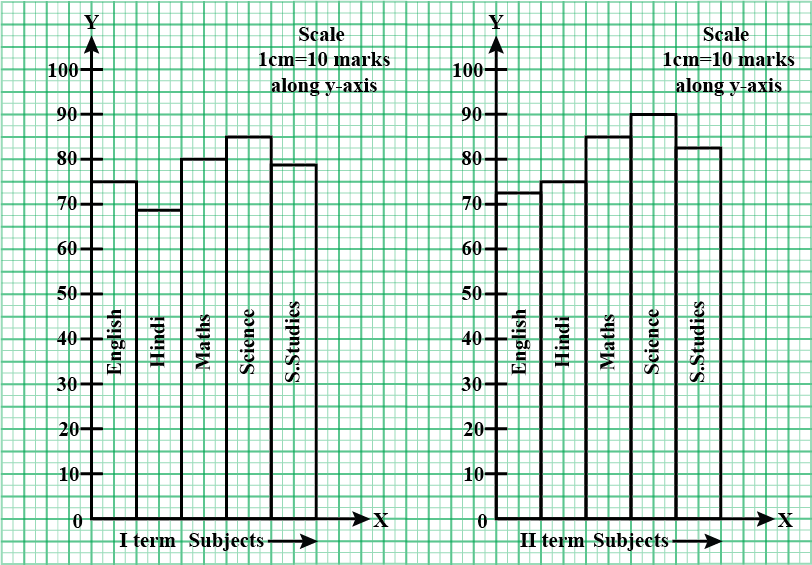
Prepare a continuous grouped frequency distribution from the following data:
Mid-point 5 15 25 35 43
Frequency 4 8 13 12 6
Also find the size of class intervals.
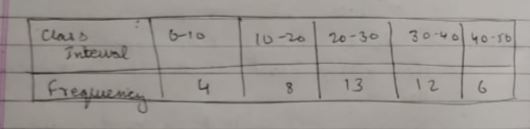
Convert the following frequency table into a continuous grouped frequency table:
| Class interval | Frequency |
| $$75-79$$ | $$8$$ |
| $$80-84$$ | $$10$$ |
| $$85-89$$ | $$6$$ |
| $$90-94$$ | $$5$$ |
Draw a histogram to represent the following data:
| Pocket money (in $$Rs$$) | $$150-200$$ | $$200-250$$ | $$250-300$$ | $$300-350$$ | $$350-400$$ |
| Number of students | $$10$$ | $$5$$ | $$7$$ | $$4$$ | $$3$$ |
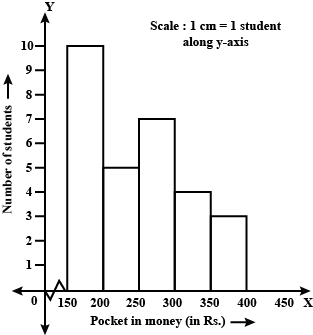
A total of $$20$$ patients admitted to a hospital have blood sugar levels as given below :
$$67, 69, 74, 73, 70, 70,71, 68, 73, 74, 73,75, 69, 72, 70, 70, 72, 70, 73, 74$$. Make a frequency table.
Calculate crude death rates (CDR) for district A:
| Age group (in years) | number of person (in thousand ) | Number of death |
| $$0-15$$ | $$1$$ | $$20$$ |
| $$15-60$$ | $$3$$ | $$30$$ |
| $$60$$ and above | $$2$$ | $$40$$ |
Find the difference between the population of $$1961$$ and $$1971$$
| Year | $$1931$$ | $$1941$$ | $$1951$$ | $$1961$$ | $$1971$$ |
| Population (in crores) | $$23$$ | $$32$$ | $$35$$ | $$44$$ | $$54$$ |
Without drawing a histogram construct a frequency polygon for the given frequency distribution.
| Class interval | 0-10 | 10-20 | 20-30 | 30-40 | 40-50 |
| frequency | 50 | 40 | 45 | 25 | 5 |
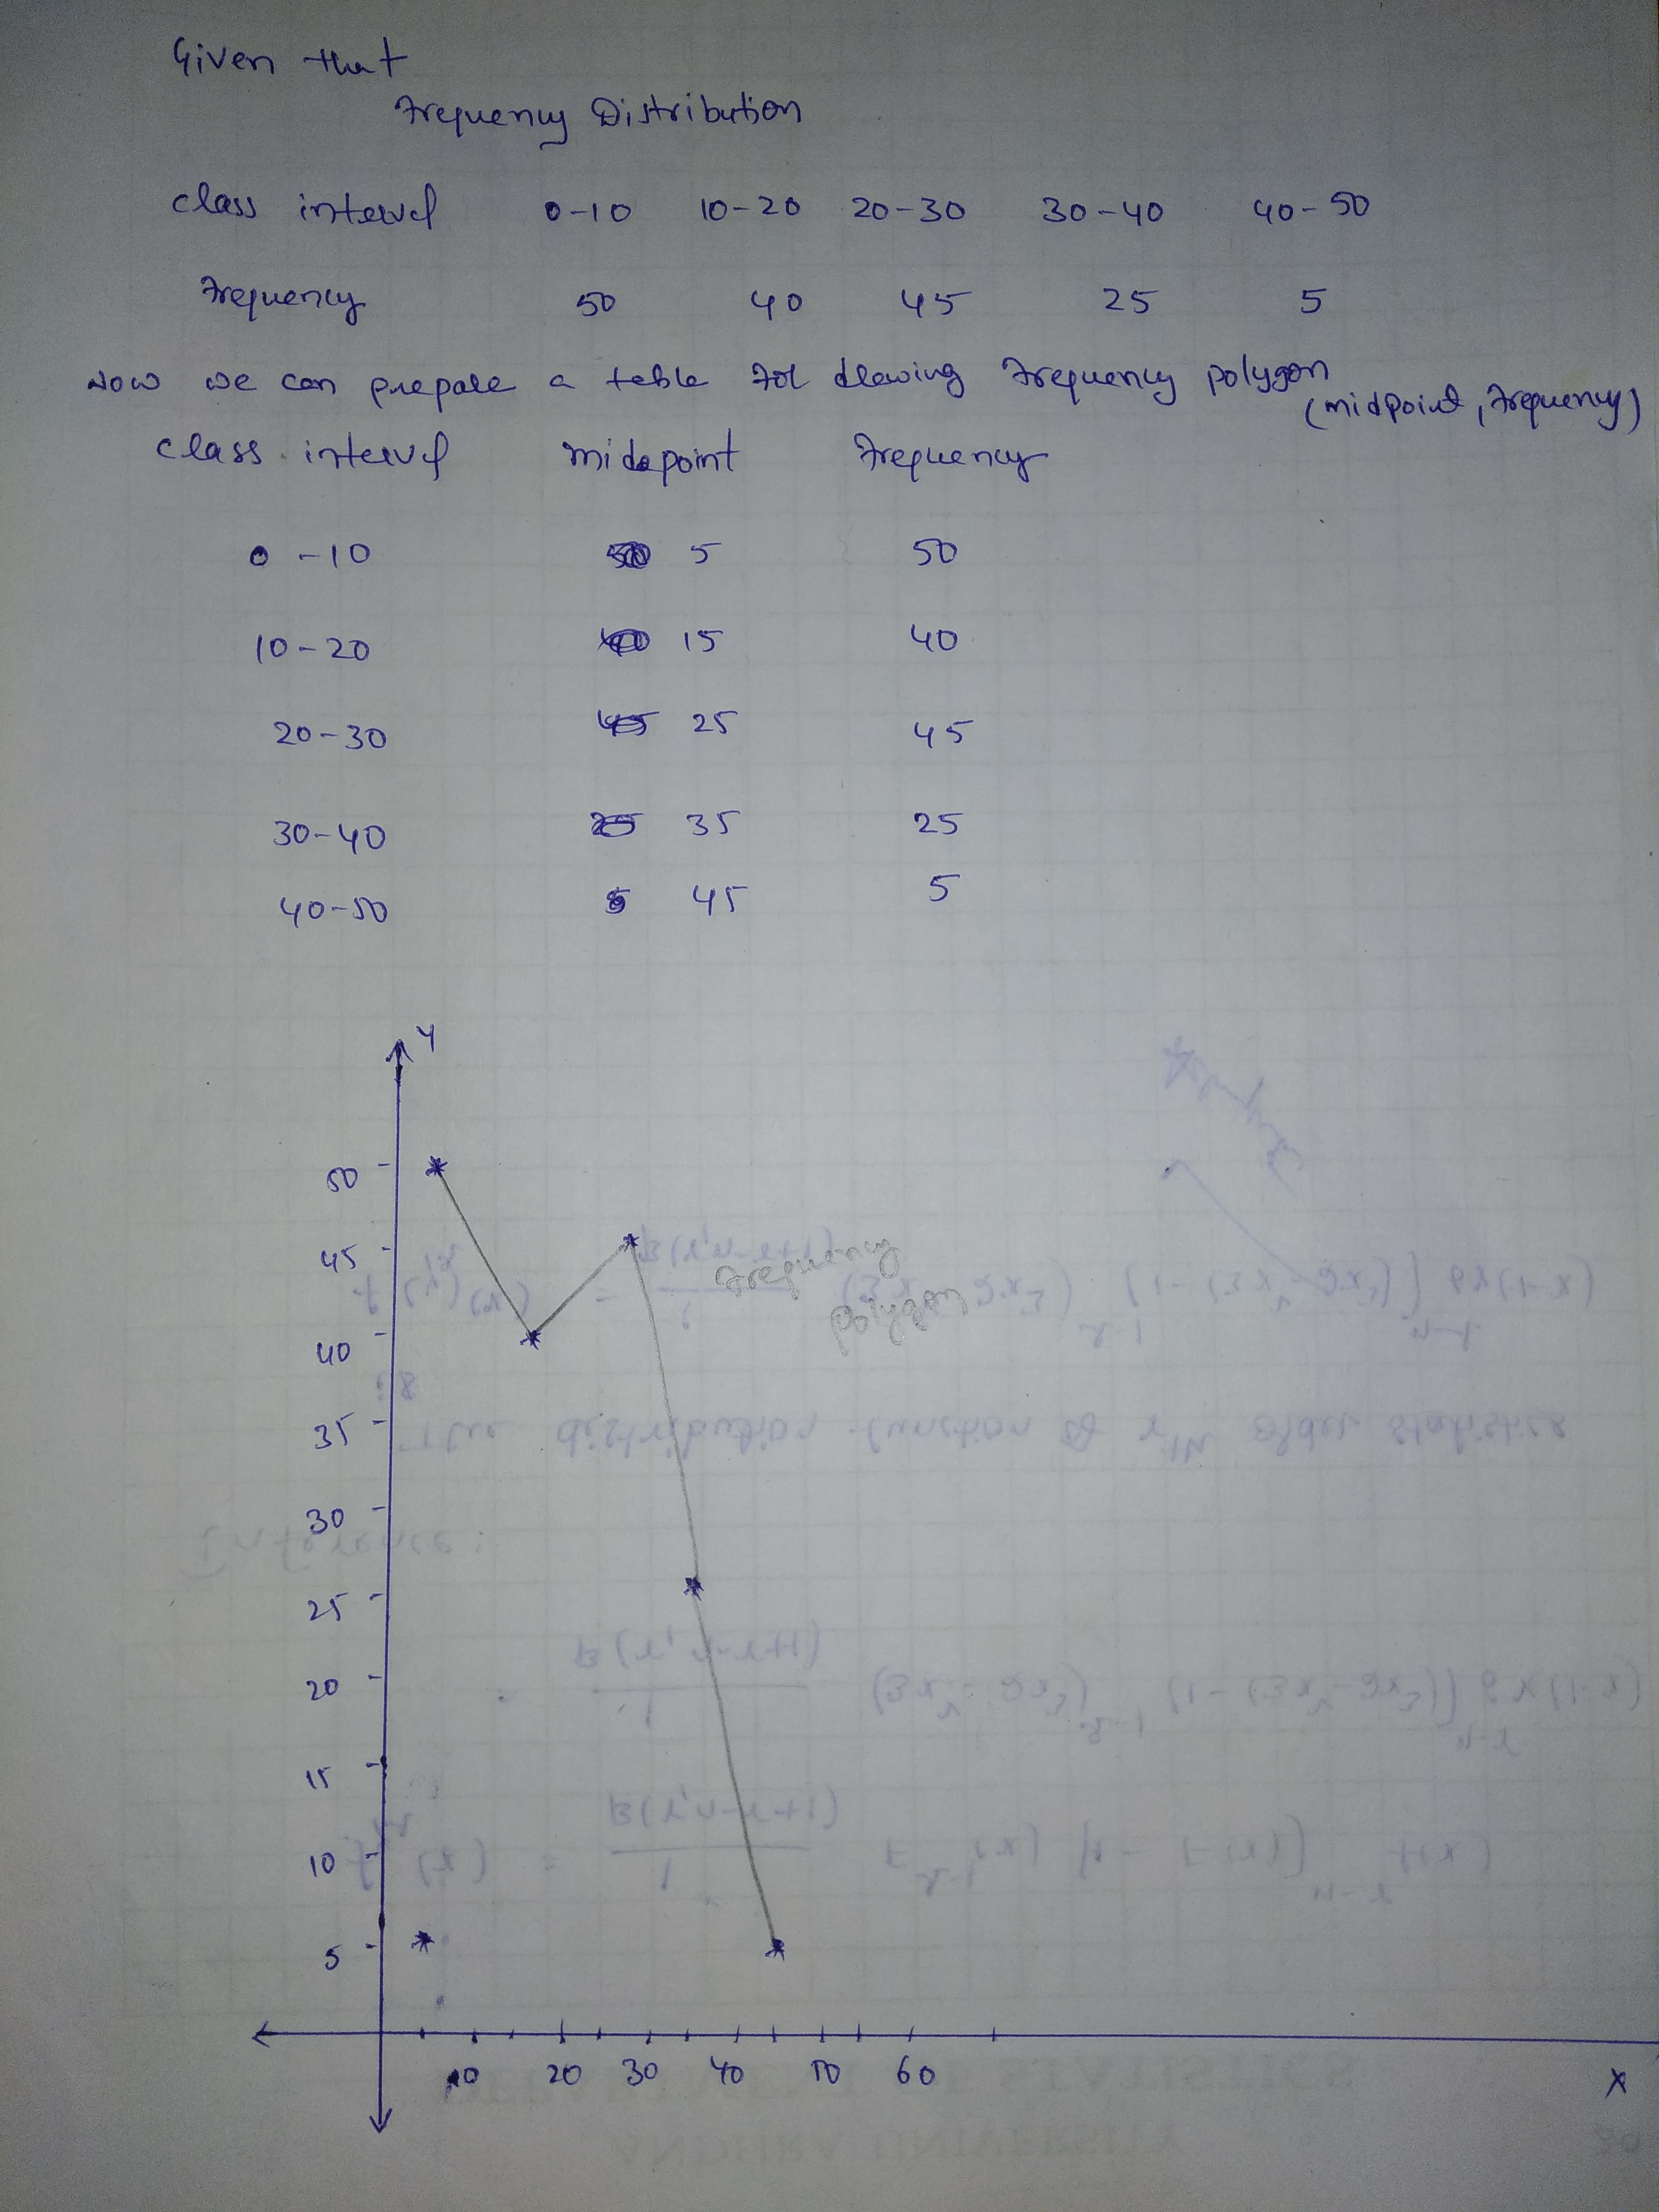
The following data gives the marks of 20 students in Mathematics (X) and statistics (Y), each out of 10, expressed as (x, y). Construct an ungrouped frequency distribution, considering single numbers as a class:
(2, 7), (3, 8), (4, 9), (2, 8), (5, 6), (5, 7), (4, 9), (3, 8), (4, 8), (2, 9), (3, 8), (4, 8), (5, 6), (4, 7),(4, 7), (4, 6), (5, 6), (5, 7), (4, 6), (5, 5).
Marks secured by $$60$$ students of a class in a test are given below. Draw histogram for the given data.
| Marks | 0-10 | 10-20 | 20-30 | 30-40 | 40-50 | 50-60 |
| No. of Students | 7 | 10 | 14 | 20 | 6 | 3 |
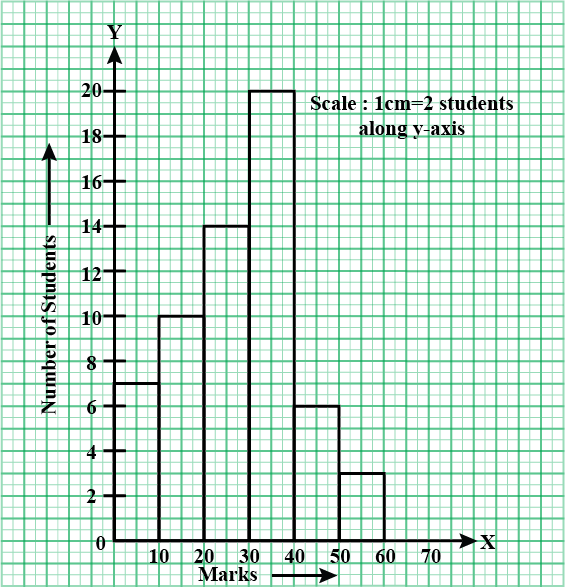
The number of rooms in 25 houses of a locality is as given below:
$$4,3,2,6,4,3,2,1,5,3,2,3,4,3,5,1,6,1,3,4,2,3,4,3,5$$
Construct a frequency distribution table for the above data.
Among the group of students, $$10\%$$ scored marks below $$20,\ 20\%$$ scored marks between $$20$$ and $$40,\ 35\%$$ scored marks between $$40$$ and $$60,\ 20\%$$ scored marks between $$60$$ and $$80.$$ The remaining $$30$$ students scored marks between $$80$$ and $$100$$. Prepare frequency distribution table from the above information.
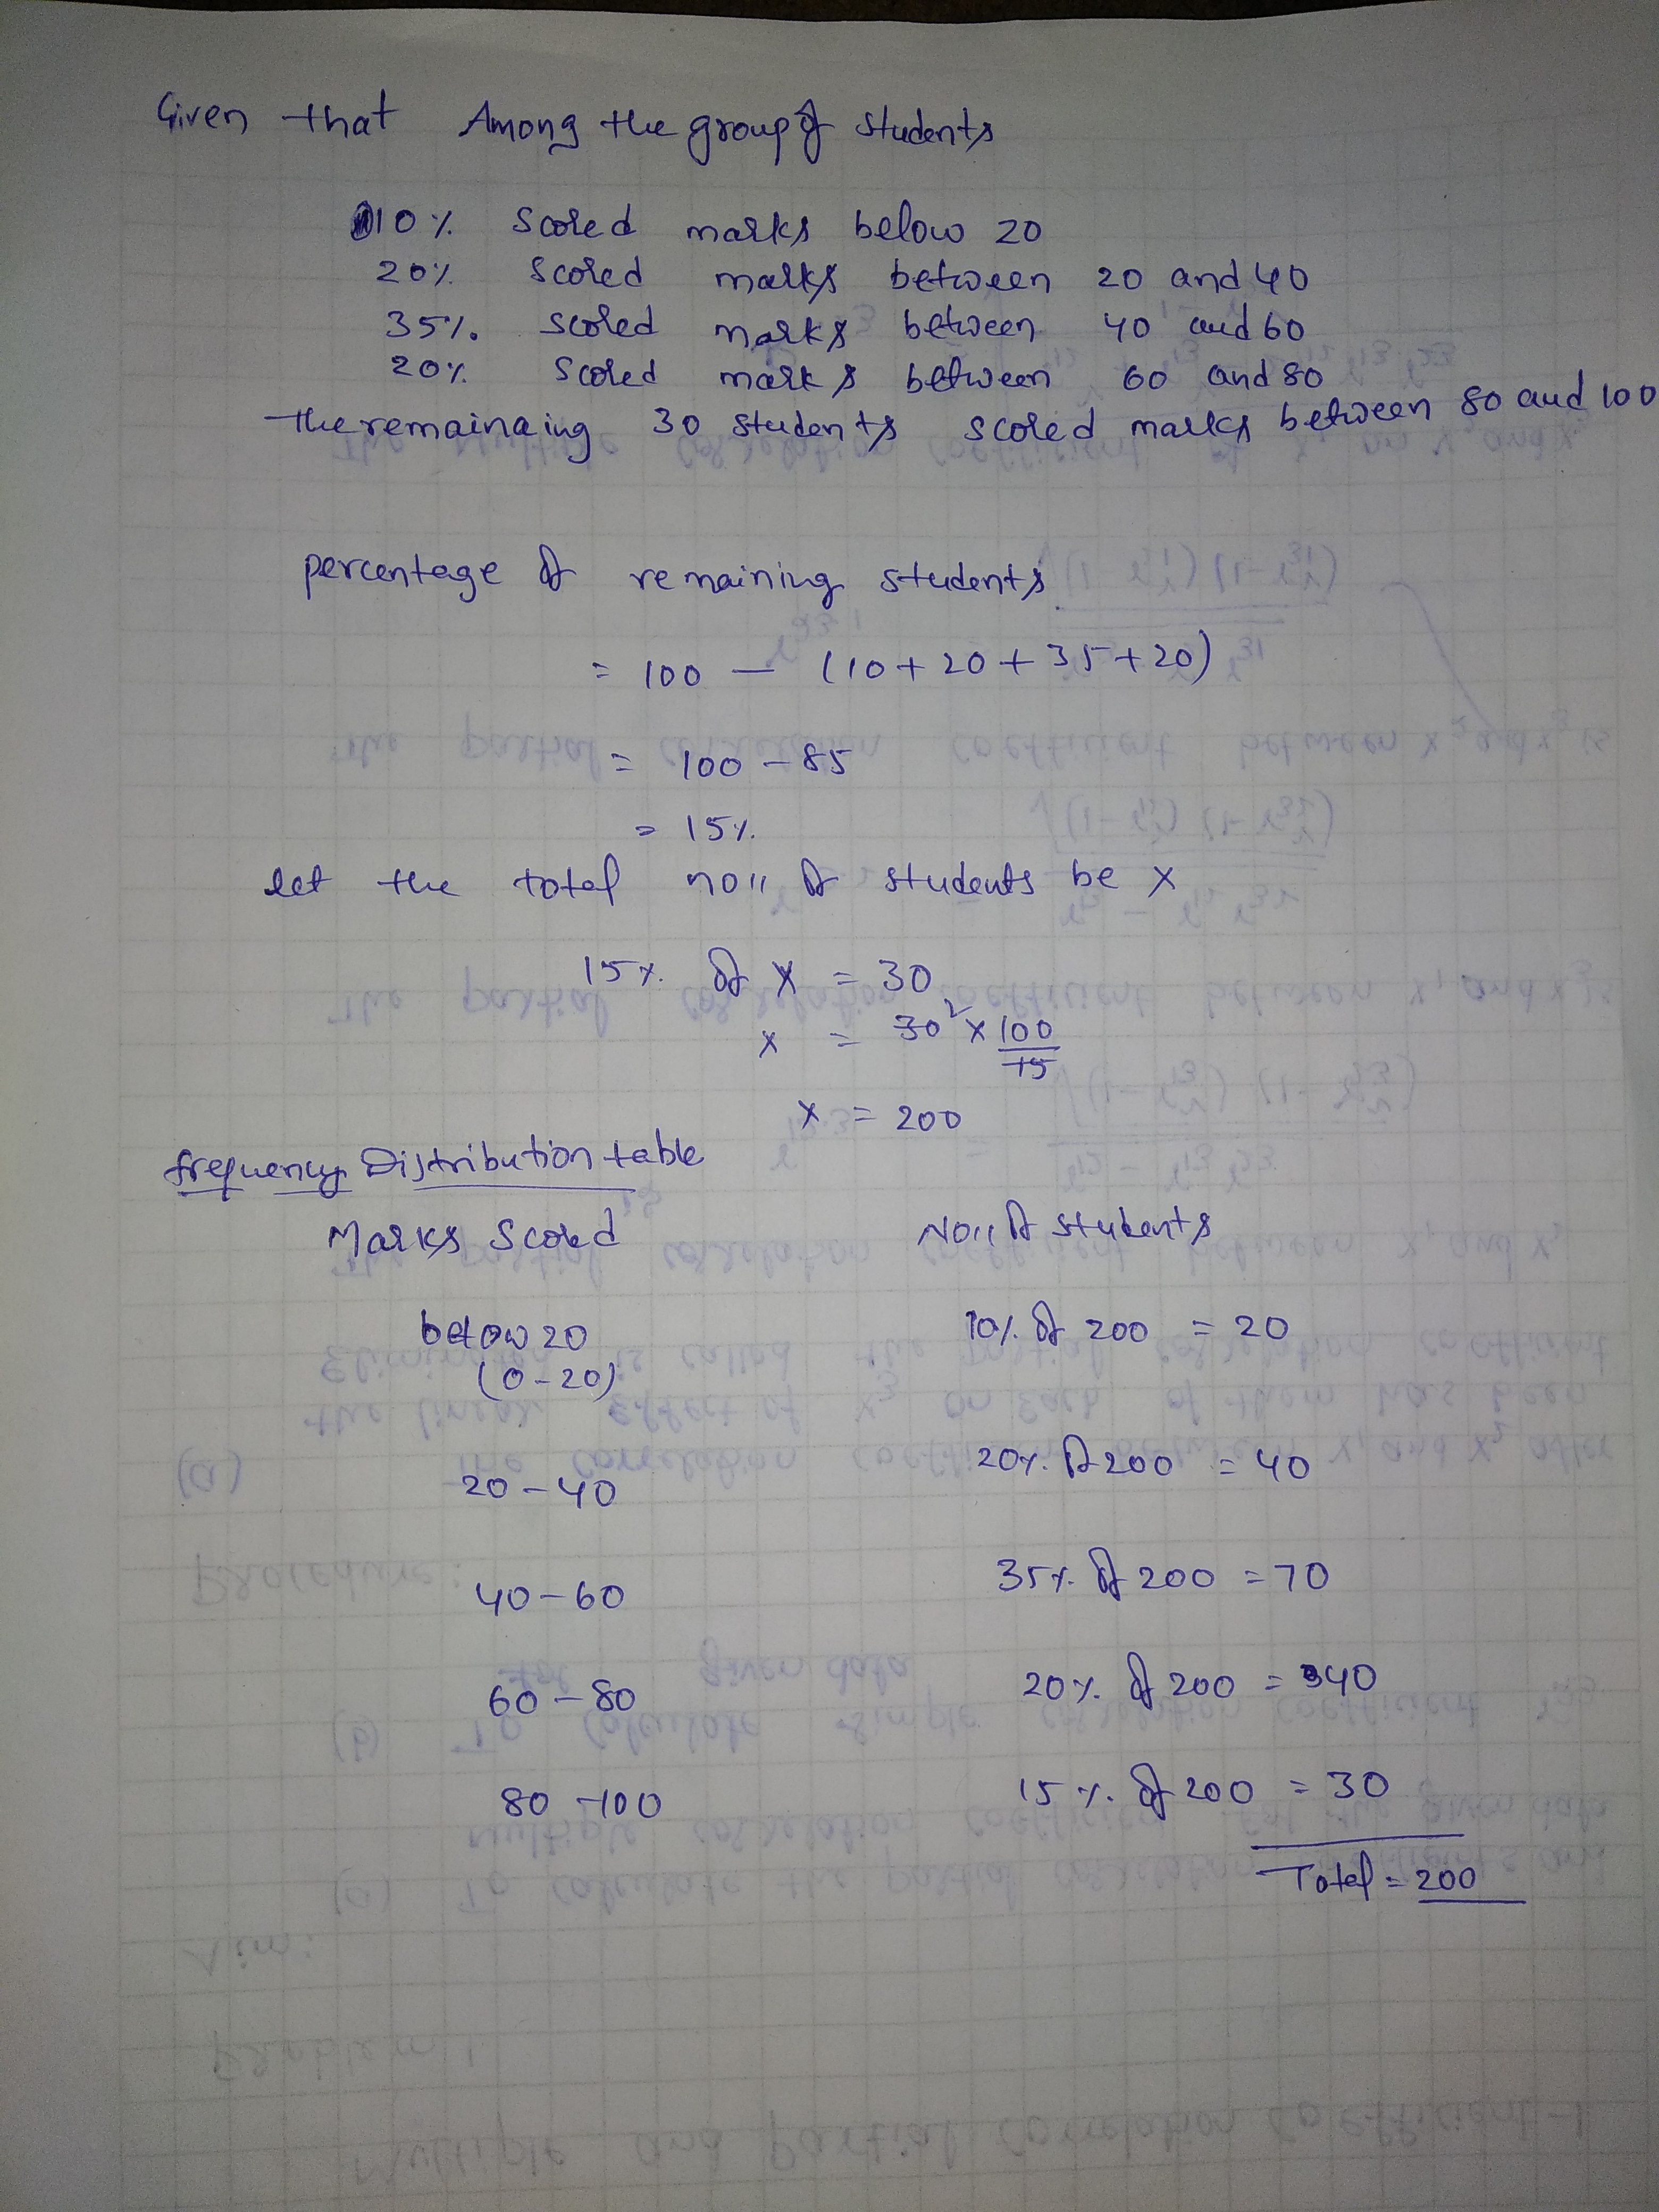
In the table given below, Find the mean.
(i)
| Class mark | Frequency |
| 5 | 3 |
| 15 | 9 |
| 25 | 15 |
| 35 | 13 |
Find the class marks of classes $$30-35, 35-40$$ and $$40-45$$ in the data below:
| Marks | Number of student |
| $$30-35$$ | $$5$$ |
| $$35-40$$ | $$8$$ |
| $$40-45$$ | $$15$$ |
| $$45-50$$ | $$20$$ |
| $$50-55$$ | $$5$$ |
| $$55-60$$ | $$4$$ |
| $$60-65$$ | $$4$$ |
| $$65-70$$ | $$2$$ |
| $$70-75$$ | $$3$$ |
The following table gives the life times of 400 neon lamps :
$$\left(i\right)$$ Represent the given information with the help of histogram.
| Life time (in hours) | Number of lamps |
| $$300-400$$ | $$14$$ |
| $$400-500$$ | $$56$$ |
| $$500-600$$ | $$60$$ |
| $$600-700$$ | $$86$$ |
| $$700-800$$ | $$74$$ |
| $$800-900$$ | $$62$$ |
| $$900-1000$$ | $$48$$ |
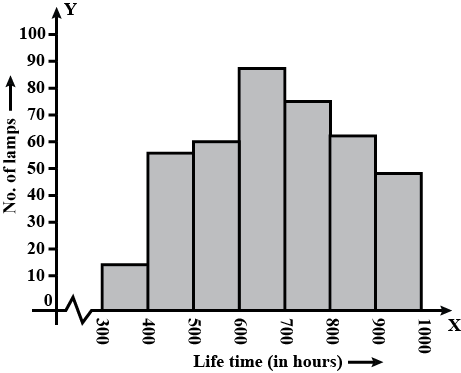
How many student got mark between 45 to 60?
| Marks | Number of student |
| $$30-35$$ | $$5$$ |
| $$35-40$$ | $$8$$ |
| $$40-45$$ | $$15$$ |
| $$45-50$$ | $$20$$ |
| $$50-55$$ | $$5$$ |
| $$55-60$$ | $$4$$ |
| $$60-65$$ | $$4$$ |
| $$65-70$$ | $$2$$ |
| $$70-75$$ | $$3$$ |
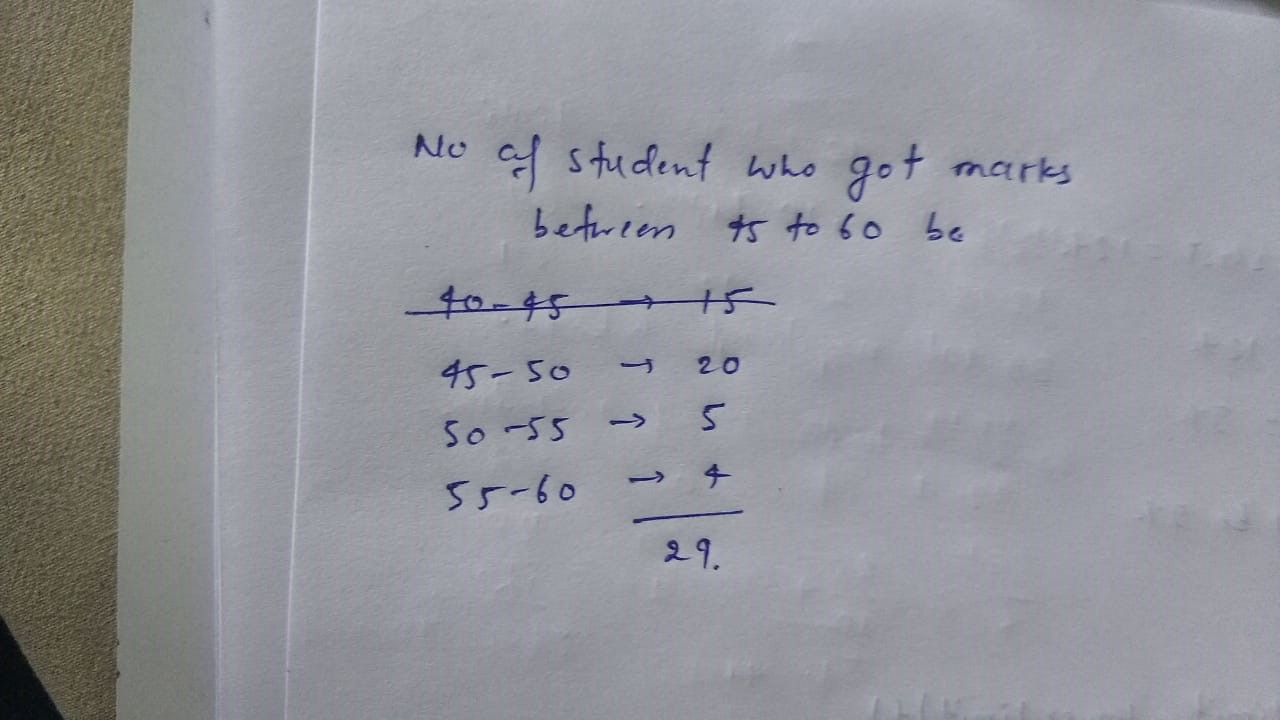
For the class $$21$$ to $$30$$, write lower and upper class limit.
The top speeds of 30 different land animals have been organised into a frequency table given below:
| Maximum speed (in km/h) | 10-20 | 20-30 | 30-40 | 40-50 | 50-60 | 60-70 |
| Number of animals | 3 | 5 | 10 | 8 | 0 | 2 |
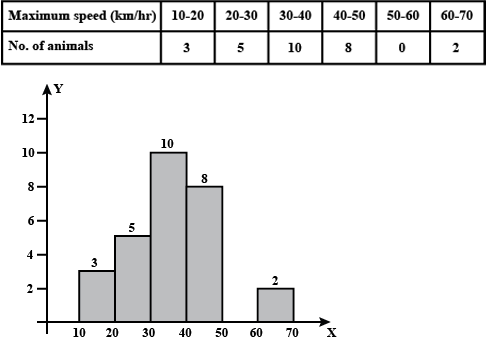
The mean of the following distribution is 50
| $${ x }_{ i }$$ | 10 | 30 | 50 | 70 | 90 |
| $${ f }_{ i }$$ | 17 | 5a+3 | 32 | 7a-11 | 19 |
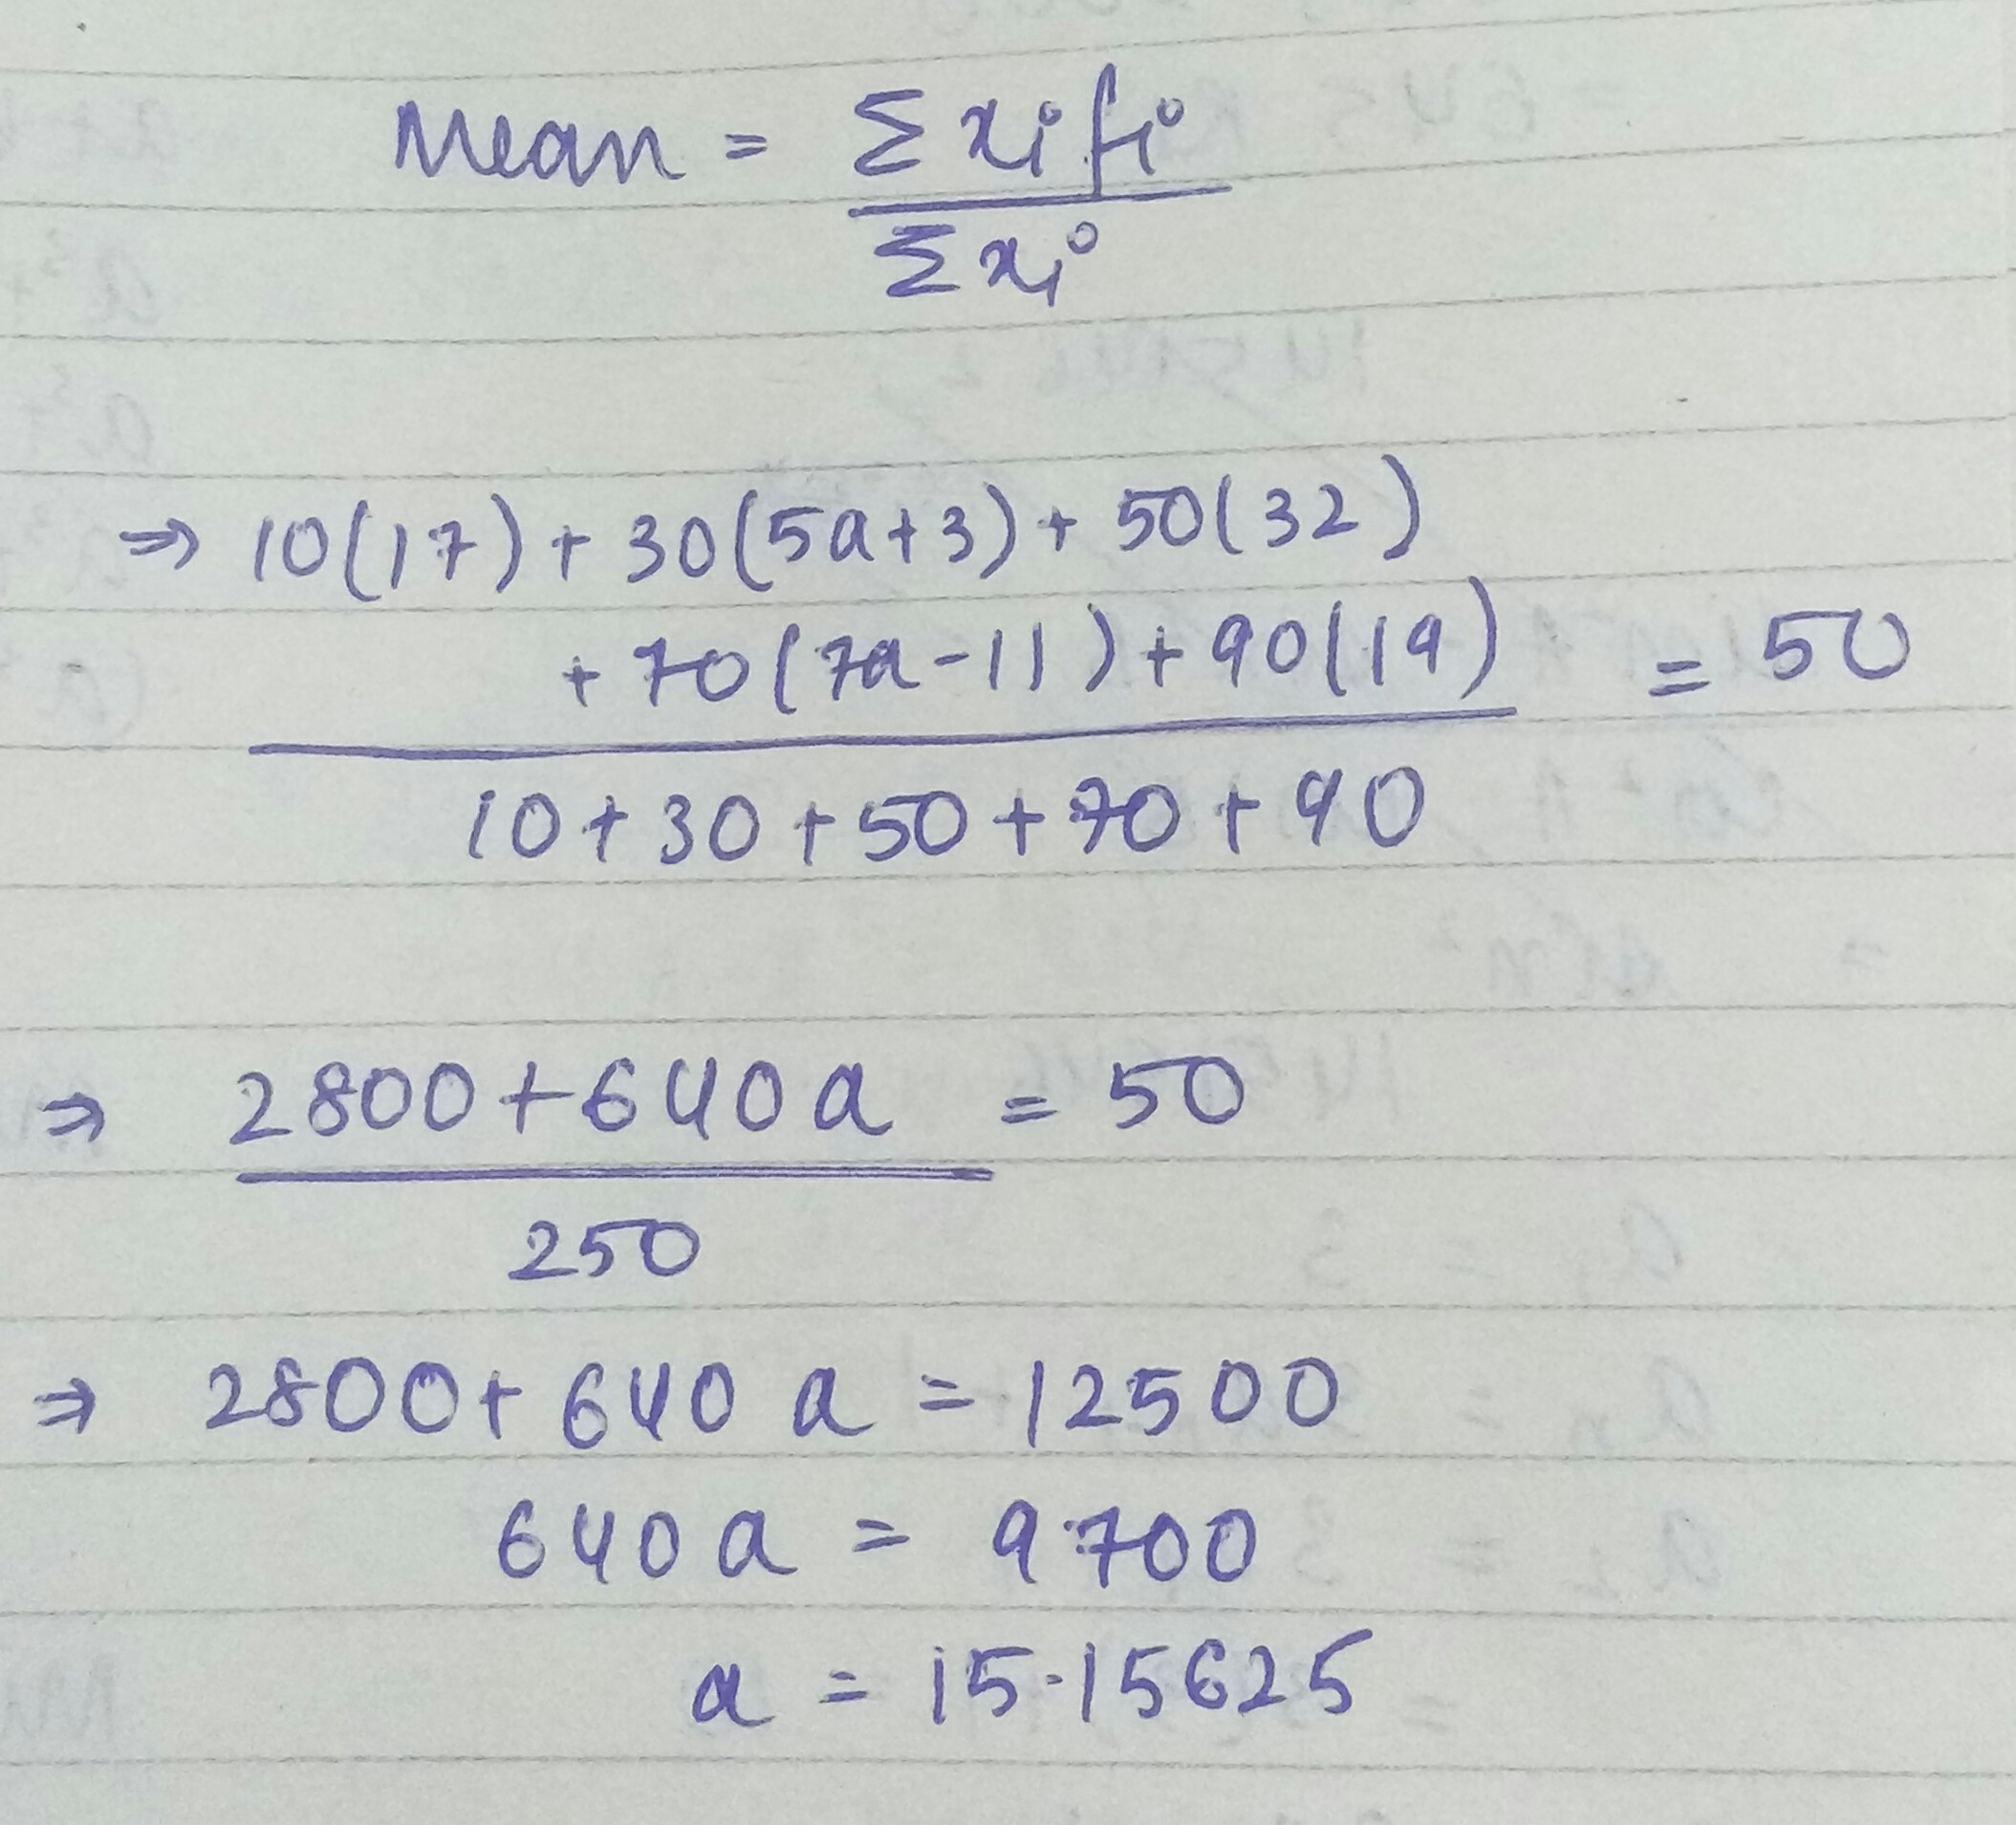
In English exam, the average of Class $$A$$ was found to be $$x$$ marks. After deducting a computational error, the average marks of $$100$$ candidates got reduced from $$74$$ to $$54$$. The average thus came down by $$25$$ marks. The total numbers of candidates who took the English exam were?
| Age(in years) | Number of teachers |
| 20-24 | 10 |
| 25-29 | 28 |
| 30-34 | 32 |
| 35-39 | 48 |
| 40-44 | 50 |
| 45-49 | 35 |
| 50-54 | 12 |
| Ages (in years) | Number of teachers |
| $$ 19.5-24.5$$ $$24.5-29.5$$ $$29.5-34.5$$ $$34.5-39.5$$ $$39.5-44.5$$ $$44.5-49.5$$ $$49.5-54.5$$ | $$10$$ $$28$$ $$32$$ $$48$$ $$50$$ $$35$$ $$12 $$ |

Find the class - mark of the class $$130- 150$$.
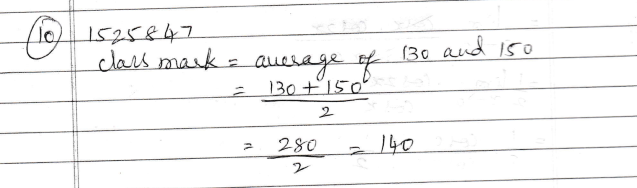
For class interval $$20-25$$, write the lower class limit and the upper class limit.
What are primary data?
The median of the following data isFind the missing frequencies a and b, if the total frequency is 70.
| Class | 0-5 | 5-10 | 10-15 | 15-20 | 20-25 | 25-30 | 30-35 | 35-40 |
| Frequency | 12 | a | 12 | 15 | b | 6 | 6 | 4 |
Find the class-mark of the class $$35-40$$.
In a survey of 60 families of a colony, the number of members in each family was recorded and the data has been represented by the bar graph shown above:
How many couples have no child?

The mean of the following is $$52$$ and the frequency interval $$30 - 40$$ is $$'f$$. Find the value of .
| Class interval | 10 - 20 | 20 - 30 | 30 - 40 | 40 - 50 | 50 - 60 | 60 - 70 | 70 - 80 |
| Frequency | 5 | 3 | f | 7 | 2 | 6 | 13 |
But, given mean $$= 52$$ …. (ii)
From (i) and (ii), we have
$$\dfrac{1940 + 35f}{36 + f} = 52$$
$$1940 + 35f = 1872 + 52f$$
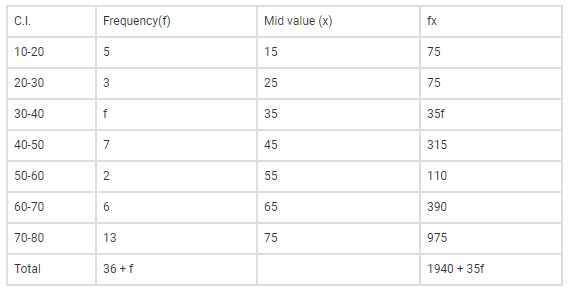
Construct a histogram for the following data:
| Monthly School fee (in Rs.) | $$30-60$$ | $$60-90$$ | $$90-120$$ | $$120-150$$ | $$150-180$$ | $$180-210$$ | $$210-240$$ |
| No.of Schools | $$5$$ | $$12$$ | $$14$$ | $$18$$ | $$10$$ | $$9$$ | $$4$$ |
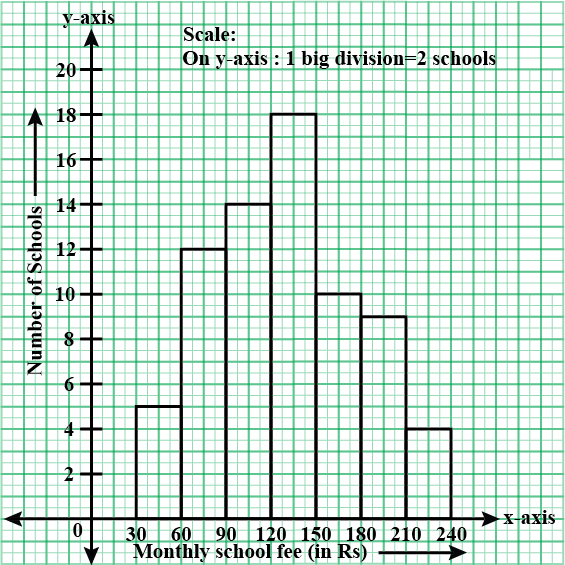
What are secondary data? Which of the two - the primary or the secondary data - is more reliable and why?
Following table gives the distribution of students of section A and B of a class according to the marks obtained by them. Section A Section B Marks Frequency Marks Frequency 10-15 5 0-15 3 15-30 12 15-30 16 30-45 20 30-45 25 45-60 30 45-60 27 60-75 35 60-75 40 75-90 15 75-90 10
Represent the marks of students of both the section on the same graph by two frequency polygons. What do you observe?
| Section A | Section B | ||
| Marks | Frequency | Marks | Frequency |
| 10-15 | 5 | 0-15 | 3 |
| 15-30 | 12 | 15-30 | 16 |
| 30-45 | 20 | 30-45 | 25 |
| 45-60 | 30 | 45-60 | 27 |
| 60-75 | 35 | 60-75 | 40 |
| 75-90 | 15 | 75-90 | 10 |
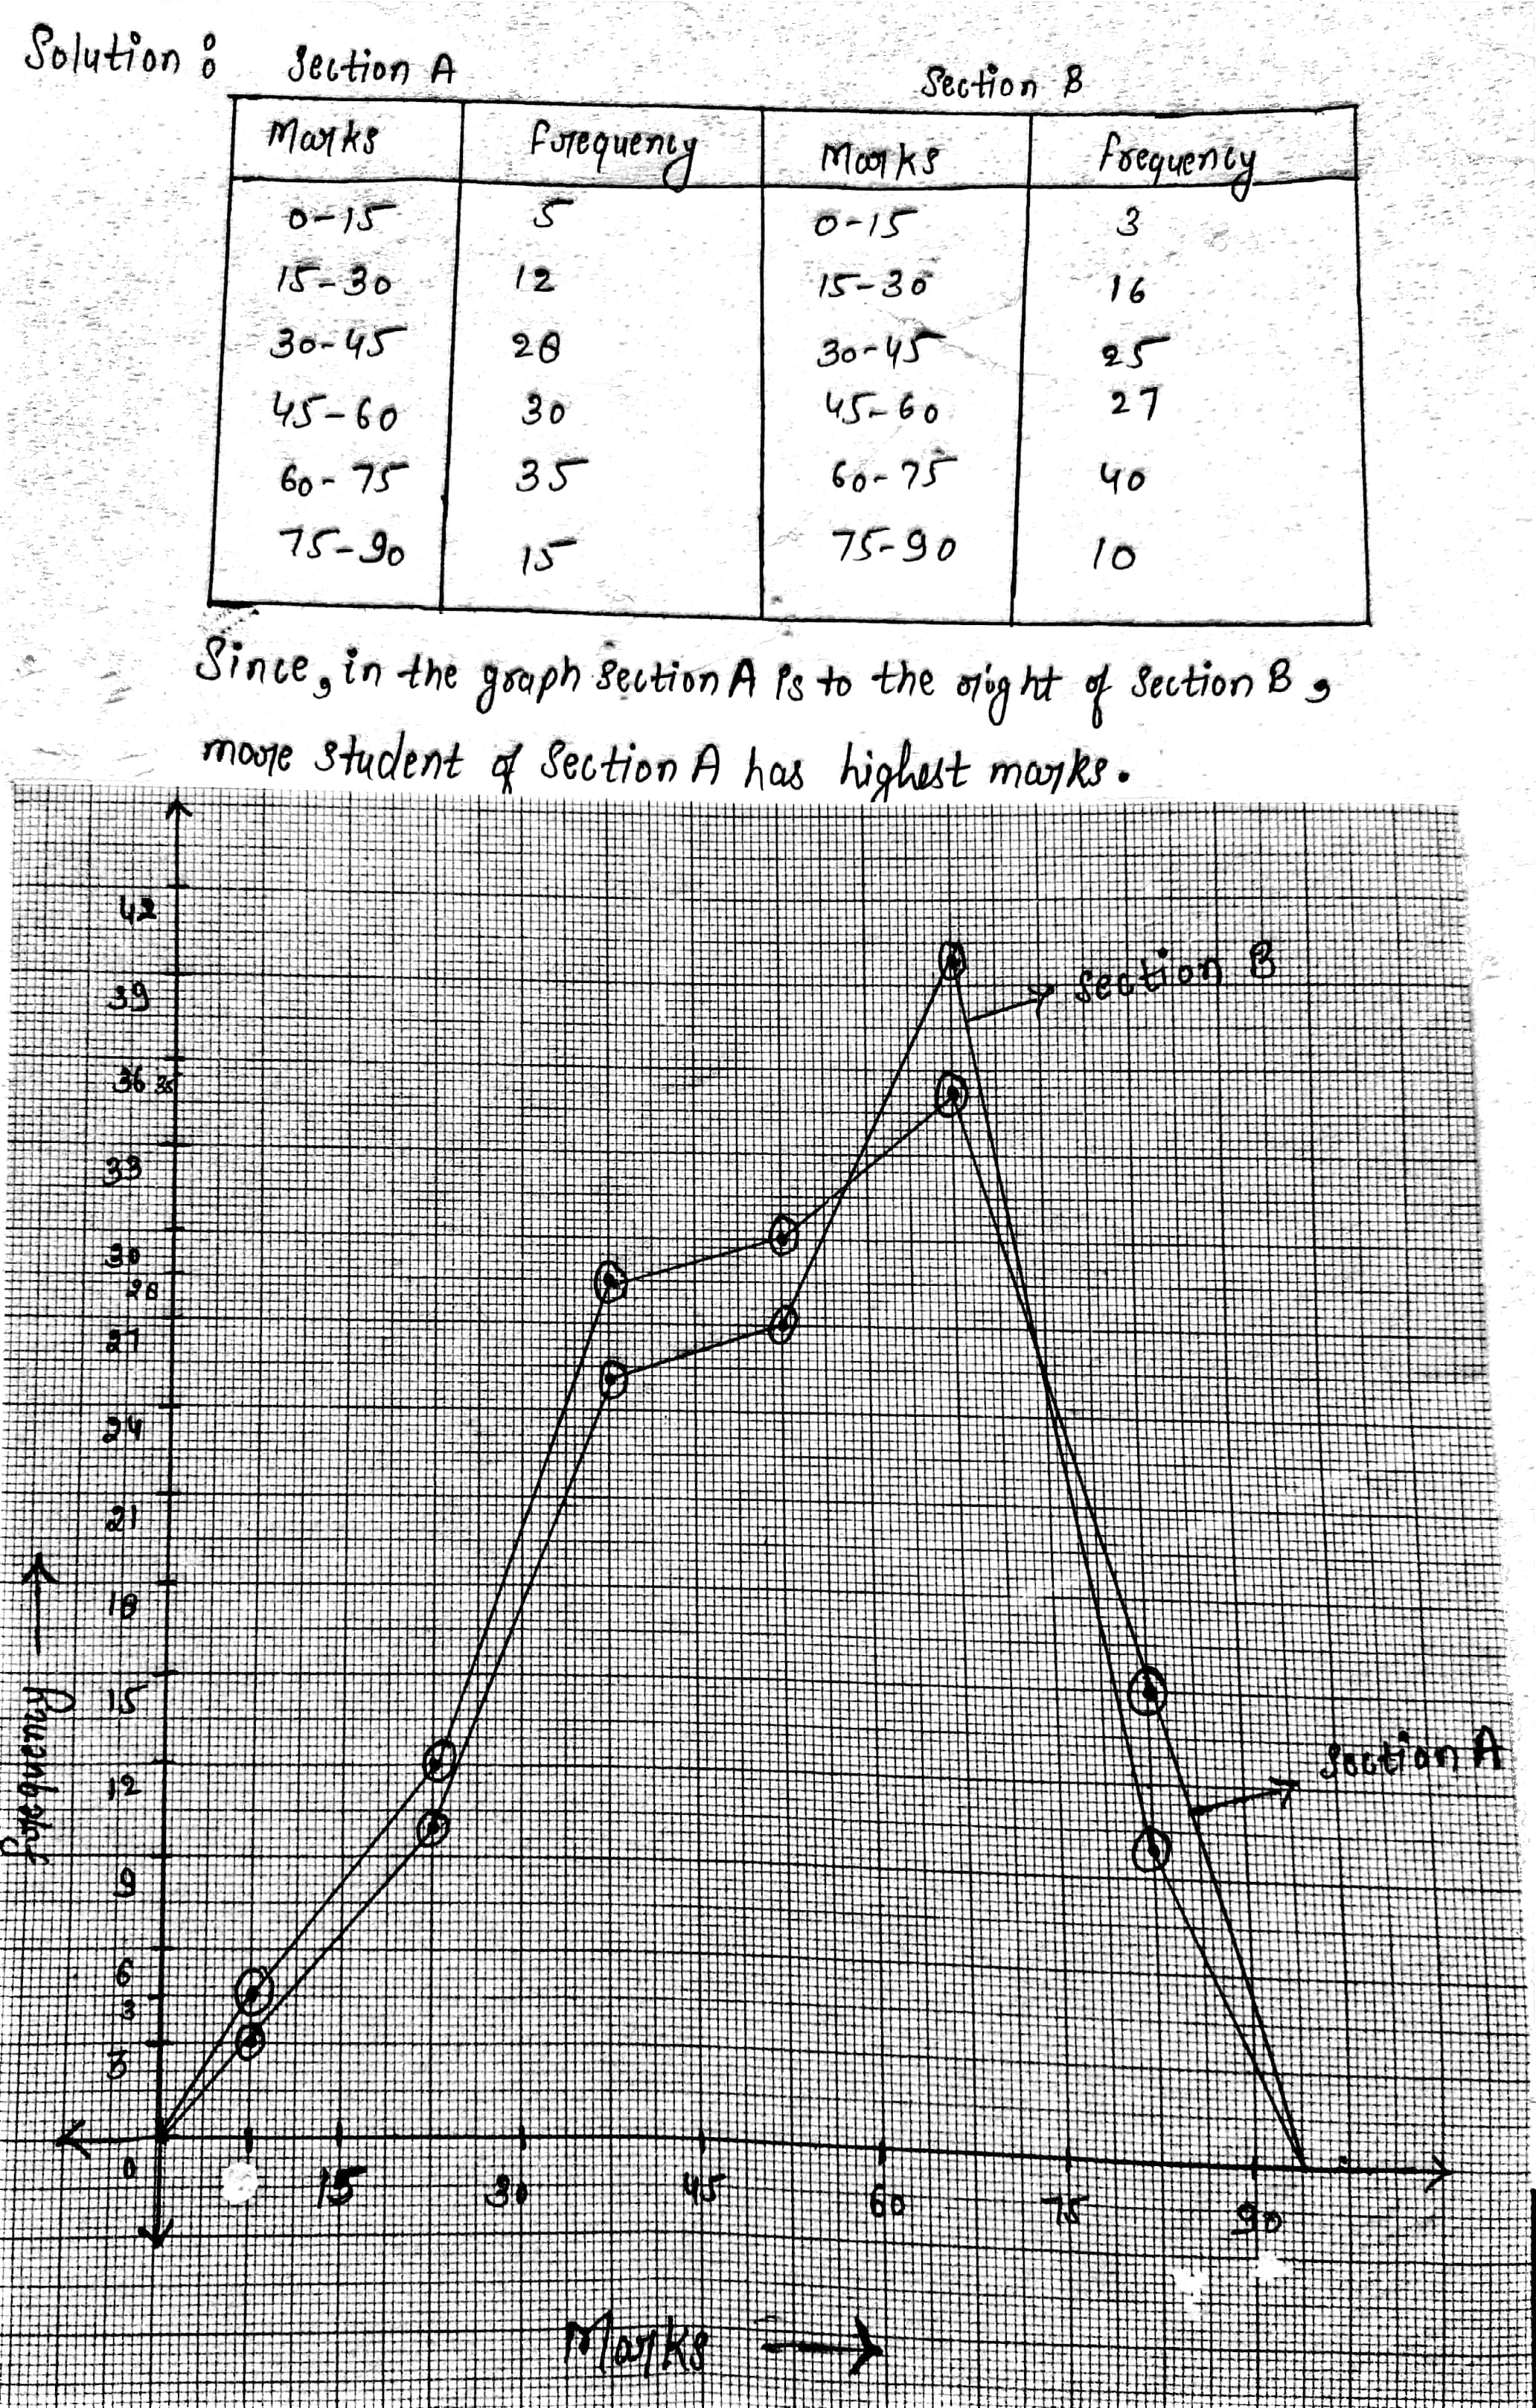
The final marks in mathematics of 30 students are as follows:
$$53,61,48,60,78,68,55,100,67,90$$
$$75,88,77,37,84,58,60,48,62,56$$
$$44,58,52,64,98,59,70,39,50,60$$
Now answer the following:
How many have scored 75 or more?
Explain the meaning of the following terms: class limits
The weight of new born babies (in kg) in a hospital on a particular day are as follows:
$$2.3,2.2,2.1,2.7,2.6,3.0,2.5,2.9,2.8,3.1,2.5,2.8,2.7,2.9,2.4$$
Determine the highest weight. (in kg)
Prepare a frequency table of the following scores obtained by 50 students in a test:
42 51 21 42 37 37 42 49 38 52
7 33 17 44 39 7 14 27 39 42
42 62 37 39 67 51 53 53 59 41
29 38 27 31 54 19 53 51 22 61
42 39 59 47 33 34 16 37 57 43
Explain the meaning of the following terms: class-interval
The final marks in mathematics of 30 students are as follows:
$$53,61,48,60,78,68,55,100,67,90$$
$$75,88,77,37,84,58,60,48,62,56$$
$$44,58,52,64,98,59,70,39,50,60$$
Now answer the following:
If 40 is the pass mark how many have failed?
The final marks in mathematics of 30 students are as follows:
$$53,61,48,60,78,68,55,100,67,90$$
$$75,88,77,37,84,58,60,48,62,56$$
$$44,58,52,64,98,59,70,39,50,60$$
Now answer the following:
What is the lowest score?
The weight of new born babies (in kg) in a hospital on a particular day are as follows:
$$2.3,2.2,2.1,2.7,2.6,3.0,2.5,2.9,2.8,3.1,2.5,2.8,2.7,2.9,2.4$$
Determine the lowest weight.
Explain the meaning of the following terms: frequency
The weight of new born babies (in kg) in a hospital on a particular day are as follows:
$$2.3,2.2,2.1,2.7,2.6,3.0,2.5,2.9,2.8,3.1,2.5,2.8,2.7,2.9,2.4$$
How many babies were born on that day?
Explain the meaning of the following terms: class-mark
The weight of new born babies (in kg) in a hospital on a particular day are as follows:
$$2.3,2.2,2.1,2.7,2.6,3.0,2.5,2.9,2.8,3.1,2.5,2.8,2.7,2.9,2.4$$
How many babies weigh below $$2.5 kg$$?
In s survey of $$60$$ families of a colony, the number of members in each family was recorded and the data has been represented by the bar graph given below:
Which type of family is the most common?

Study the bar graph representing the number of persons in various age groups in a town shown. Observe the bar graph and answer the following questions:
What is the total number of persons living in the town in the age-groups $$10-15$$ and $$60-65$$?

Read the bar graph and answer the following question:
What is the information given by the bar graph?
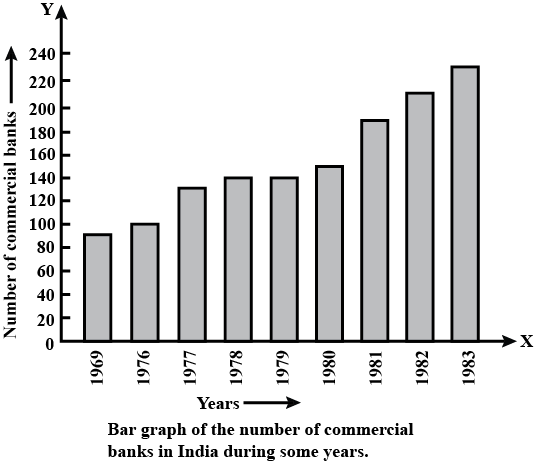
Three coins were tossed 30 times. each time the number of heads occuring was noted down as follow:
$$0,1,2,2,1,2,3,1,3,0$$
$$1,3,1,1,2,2,0,1,2,1$$
$$3,0,0,1,1,2,3,2,2,0$$
Prepare a frequency distribution table for the data given above.
The weight of new born babies (in kg) in a hospital on a particular day are as follows:
$$2.3,2.2,2.1,2.7,2.6,3.0,2.5,2.9,2.8,3.1,2.5,2.8,2.7,2.9,2.4$$
How many babies weight more than 2.8 kg?
The weight of new born babies (in kg) in a hospital on a particular day are as follows:
$$2.3,2.2,2.1,2.7,2.6,3.0,2.5,2.9,2.8,3.1,2.5,2.8,2.7,2.9,2.4$$
How many babies weight 2.8 kg?
Study the bar graph representing the number of persons in various age groups in a town shown. Observe the bar graph and answer the following questions:
What is the total population of the town?

Read the above bar graph and answer the following question:
Which state has total production of rice and wheat as its maximum?

Study the bar graph representing the number of persons in various age groups in a town shown. Observe the bar graph and answer the following questions:
How many persons are more in the age-group $$10-15$$ than in the age group $$30-35$$?

The number of runs scored by a cricket player in 25 innings are as follows:
$$26,35,94,48,82,105,53,0,39,42,71,0,64,15,34,67,0,42,124,84,54,48,139,$$$$64,47.$$
How many times did the player not score a run?
How many times did the player not score a run?
Following data gives the number of children in 41 families:
$$1,2,6,5,1,5,1,3,2,6,2,3,4,2,0,0,4,4,3,2,2,0,0,1,2,2,4,3,2,1,0,5,1,2,4,3,4,1,6,2,2.$$
Represent it in the form of a frequency distribution.
Find the mean of first five natural numbers.
Draw a histogram for the daily earnings of 30 drug stores in the following table:
| Daily earnings (in Rs.): | 450-500 | 500-550 | 550-600 | 600-650 | 650-700 |
| Number of Stores: | 16 | 10 | 7 | 3 | 1 |
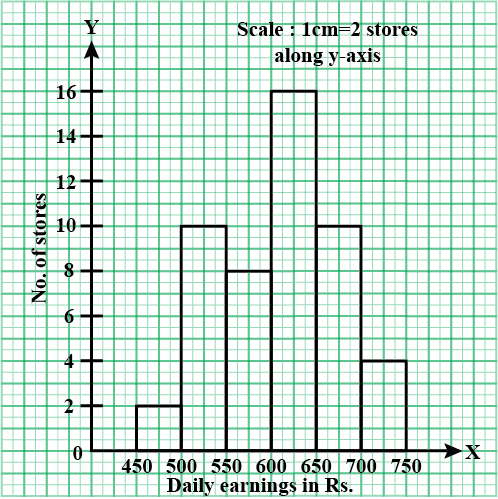
Thirty children were asked about the number of hours they watched T.V. programmes in the previous week. The results were found as follows:
1 6 2 3 5 12 5 8 4 8
10 3 4 12 2 8 15 1 17 6
3 2 8 5 9 6 8 7 14 12
How many children watched television for 15 or more hours a week?
Construct a histogram for the following data:
| Monthly School fee (in Rs): | 30-60 | 60-90 | 90-120 | 120-150 | 150-180 | 180-210 | 210-240 |
| No of Schools | 5 | 12 | 14 | 18 | 10 | 9 | 4 |
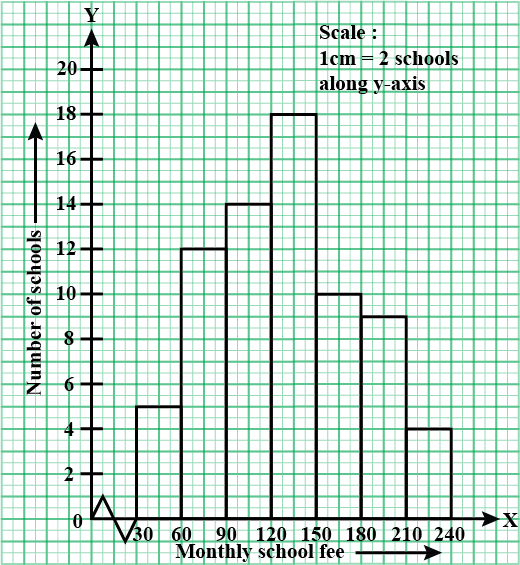
The following is the distribution of weights (in kg) of $$52$$ persons :
| Weight (in kg) | Persons |
| $$30-40$$ | 10 |
| $$40-50$$ | 15 |
| $$50-60$$ | 17 |
| $$60-70$$ | 6 |
| $$70-80$$ | 4 |
Read the following bar graph and answer the following question:
Which state is the largest producer of rice?

Read the above bar graph and answer the following question:
Which state is the largest producer of wheat?
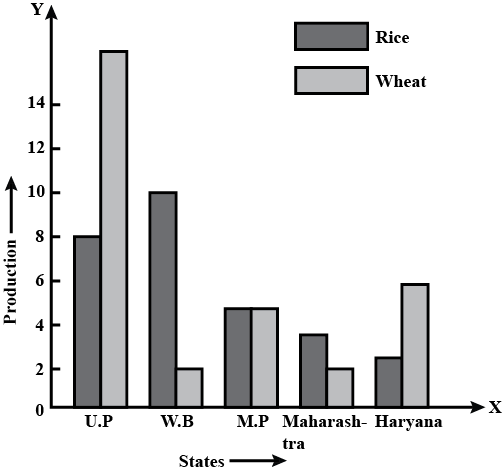
The time taken, in seconds, to solve a problem by each 25 pupils is as follows:
$$16,20,26,27,28,30,33,37,38,40,42,43,46,46,46,48,49,50,53,54,58,59,60,62,70$$
Draw a histogram to represent the frequency distribution.
| Seconds | Frequency |
| $$10-20$$ | $$1$$ |
| $$20-30$$ | $$5$$ |
| $$30-40$$ | $$4$$ |
| $$40-50$$ | $$8$$ |
| $$50-60$$ | $$5$$ |
| $$60-70$$ | $$2$$ |
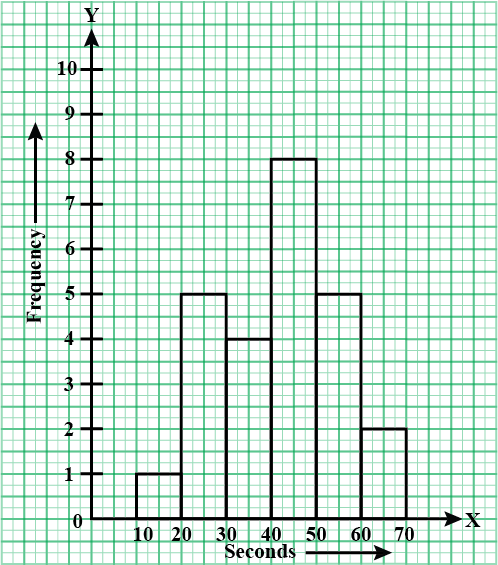
The following is the distribution of total household expenditure (in Rs.) of manual worker in a city:
| Expenditure (in Rs.): | 100-150 | 150-200 | 200-250 | 250-300 | 300-350 | 350-400 | 400-450 | 450-500 |
| No. of manual workers: | 25 | 40 | 33 | 28 | 30 | 22 | 16 | 8 |
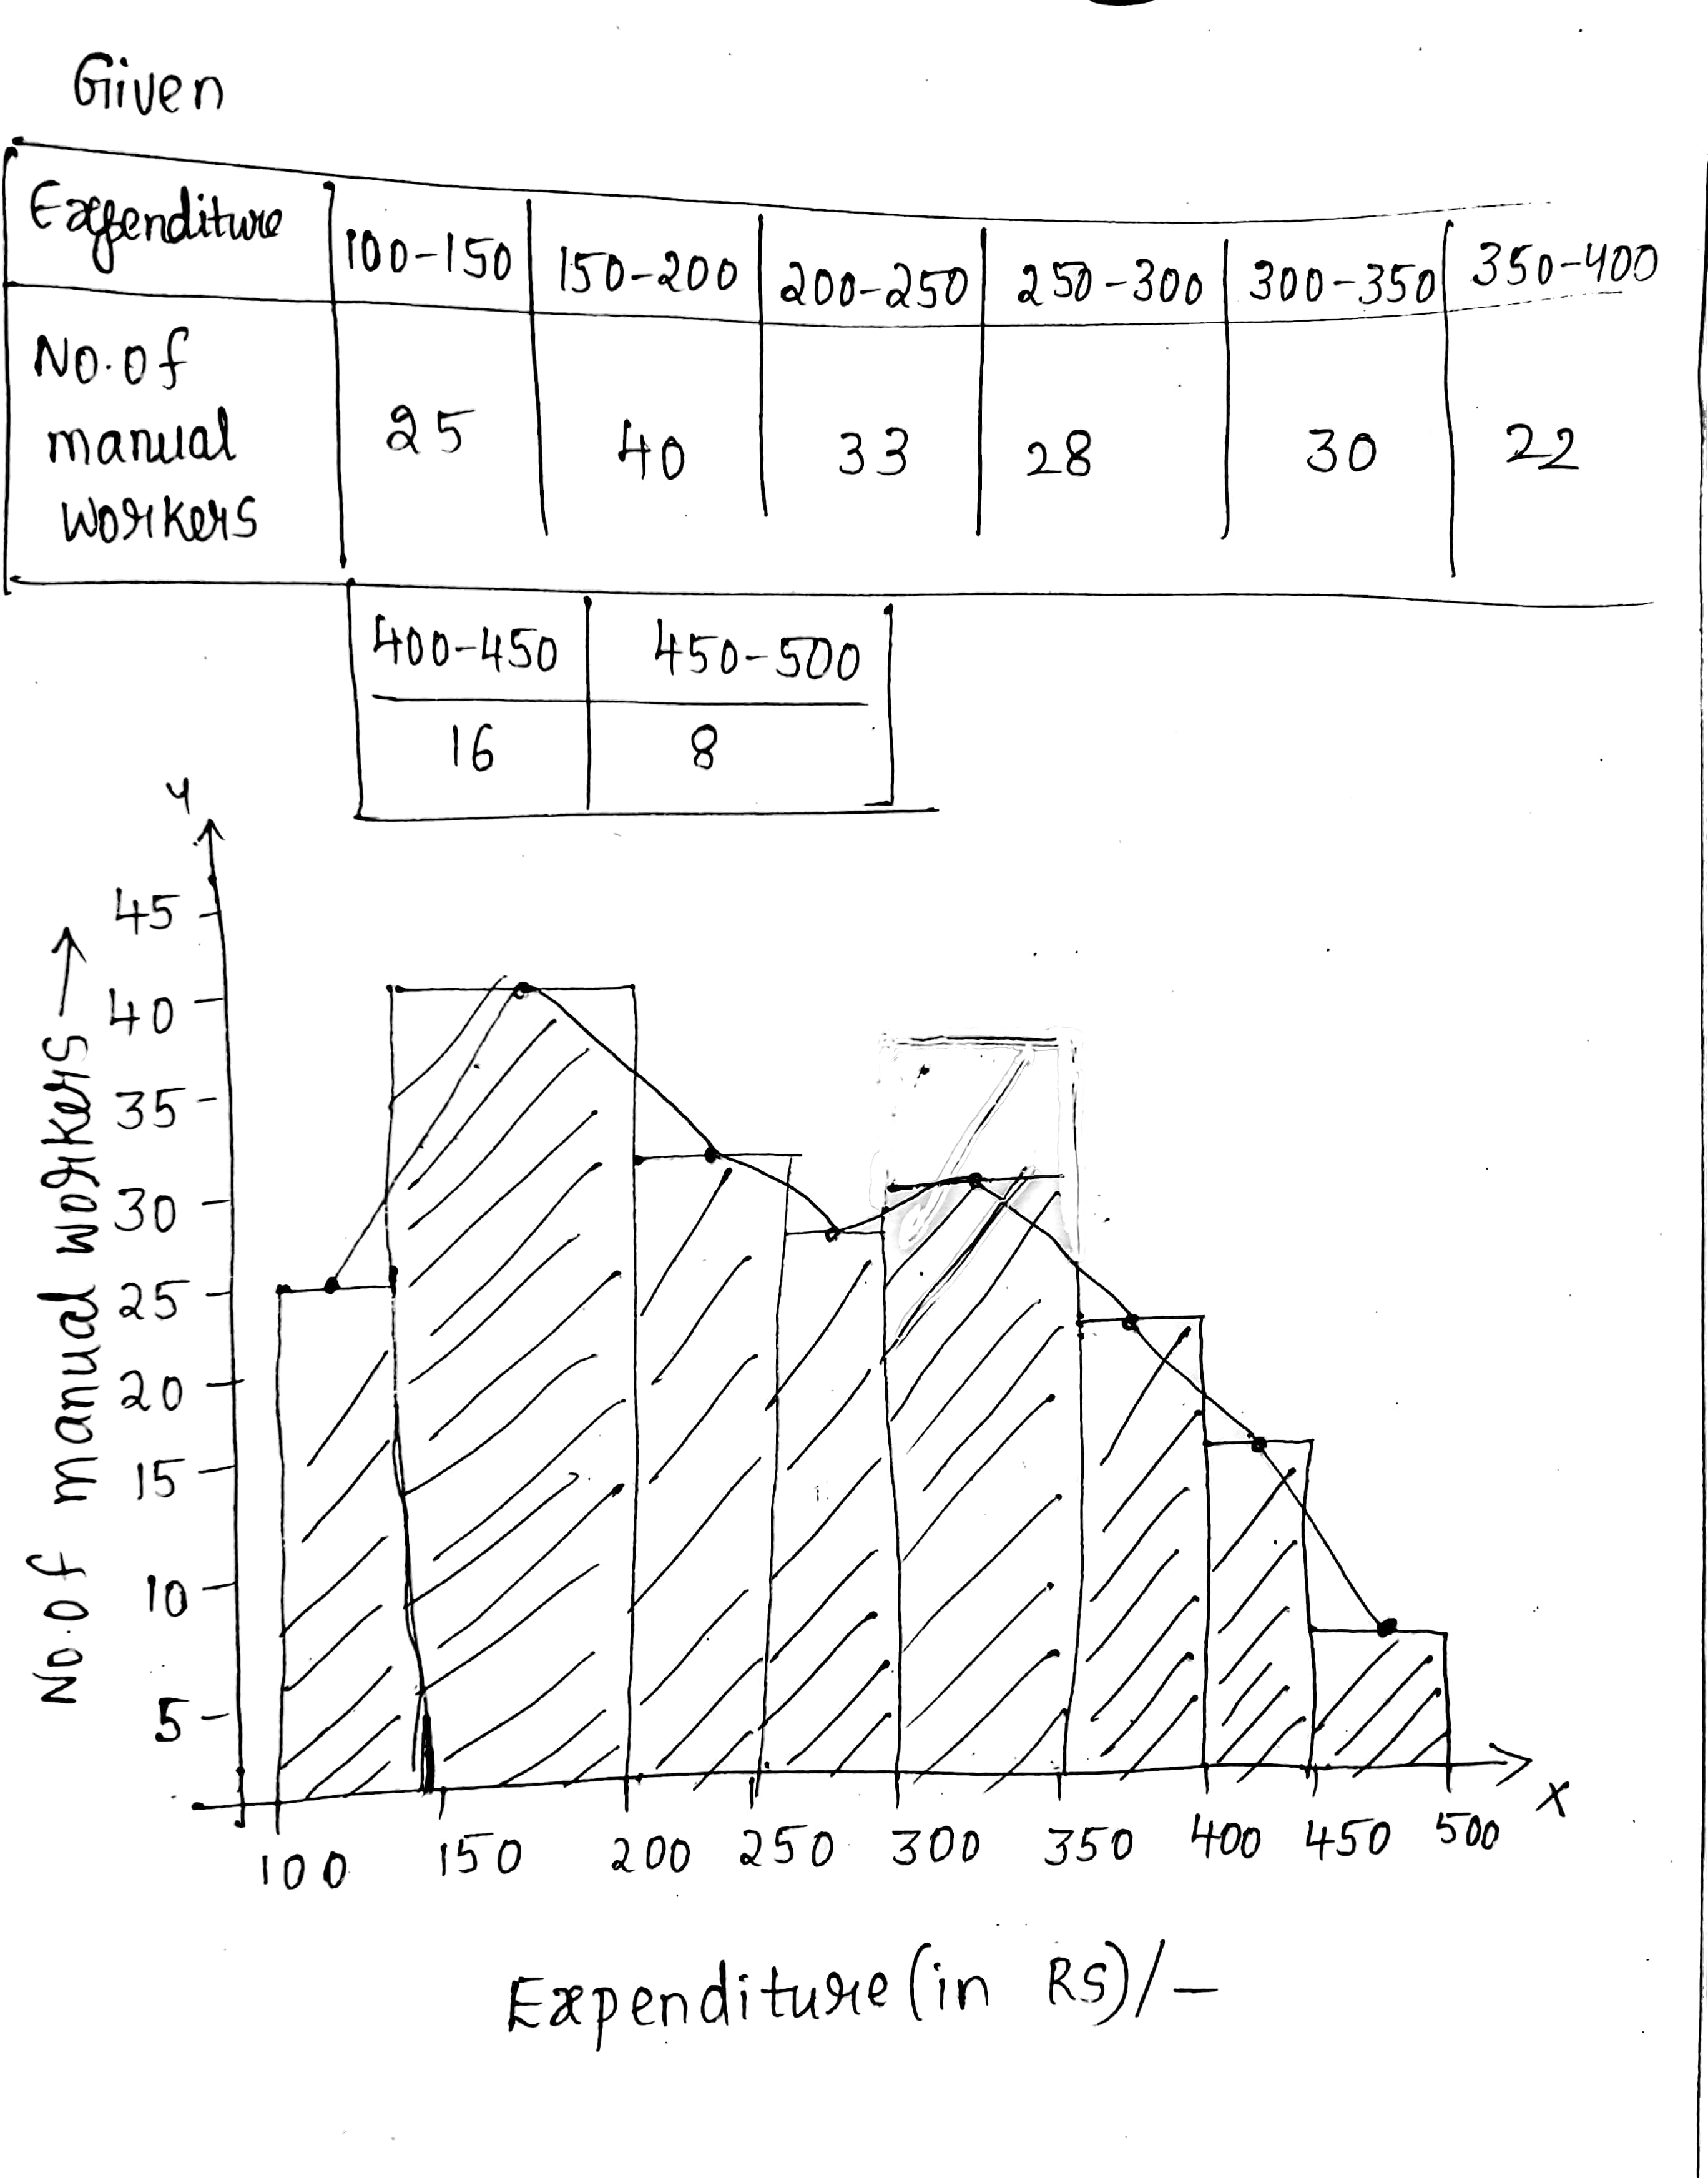
The distribution of heights (in cm) of 96 children is given below. Construct a histogram and a frequency polygon on the same axes.
| Height (in cm): | 124 to 128 | 128 to 132 | 132 to 136 | 136 to 140 | 140 to 144 | 144 to 148 | 148 to 152 | 152 to 156 | 156 to 160 | 160 to 164 |
| No. of Children: | 5 | 8 | 17 | 24 | 16 | 12 | 6 | 4 | 3 | 1 |
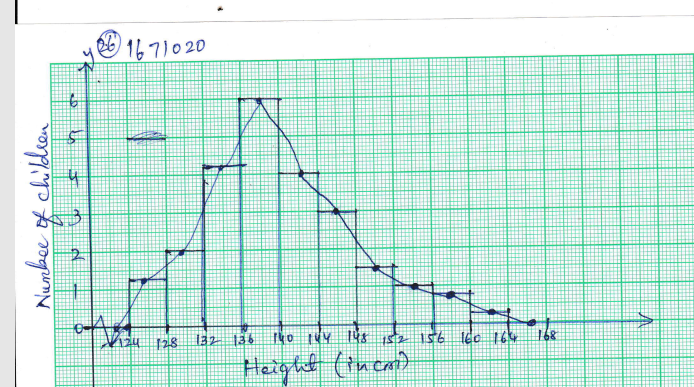
Find the mean of $$x,x+2,x+4,x+6,x+8$$.
Find the mean of first 10 even natural numbers.
The investment (in ten crores of rupees) of Life Insurance Corporation of India in different sectors are given below :
| Sectors | Investment (in ten crores of rupees ) |
| Central Government Securities | 45 |
| State Government Securities | 11 |
| Securities guaranteed by the Government | 23 |
| Private Sectors | 18 |
| Socially oriented sectors (Plan) | 46 |
| Socially oriented sectors (Non-Plan) | 11 |
- CGS: Central Government Securities
- SGS: State Government Securities
- SGG: Securities Guaranteed by Government
- PS: Private Sectors
- SOS(P): Socially Oriented Sectors (Plan)
- SOS(NP): Socially Oriented Sectors (Non-Plan)
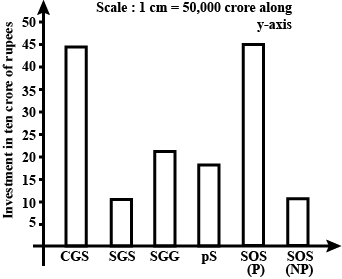
Define the following terms :
Class interval
The mean of 200 items wasLater on, it was discovered that the two items were misread as 92 and 8 instead of 192 andFind the correct mean.
Find the mean of first five multiples of 3.
In a hypothetical sample of $$20$$ people the amounts of money with them were found to be as follows:
$$114, 108, 100, 98, 101, 109, 117, 119, 126, 131, 136, 143, 156, 169, 182, 195, 207, 219, 235, 118$$.
Draw the histogram of the frequency distribution (taking one of the class intervals as $$50-100$$).
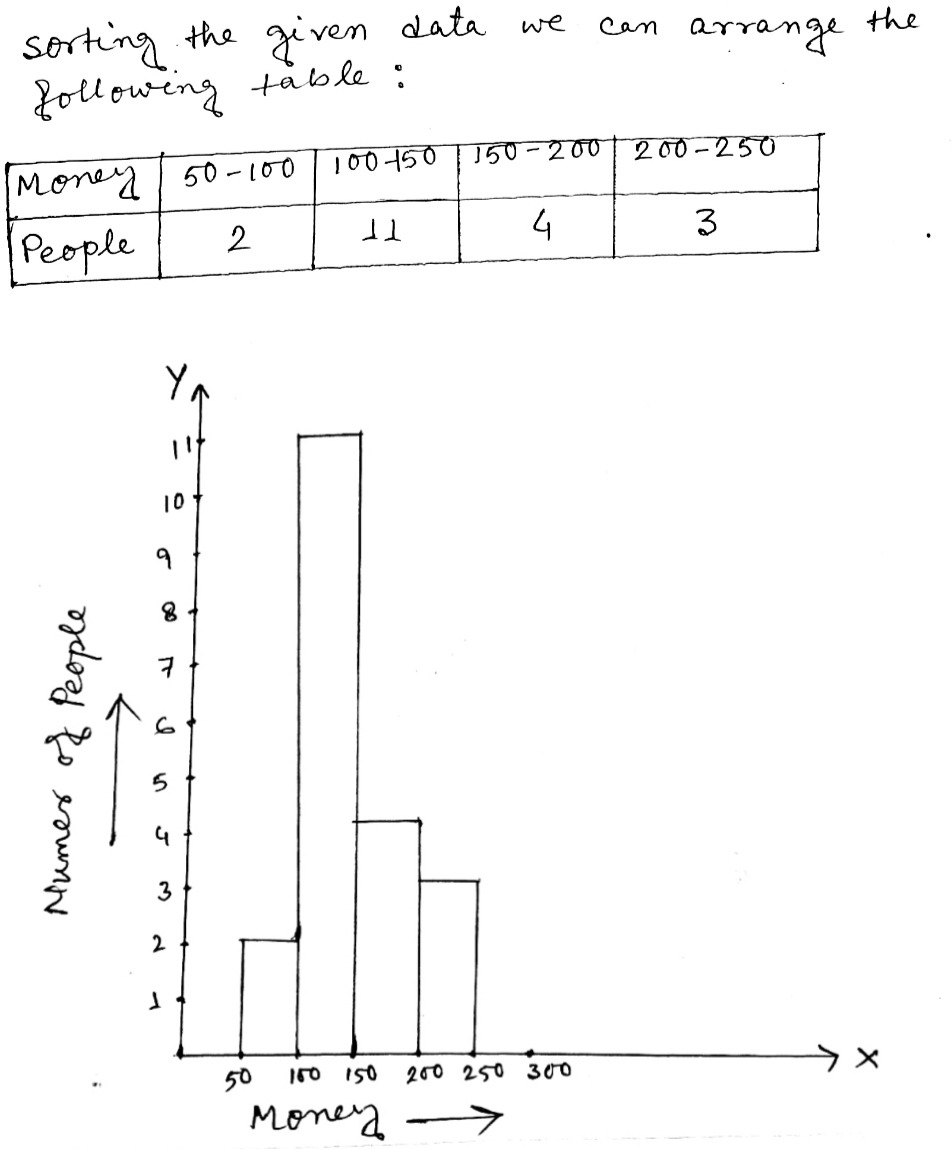
Number of workshops organized by a school in different areas during the last five years are as follows :
| Years | No.of workshops |
| $$1995-1996$$ | $$25$$ |
| $$1996-1997$$ | $$30$$ |
| $$1997-1998$$ | $$42$$ |
| $$1998-1999$$ | $$50$$ |
| $$1999-2000$$ | $$65$$ |
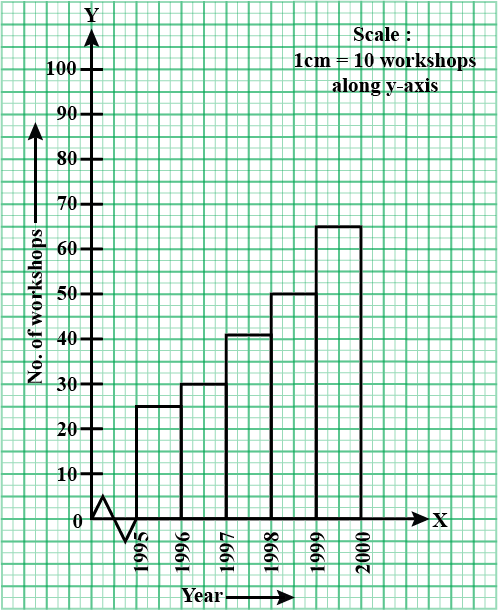
The weights of new born babies (in kg) in a hospital on a particular day are as follows:$$2.3, 2.2, 2.1, 2.7, 2.6, 3.0, 2.5, 2.9, 2.8, 3.1, 2.5, 2.8, 2.7, 2.9, 2.4$$How many babies weigh more than $$2.8 kg$$ ?
Prepare a frequency table of the following scores obtained by $$50$$ students in a test:
$$42, 51, 21, 42, 37, 37, 42, 49, 38, 52, 7, 33, 17, 44, 39, 7, 14, 27, 39, 42, 42, 62, 37, 39, 67, 51, 53, 53,$$$$ 59, 41, 29, 38, 27, 31, 54, 19, 53, 51, 22, 61, 42, 39, 59, 47, 33, 34, 16, 37, 57, 43$$
Study the bar graph representing the number of persons in various age groups in a town shown in figure. Observe the bar graph and answer the following questions:
What is the percentage of the youngest age-group persons over those in the oldest age group?
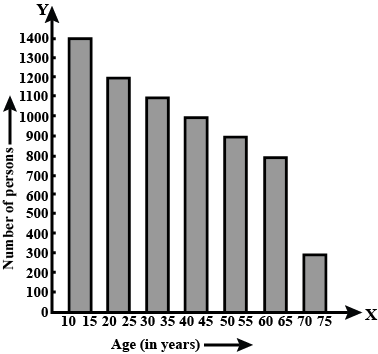
In a study of number of accidents per day, the observations for 30 days were obtained as follows:
$$6$$ $$3$$ $$5$$ $$6$$ $$4$$ $$3$$ $$2$$ $$5$$ $$4$$ $$2$$$$4$$ $$2$$ $$1$$ $$2$$ $$2$$ $$0$$ $$5$$ $$4$$ $$6$$ $$1$$$$6$$ $$0$$ $$5$$ $$3$$ $$6$$ $$1$$ $$5$$ $$5$$ $$2$$ $$6$$Prepare a frequency distribution table.
Following data gives the number of children in 40 families:
$$1,2,6,5,1,5,1,3,2,6,2,3,4,2,0,0,4,4,3,2$$
$$2,0,0,1,2,2,4,3,2,1,0,5,1,2,4,3,4,1,6,2$$
Represent it in the form of a frequency distribution.
The population of Delhi State in different census years is as given below:
| Census year | 1961 | 1971 | 1981 | 1991 | 2001 |
| Population in Lakhs | 30 | 55 | 70 | 110 | 150 |
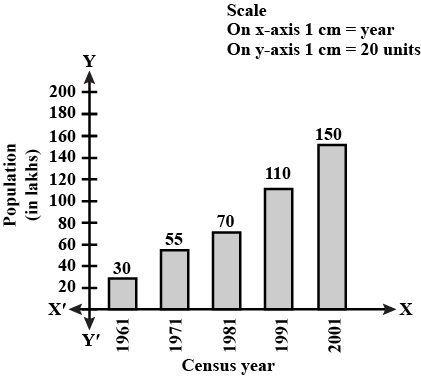
Construct a frequency table with equal class intervals from the following data on the monthly wages (in rupees) of $$28$$ laborers working in a factory, taking one of the class intervals as $$210-230$$ ($$230$$ not included):
$$220, 268, 258, 242, 210, 268, 272, 242, 311, 290,$$$$300, 320, 319, 304, 302, 318, 306, 292, 254,278,$$
$$210, 240, 280, 316, 306, 215, 256, 236$$.
$$210, 240, 280, 316, 306, 215, 256, 236$$.
The marks obtained by $$40$$ students of class VIII in an examination are given below:
$$16,17,18, 3, 7, 23, 18,13,10, 21, 7, 1, 13, 21,13, 15, 19, 24, 16, $$$$3, 23, 5, 12, 18, 8, 12, 6, 8, 16, 5, 3, 5, 0, 7, 9, 12 , 20, 10, 2, 23$$.Divide the data into five groups, namely $$0-5$$, $$5-10$$, $$10-15$$, $$15-20$$ and $$20-25$$ and prepare a grouped frequency table.
A die was thrown 25 times and following scores were obtained:
1 5 2 4 3
6 1 4 2 5
1 6 2 6 3
5 4 1 3 2
3 6 1 5 2
Prepare a frequency table of the scores.
The following bar graph shows the number of houses (out of $$100$$) in a town using different types of fuels for cooking. Read the bar graph and answer the following questions:
How many houses are using coal as fuel?
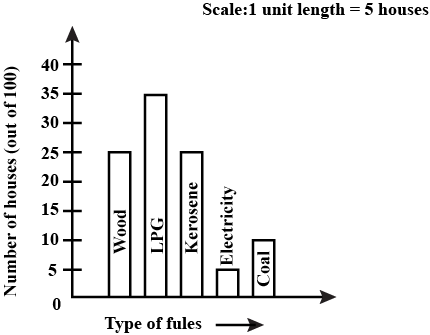
Construct a frequency table with class-intervals $$0-5$$ ($$5$$ not included) of the following marks obtained by a group of $$30$$ students in an examination:
$$0, 5, 7, 10, 12, 15, 20, 22, 25, 27, 8, 11, 17, 3, 6, 9, 17, 19, 21, 29, 31, 35, 37, 40, 42, 45, 49, 4, 50, 16$$.
Construct a frequency distribution table for the following marks obtained by 25 students in a history test in class VI of a school:
$$9,17,12,20,9,18,25,17,19,9,12,9,12,18,17,19,20,25,9,12,17,19,19,20,9$$
The number of students who obtained $$20\ marks =$$ ____.
The following data gives the amount of loans (in crores of rupees) disbursed by a bank during some years:
| Year | $$1992$$ | $$1993$$ | $$1994$$ | $$1995$$ | $$1996$$ |
| Loan(in crores of rupees) | $$28$$ | $$33$$ | $$55$$ | $$55$$ | $$80$$ |
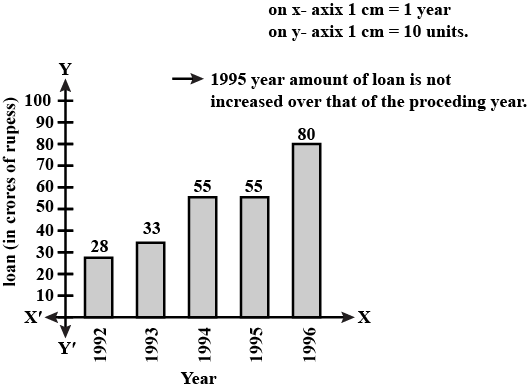
The bar graph as shown in above figure represents the heights (in cm) of $$50$$ students of Class $$XI$$ of a particular school. Study the graph and answer the following questions:
How many students are in the range of shortest height of the class?
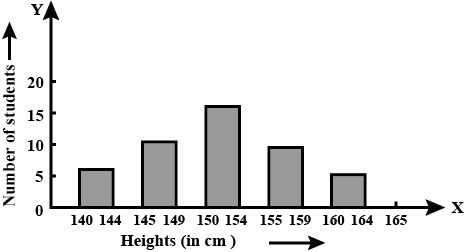
How many students are in the range of shortest height of the class?
Read the following bar graph (Fig.) and answer the following question:What information is given by the bar graph?
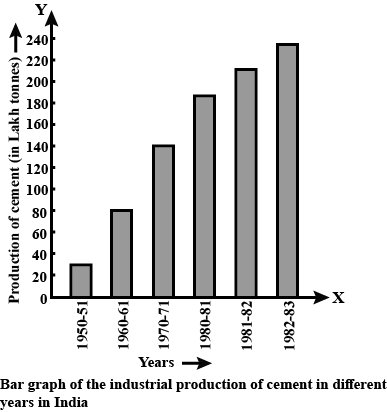
Read the following bar graph and answer the following questions:
What information is given by the bar graph?

The numbers of children in 10 families of a locality are: 2, 4, 3, 4, 2, 3, 5, 1, 1,Find the mean number of children per family.
Two hundred students of class VI and VII were asked to name their favourite colours so as to decide upon what should be the colour of their school house. The results are shown in the following table.
| Colour: | Red | Green | Blue | Yellow | Orange |
| Number of students: | 43 | 19 | 55 | 49 | 34 |
Which is the most prrferred colour and which is least?
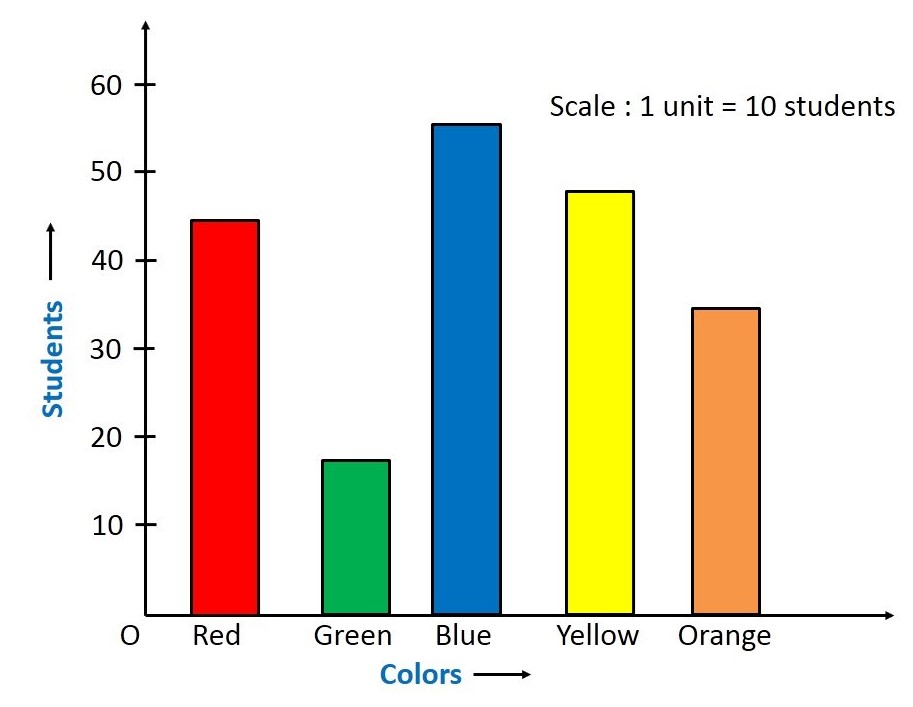
The following data gives the amount of manure (in thousand tonnes) manufactured by a company during some years:
| Year | $$1992$$ | $$1993$$ | $$1994$$ | $$1995$$ | $$1996$$ | $$1997$$ |
| Manure (in thousand tonnes) | $$15$$ | $$35$$ | $$45$$ | $$30$$ | $$40$$ | $$20$$ |
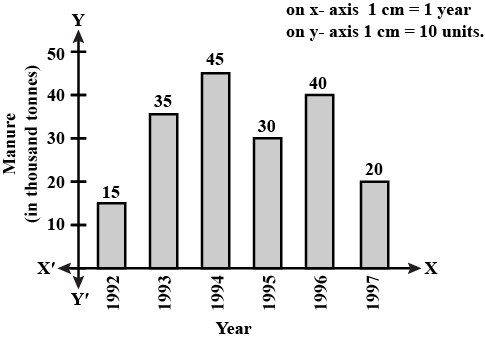
What information is given by the bar graph?
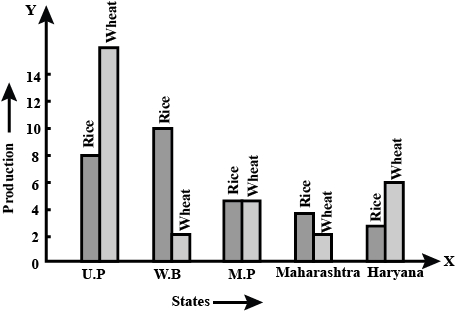
Draw a histogram for the frequency distribution of the following data:
| Class interval | $$ 20-25 $$ | $$ 25-30 $$ | $$ 30-35 $$ | $$ 35-40 $$ | $$ 40-45 $$ | $$ 45-50 $$ |
| Frequency | $$ 320 $$ | $$ 780 $$ | $$ 160 $$ | $$ 540 $$ | $$ 260 $$ | $$ 100 $$ |
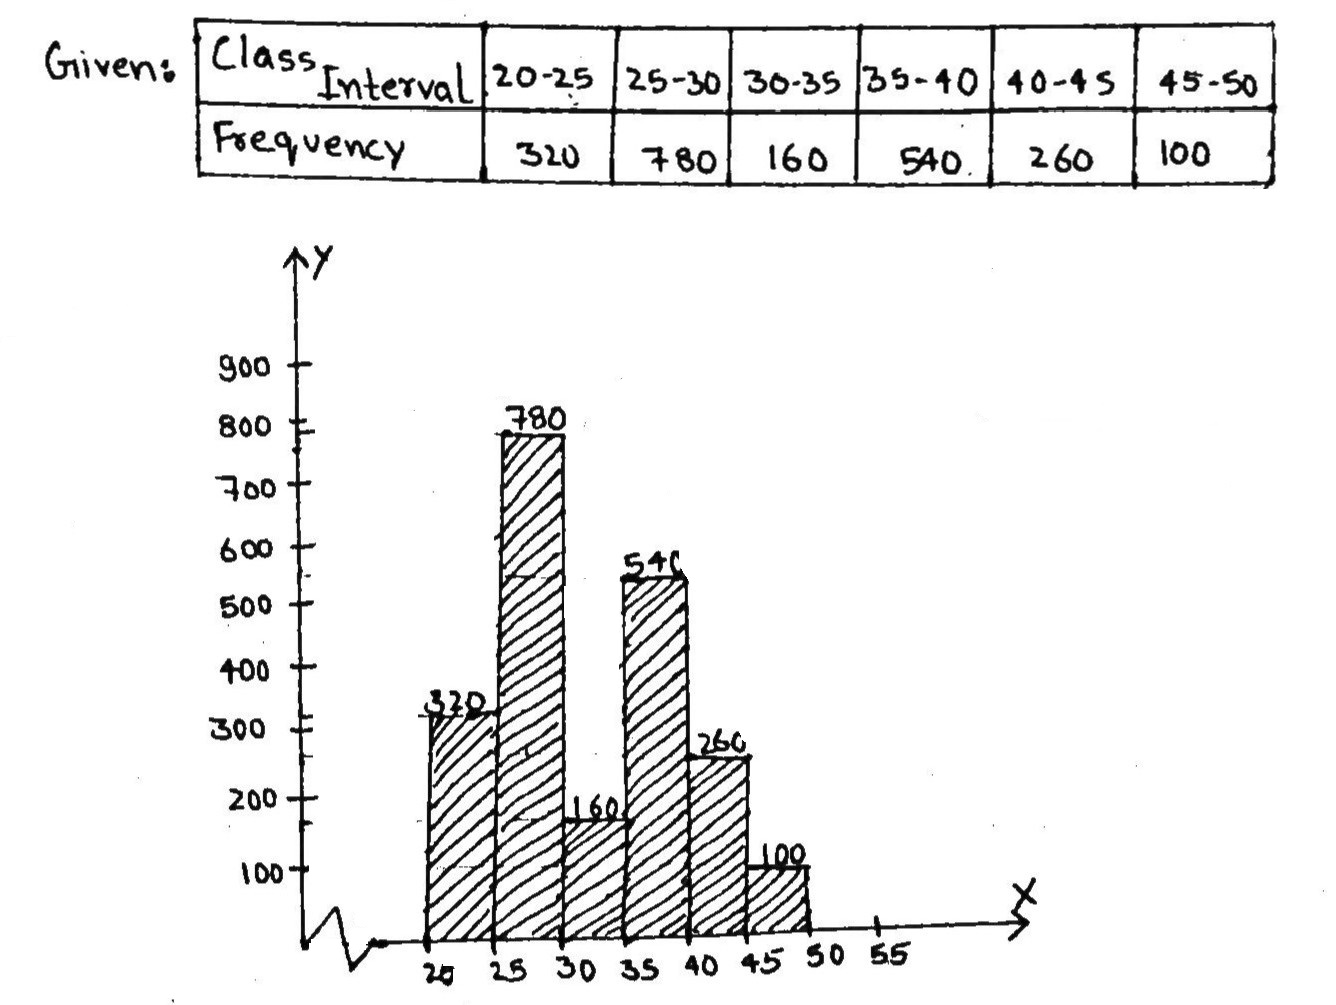
The mean of marks scored by 100 students was found to beLater on it was discovered that a score of 53 was misread asFind the correct mean.
Find the mean of all factors of 10.
If the mean of $$5$$ observations $$x, x+2, x+4, x+6$$ and $$x+8$$ is $$11$$, find the value of $$x$$.
The percentage of marks obtained by students of a class in mathematics are: 64, 36, 47, 23, 0, 19, 81, 93, 72, 35, 3,Find their mean.
Following are the weights (in kg) of 10 new born babies in a hospital on a particular day: 3.4, 3.6, 4.2, 4.5, 3.9, 4.1, 3.8, 4.5, 4.4, 3.Find the mean $$ \overline {X}.$$ (in kg)
If the mean of the following frequency distribution is $$24$$, find the value of $$p$$.
| Class | $$0-10$$ | $$10-20$$ | $$20-30$$ | $$30-40$$ | $$40-50$$ |
| Frequency | $$3$$ | $$4$$ | $$p$$ | $$3$$ | $$2$$ |
Attempt the following question.
Represent the following data by histogram.
| Price of Sugar (per kg in ) | Number of weeks |
| $$18 - 20$$ $$20 - 22$$ $$22-24$$ $$24-26$$ $$26-28$$ $$28-30$$ | $$4$$ $$8$$ $$22$$ $$12$$ $$6$$ $$8$$ |
| Price of sugar (per kg in) | Number of weeks |
| $$18-20$$ | $$ 4$$ |
| $$ 20-22$$ | $$ 8$$ |
| $$ 22-24$$ | $$22 $$ |
| $$24-26$$ | $$ 12$$ |
| $$26-28$$ | $$ 6$$ |
| $$ 28-30$$ | $$ 8$$ |
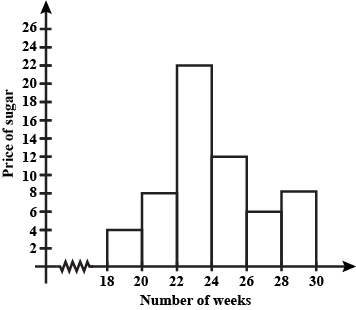
The ages (in years) of $$ 360 $$ patients treated in a hospital on a particular day are given below:
| Age (in years ) | $$ 10-20 $$ | $$ 20-30 $$ | $$ 30-40$$ | $$ 40- 50 $$ | $$ 50 -60 $$ | $$ 60-70 $$ |
| Number of patients | $$ 90 $$ | $$ 40 $$ | $$ 60 $$ | $$ 20 $$ | $$ 120 $$ | $$ 30 $$ |
Draw a histogram for the given data.
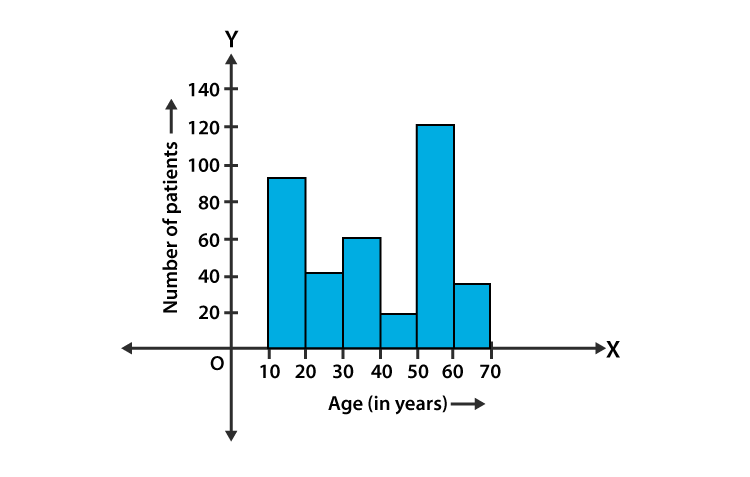
Look at the bar graph given.
In which subject is the student best?

The number of children in $$25$$ families of a colony are given below:
$$2,0,2,4,2,1,3,3,1,0,2,3,4,3,1,1,1,2,2,3,2,4,1,2,2.$$
Represent the above data in the form of a frequency distribution table.
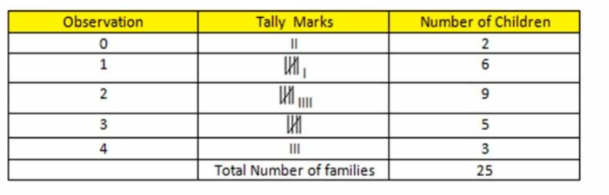
Look at the bar graph given.
In which subject is the student poorest?

In s survey of $$60$$ families of a colony, the number of members in each family was recorded and the data has been represented by the bar graph given below:
What information does the bar graph give?
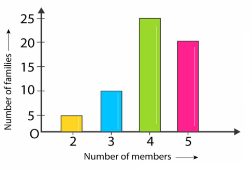
Look at the bar graph given.
What information does the bar graph give?
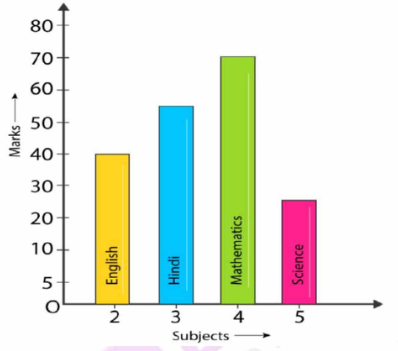
Fill in the blanks:
The number of times a particular observation occurs is called its..........
Look at the bar graph given.
In which subjects did the student get more than $$40$$ marks?

The scale of shoes of various sizes at a shop on a particular day is given below:
$$6,9,8,5,5,4,9,8,5,6,9,9,7,8,9,7,6,9,8,6,7,5,8,9,4,5,8,7.$$
Represent the above data in the form of a frequency distribution table.
If the mean of the following distribution is 7.5, find the missing frequency "f".
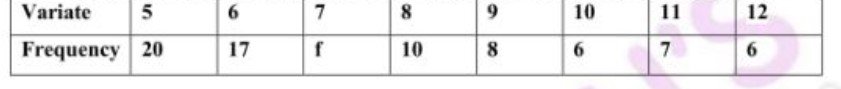
$$\therefore \text{Mean}=\dfrac{\Sigma fx}{\Sigma f} $$
$$7.5=\dfrac{563+f}{74+7f}$$
$$7.5\times(74+7f)=(563+7f)$$
$$7.5f-7f=563-555$$
$$0.5f=8$$
$$\therefore f=8/0.5=16$$
Hence the missing value of $$f$$ is $$16$$.
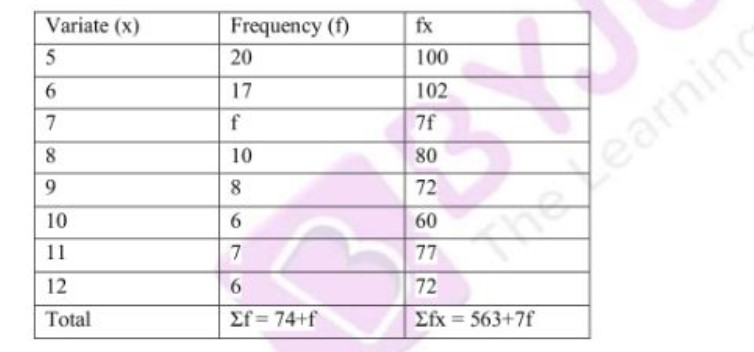
Find the class mark of the class $$10-25$$.
The following distribution shows the daily pocket allowance for children of a locality. The mean pocket allowance is Rs.$$18$$. Find the value of f.
Daily pocket allowance in Rs. | 11-13 | 13-15 | 15-17 | 17-19 | 19-21 | 21-23 | 23-25 |
No. of children | 3 | 6 | 9 | 13 | f | 5 | 4 |
The following bar graph shows the number of houses (out of $$100$$) in a town using different types of fuels for cooking. Read the bar graph and answer the following questions:
Which fuel is used in a maximum number of houses?
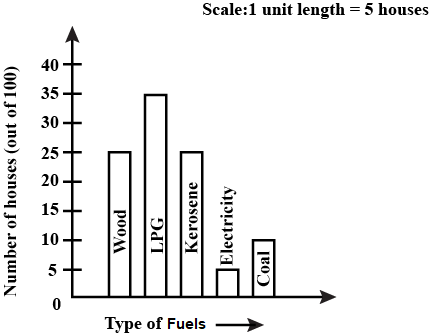
Fill in the blanks
In a bar graph, ________ can be drawn horizontally or vertically.
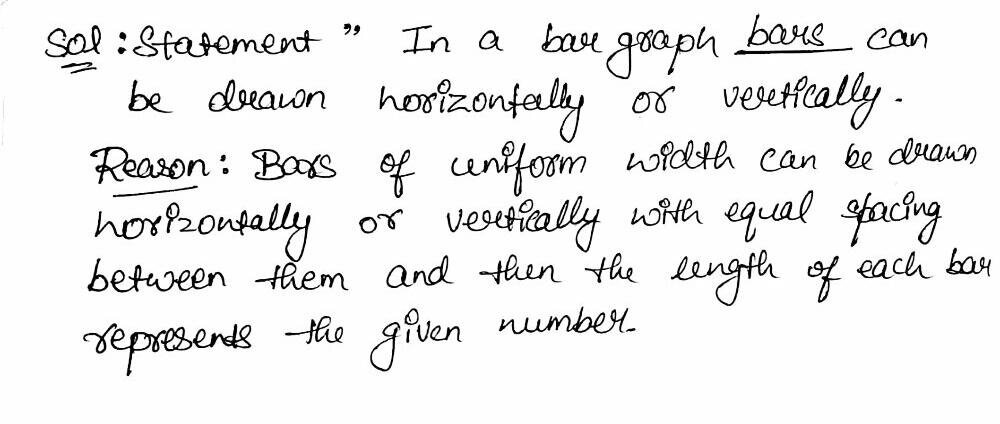
The following bar graph represents the data for different sizes of shoes worn by the students in a school. Read the graph and answer the following questions.
Which shoe size is worn by the maximum number of students?
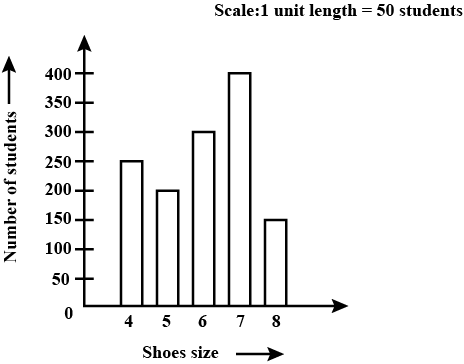
The following bar graph represents the data for different sizes of shoes worn by the students in a school. Read the graph and answer the following questions.
What is the number of students wearing shoe size $$6$$?

The following graph gives information about
the number of railway tickets sold for different cities
on a railway ticket counter between $$6.00$$ am to $$10.00$$ am. Read the bar graph and answer the following
questions
How many tickets were sold in all?

The following bar graph shows the number of houses (out of $$100$$) in a town using different types of fuels for cooking. Read the bar graph and answer the following questions:
Suppose that the total number of houses in the town is $$1$$ lakh. From the above graph estimate, the number of houses using electricity.

The following bar graph represents the data for different sizes of shoes worn by the students in a school. Read the graph and answer the following questions.
What are the different sizes of the shoes worn by the students?

The following graph gives information about the number of railway tickets sold for different cities on a railway ticket counter between $$6.00$$ am to $$10.00$$ am. Read the bar graph and answer the following questions
For which city were the maximum numbers of tickets sold?
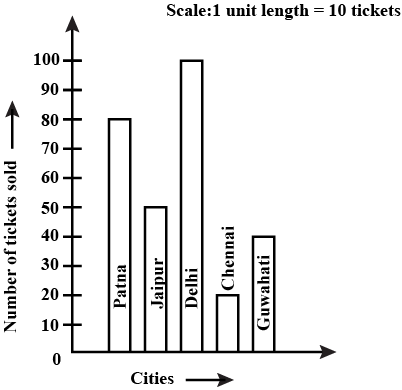
The following table represents the income of a Gram Panchayat from different sources in a particular year:
| Sources | Income (in Rs) |
| Income from local taxes Funds received from government Donations Income from other resources | 75000 150000 25000 50000 |
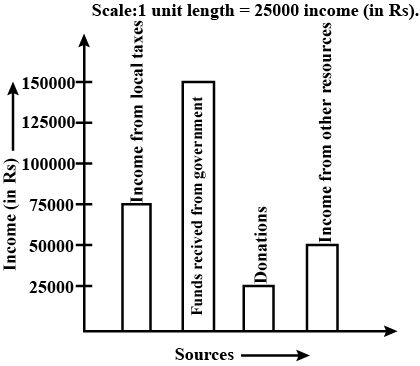
The following graph gives information about the number of railway tickets sold for different cities on a railway ticket counter between $$6.00$$ am to $$10.00$$ am. Read the bar graph and answer the following questions
Fill in the blanks:
The number of tickets sold for Delhi and Jaipur together exceeds the total number of tickets sold for Patna and Chennai by _______.

The bar graph given below represents the approximate length (in kilometers) of some National
Highways in India. Study the bar graph and answer
the following questions:
Which National Highway (N.H.) is the longest among
the above?

The following graph gives information about the number of railway tickets sold for different cities on a railway ticket counter between $$6.00$$ am to $$10.00$$ am. Read the bar graph and answer the following questions
For which city were the minimum numbers of tickets sold?

Read the bar graph given below and answer the
following question:
In which year is the number of students maximum, and what was the number of students in that year?

Read the bar graph given below and answer the
following questions:
What information is given by the bar graph?

The bar graph shown above represents the circulation of newspapers in different languages in a town. Study the bar graph and answer the following question:
What is the circulation of the English newspaper?

The bar graph given below represents the approximate length (in kilometers) of some National Highways in India. Study the bar graph and answer the following questions:
Which National Highway is the shortest among the
above?
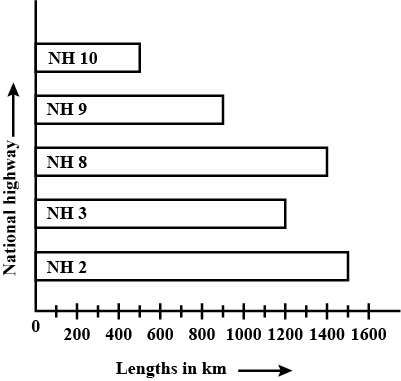
The bar graph given below represents the approximate length (in kilometers) of some National Highways in India. Study the bar graph and answer the following questions:
Which National Highway is the shortest among the
above?

The bar graph given below represents the
circulation of newspapers in different languages in a
town. Study the bar graph and answer the following
questions:
By how much is the circulation of newspapers in Hindi
more than the newspaper in Bengali?
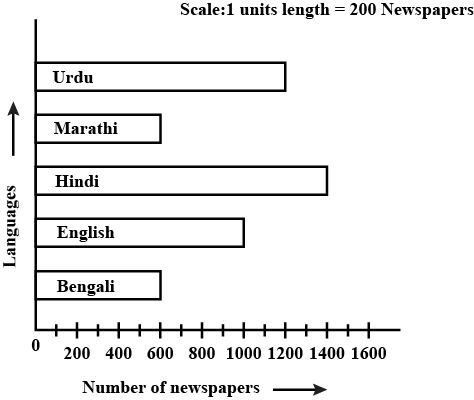
The bar graph given below represents the
circulation of newspapers in different languages in a
town. Study the bar graph and answer the following
questions:
Name the two languages in which the circulation of the
newspaper is the same.

Read the bar graph given below and answer the
following questions:
In which year is the increase in the number of students
maximum as compared to the previous year?
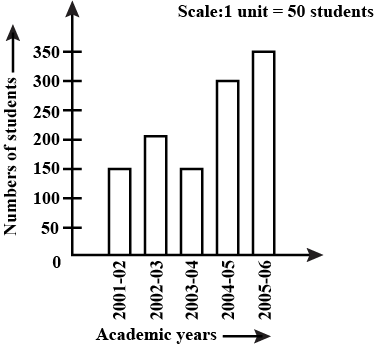
Read the bar graph given below and answer the
following questions:
In which year did the number of students decrease as
compared to the previous year?

Read the bar graph given below and answer the
following questions:
In which year is the number of students twice as that of $$2001-02$$?

Prepare a bar graph of the data. Crop Area of land (in million hectors) Rice
Wheat 50
30 Pulses
Sugarcan
Cotton 20
25
15
| Crop | Area of land (in million hectors) |
| Rice Wheat | 50 30 |
| Pulses Sugarcan Cotton | 20 25 15 |
Crops on the horizontal axis.
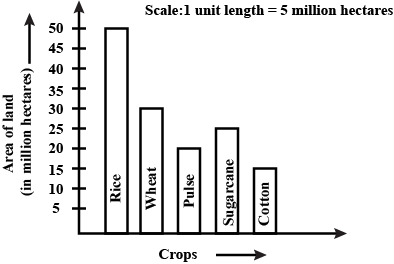
Prepare a bar graph of the data.
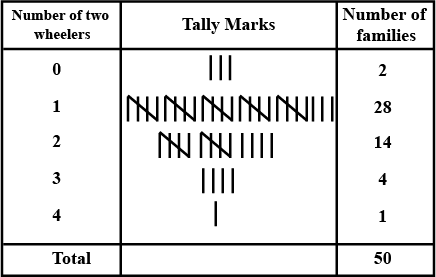
| Number of two-wheelers | Number of families |
| 0 1 2 3 4 | 2 28 14 4 1 |
two-wheelers on the horizontal axis.
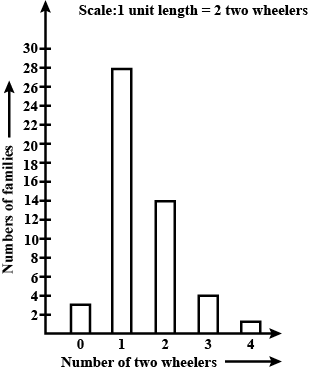
Number of mobile phone users in various age
groups in a city are listed below:
| Age group (in years) | Number of mobile users |
| 1 - 20 21 - 40 41 - 50 61 - 80 | 25000 40000 35000 10000 |
in the year on the horizontal axis.
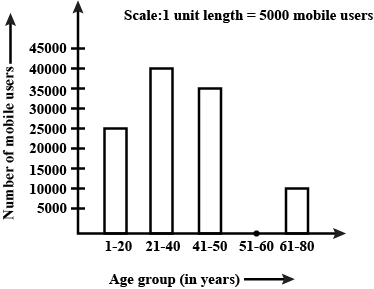
The following table gives the number of vehicles passing through a toll gate, every hour from $$8.00$$ am. to $$1.00$$ pm:
| Time Interval | 8.00 to 9.00 | 9.00 to 10.00 | 10.00 to 11.00 | 11.00 to 12.00 | 12.00 to 1.00 |
| Number of vehicles | 250 | 450 | 300 | 250 | 150 |
Solution:
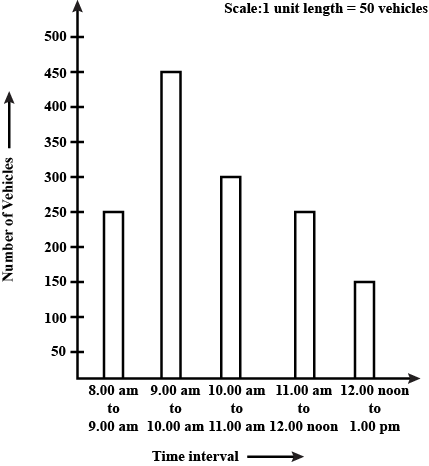
In a botanical garden, the numbers of different types of plants are found as follows:
| Type of the plant | Number of plants |
| Herb Shrub Creeper Climber Tree | 50 60 20 45 95 |
answer the following questions:
on the horizontal axis.
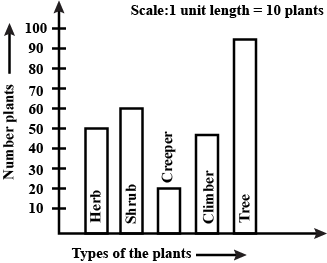
The following table gives the data on the number of schools (stage-wise) of a country in the year $$2002$$.
| Stage | Number of schools (in thousands) |
| Primary Upper primary Secondary Higher Secondary | 80 55 30 20 |
horizontal axis.
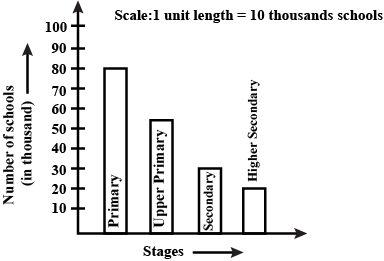
Prepare a bar graph of the data given in the question.
| Surname | Number of people |
| Khan | $$3\times 100 + 50 = 350$$ |
| Patel Rao Roy Saikia Singh | $$5\times 100 = 500$$ $$4\times 100 = 400$$ $$4\times 100 = 400$$ $$2\times 100 = 200$$ $$3\times 100 = 300$$ |
Surname on the horizontal axis.
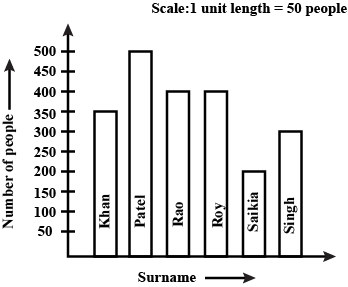
The number of people owning book less than $$ 40 $$ is ______
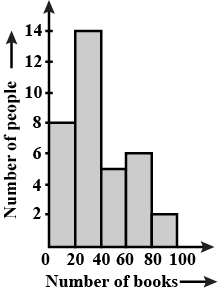
The representation of data with bars of uniform width is called ______.
The marks in a subject for 12 students are as follows:
$$31, 37, 35, 38, 42, 23, 17, 18, 35, 25, 35, 29$$
For the given data, find the
(a) Range (b) Mean (c) Median (d) Mode
Fill in the blanks(Refer fig)
The total number of people owning books more than $$ 60 $$ is _____

When the number of observations is large , the observation are usually organised in groups of equal width called __________
The number of times a particular observation occurs in a given data is called its _____
The above histogram shows the number of literate females in the age group of 10 to 40 years in town.
(a) Write the classes assuming all the classes are of equal width.
(b) What is class's width?
(c) In which age group are literate females the least?
(d) In which age group is the number of literate females the highest?
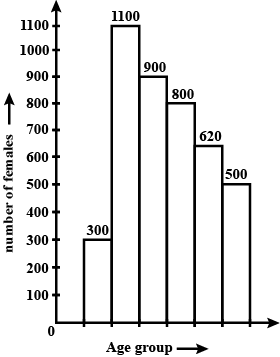
In a histogram, ________ are drawn with width equal to a class interval without leaving any gap in between.
The class size of the interval $$ 80 -85 $$ is ______
Given below are heights of $$15$$ boys of a class measured in cm:
$$128,144,146,143,136,142,138,129,140,152,144,140,150,142,154$$
Find
(a) The height of the tallest boy.
(b) The height of the shortest boy.
(c) The range of the given data.
(d) The median height of the boys.
The top speeds to $$30$$ different land animals have been organized into a frequency table. Draw a histogram for the given data.
| Class interval | Frequency |
| $$ 10 -20 $$ | $$ 5 $$ |
| $$ 20 -30 $$ | $$ 5 $$ |
| $$ 30 - 40 $$ | $$10 $$ |
| $$ 40 -50 $$ | $$ 8 $$ |
| $$ 50 -60 $$ | $$ 0 $$ |
| $$ 60 -70 $$ | $$ 2 $$ |
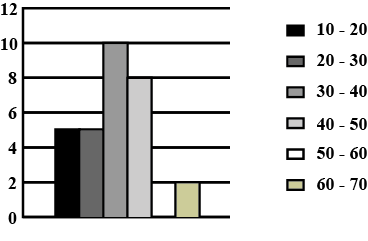
Given below is a frequency distribution table. read it and answer the questions that follow.
| Class interval | Frequency |
| $$ 10-20 $$ | $$ 5 $$ |
| $$ 20-30 $$ | $$ 10 $$ |
| $$ 30- 40 $$ | $$ 4 $$ |
| $$ 40 -50 $$ | $$ 15 $$ |
(a) What is the lower limit of the second class interval ?
(b) What is the upper limit of the last class interval ?
(c) What is the frequency of the third class ?
(d) Which interval has a frequency of $$ 10 $$?
(e) Which interval has the lowest frequency ?
(f) What is the class size ?
Look at the histograms below answer the questions that follow
(a) How many students have height more than or equal to $$ 135\ cm $$ but less than $$ 150\ cm $$?
(b) Which class interval has the least number of students ?
(c) What is the class size ?
(d) How many students have height less than $$ 140\ cm $$ ?
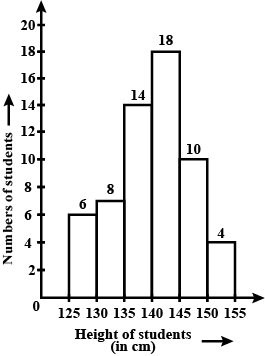
The graph shows the maximum temperatures recorded for two consecutive weeks of a town. Study the graph and answer the questions that follow.
What were the temperatures for both the weeks on Thursday?
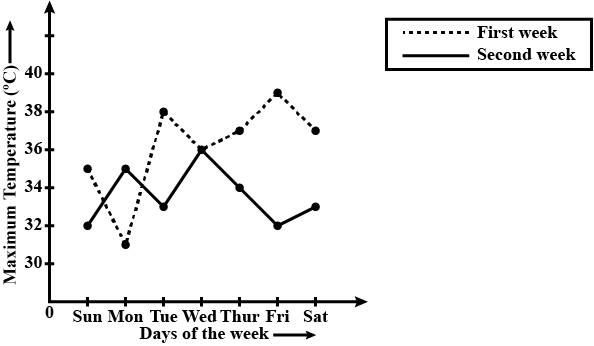
Expenditure on Education of a country during a five year period (2002-2006), in crores of rupees, is given below:
| Elementary Education | 240 |
| Secondary Education | 120 |
| University Education | 190 |
| Teacher's Training | 20 |
| Social Education | 10 |
| Other Education programmes | 115 |
| Culture Programmes | 25 |
| Technical Education | 125 |
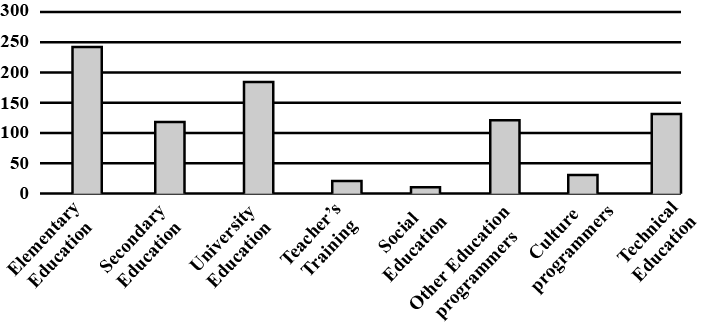
Observe the given bar graph carefully and answer the question that follow.
(a) What information does the bar graph depict?
(b) How many motor bikes were produced in the first three months?
(c) Calculate the increase in production in May over the production in January.
(d) In which month the production was minimum and what was it?
(e) Calculate the average (mean) production of bikes in 6 months.
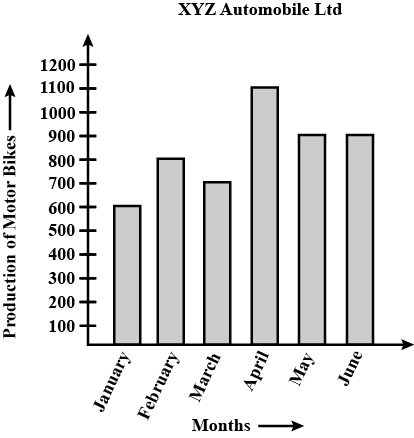
Observe the given data:
| Day of the Week | Mon | Tues | Wed | Thurs | Fri | Sat |
| Numbers of Mobile Phone Sets Sold | 50 | 45 | 30 | 55 | 27 | 60 |
(b) On which day of the week was the sales maximum?
(c) Find the total sales during the week.
(d) Find the ratio of the minimum sale to the maximum sale.
(e) Calculate the average sale during the week.
(f) On how many days of the week was the sale above the average sales?
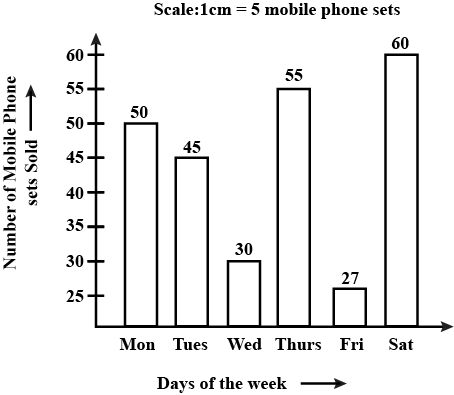
Study the bar graph given below and answer the questions that follow:
(a) What information is depicted from the bar graph?
(b) In which subject is the student very good?
(c) Calculate the average marks of the student.
(d) If 75 and above marks denote a distinction, then name the subjects in which the student got distinction.
(e) Calculate the percentage of marks the student got out of 500.
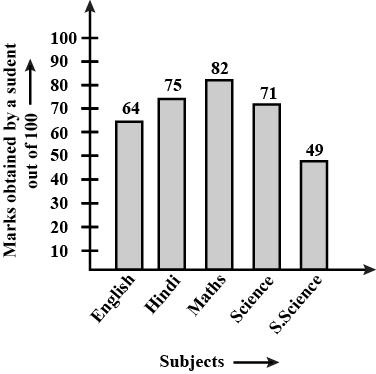
The following table gives the frequencies of most commonly used letters $$a,e,i,o,r,t,u$$ from a page of a book:
| Letters | a | e | i | o | r | t | u |
| Frequency | 75 | 125 | 80 | 70 | 80 | 95 | 75 |
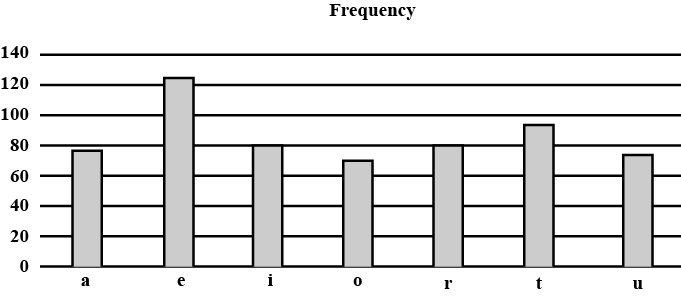
Class 9 Maths Extra Questions
- Areas Of Parallelograms And Triangles Extra Questions
- Circles Extra Questions
- Constructions Extra Questions
- Coordinate Geometry Extra Questions
- Heron'S Formula Extra Questions
- Introduction To Euclid'S Geometry Extra Questions
- Linear Equations In Two Variable Extra Questions
- Lines And Angles Extra Questions
- Number Systems Extra Questions
- Polynomials Extra Questions
- Probability Extra Questions
- Quadrilaterals Extra Questions
- Statistics Extra Questions
- Surface Areas And Volumes Extra Questions
- Triangles Extra Questions