Sectors Of The Indian Economy - Class 10 Economics - Extra Questions
For each of the sectors that we came across in this chapter why should one focus on employment and GDP? Could there be other issues which should be examined? Discuss.
What was tertiary sector's contribution to the GDP in the year 2010-11?
Which sector of economy in India bears most of the workforce?
There are some activities which government has to do, not everything can be done by private sector. Explain.
Greater the development of the primary and secondary sectors, more would be the demand for services. Discuss
Workers in the agricultural sector are underemployed. Explain
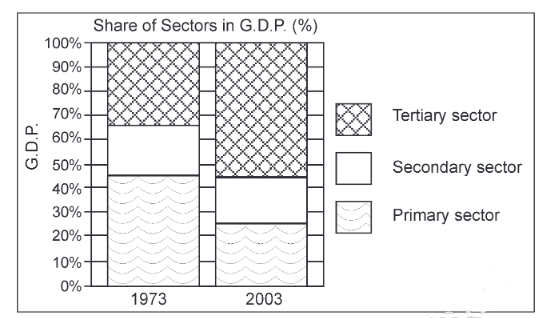
Which was the largest producing sector in 2003? What was its contribution to the GDP?

What was the main reason for the highest increase in GDP in this sector in comparison to other sectors?
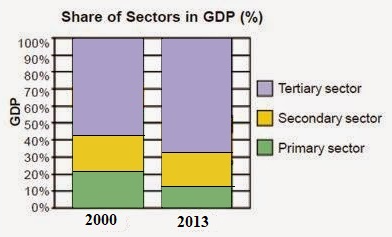
The following table gives the GDP in Rupees (Crores) by the three sectors:
| Year | Primary | Secondary | Tertiary |
| 2000 | 52,000 | 48,500 | 1,33,500 |
| 2013 | 8,00,500 | 10,74,000 | 38,68,000 |
(ii) Show the data as a bar diagram similar to Graph 2 in the chapter.
(iii) What conclusions can we draw from the bar graph?
(i) In 2000,
primary sector = 22.22%, secondary sector = 20.73%, tertiary sector = 57.04%
In 2013,
primary sector = 13.94%, secondary sector = 18.70%, tertiary sector = 67.36%.
(ii) Given in figure.
(iii) We can draw the conclusion that the share of the tertiary sector in the GDP has increased by 10%, while that of the primary sector has almost halved. The secondary sector has grown by about 2% in the last 13 years.
When we produce a good by exploiting natural resources, it is an activity of the primary sector. Why?
Which was the largest producing sector in 1973? Give one reason.

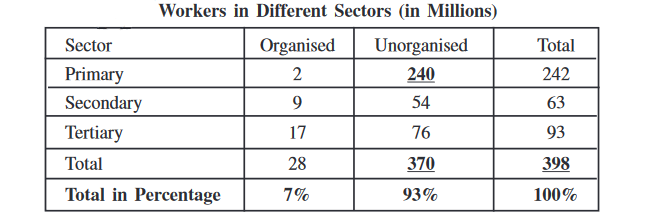
The table above shows the estimated number of workers in India in the organized and unorganized sectors. Read the table carefully. Fill in the missing data and answer the questions that follow.
(i) Which is the most important sector that provides the most jobs to the people?
(ii) What is the number of persons engaged in the unorganized sector?
(iii) Why is the unorganized sector more important? Give one reason.
(iv) Which is the most important organised sector? Give one reason.
The following table gives the GDP in Rs. (crores) by three sectors. read the table carefully and answer the question:
| Year | Primary | Secondary | Tertiary |
| 1950 | 80000 | 19000 | 39000 |
| 2000 | 314000 | 280000 | 555000 |