Data Handling - Class 6 Maths - Extra Questions
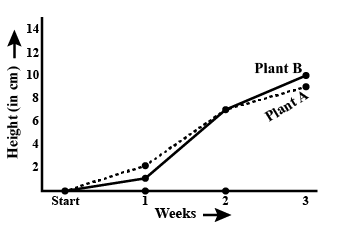
How high was plant $$A$$ after (i) $$2$$ weeks (ii) $$3$$ weeks.

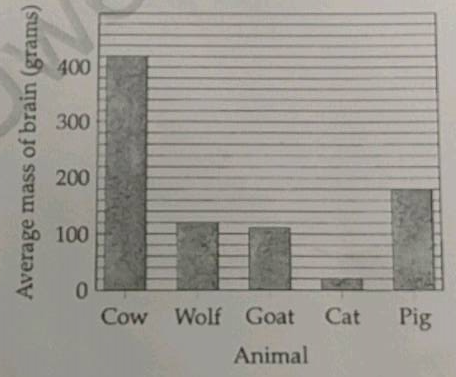
According to the graph above, find the difference between the average masses of brains of Cow and Pig.
What is the scale on Y-axis?
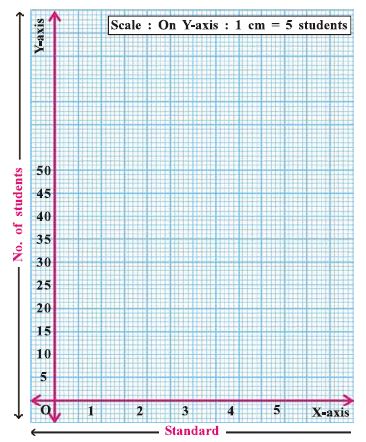
Given bar graph is the representation of registered number of students of Standard $$1$$ to $$5$$ of your school.
Which information is given by the graph?
What is shown on Y-axis?
During which week did plant $$B$$ grow least.

How much did plant $$B$$ grow from the end of the $$2nd$$ week to the end of the $$3rd$$ week.

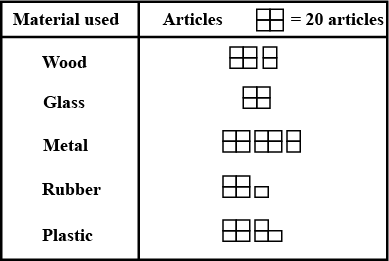
Students of Class VI in a school were given a task to count the number of articles made of different materials in the school. The information collected by them is represented as follows:
Observe the pictograph and answer the following questions:
What is the total number of articles counted by the students?
During which week did plant $$A$$ grow most.
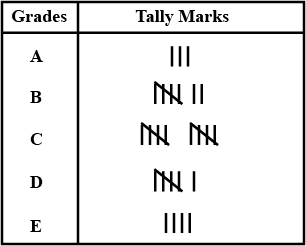
In an examination, the grades achieved by $$30$$ students of a class are given below. Arrange these
grades in a table using tally marks:
B, C, C, E, A, C, B, B, D, D, D, D, B, C, C, C, A, C, B,
E, A, D, C, B, E, C, B, E, C, D
Above pictograph shows the number of tractors in five villages.
Observe the pictograph and answer the following questions
How many more tractors village C has as compared to village B.

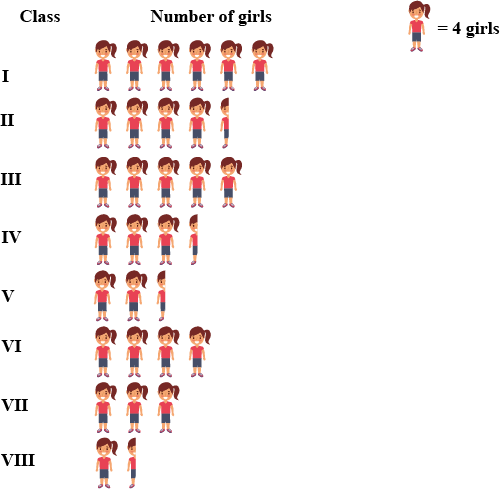
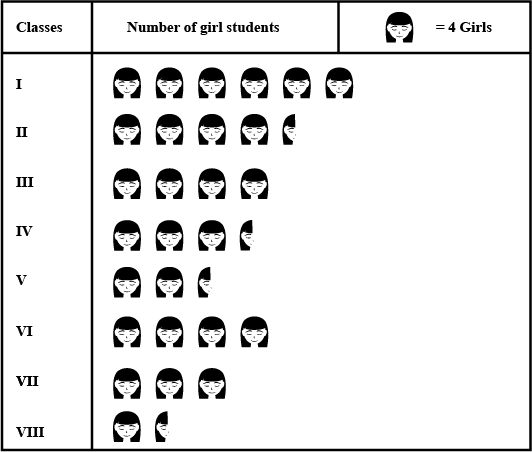
The number of girl students in each class of a co-educational middle school is depicted by the pictograph.
Observe this pictograph and answer the following questions:
Which class has the minimum number of girl students ?

Above pictograph shows the number of tractors in five villages.
Observe the pictograph and answer the following question
Which village has the maximum number of tractors ?

The number of girl students in each class of a co-educational middle school is depicted by the pictograph.
Observe this pictograph and answer the following question:
How many girls are there in Class VII ?

Above pictograph shows the number of tractors in five villages.
Observe the pictograph and answer the following question.
Which village has the minimum number of tractors ?
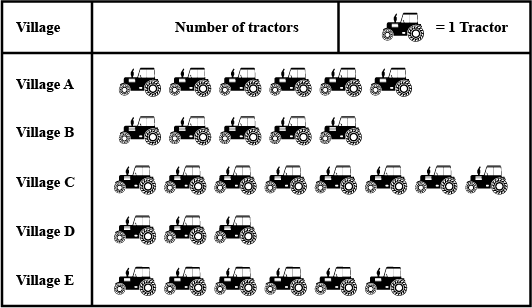
Above pictograph shows the number of tractors in five villages.
Observe the pictograph and answer the following questions
What is the total number of tractor in all the five villages ?

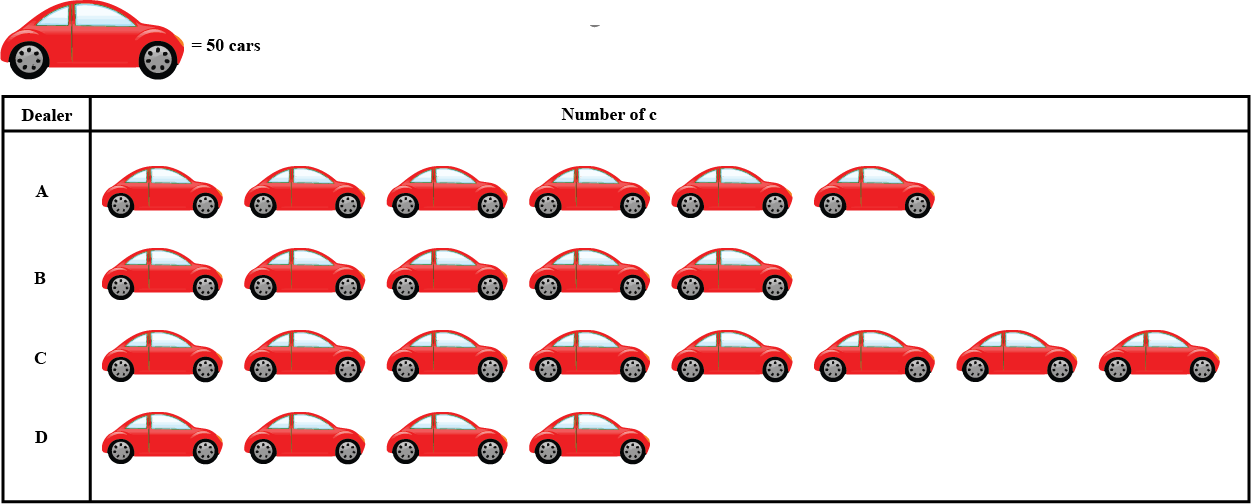
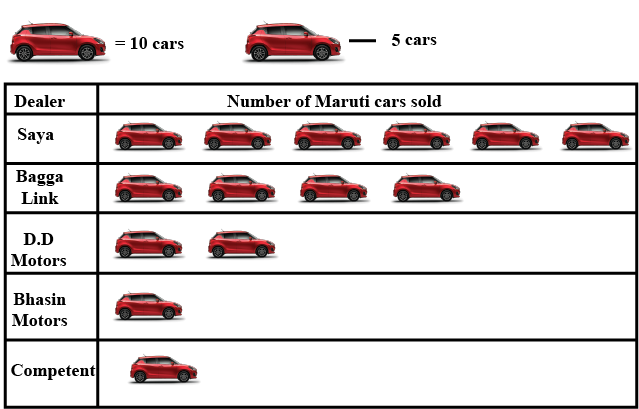
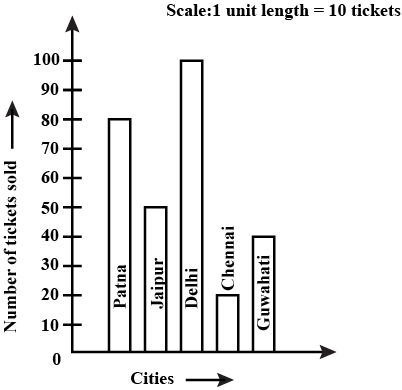
The following pictograph shows the number of cars sold by four dealers $$A, B, C$$ and $$D$$ in a city. Scale:
Using the pictograph, draw above, answer the following question:
What is the total number of cars sold by all the dealers?

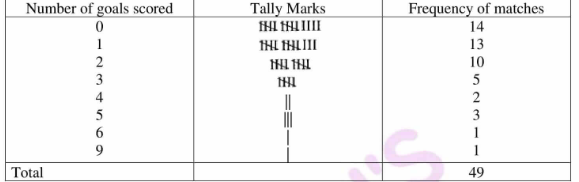
The number of goals second by a football term in different matches is given below:
$$3,1,0,4,6,0,0,1,1,2,2,3,5,1,2,0,1,0,2,3,9,2,0,1,0,1,4,1,0,2,5,1,2,\\2,3,1,0,0,0,1,1,0,2,3,0,1,5,2,0$$
Make a frequency distribution table using tally makers.
Frequency table for the given data is as follows:
The following pictograph shows the number of cars sold by four dealers $$A, B, C$$ and $$D$$ in a city. Scale: 1 car image = 50 cars
Using the pictograph, drawn above, answer the following question :
(i) how many more cars has dealer A sold as compared to dealer D ?
(ii) What is the total number of cars sold by all the dealers ?
Using the pictograph, shown above, answer the following question:
How many more cars has dealer $$A$$ sold as compared to dealer $$D$$?
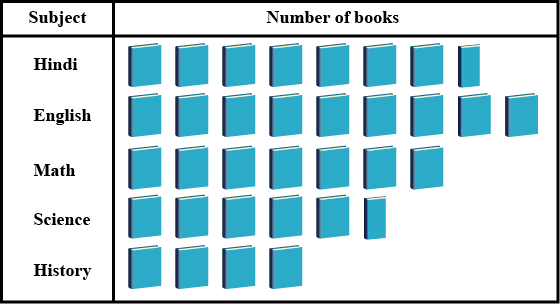
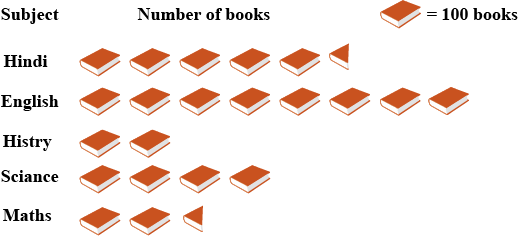
The following pictograph shows different subject books which are kept in a school library.
Taking symbol of one book $$=50$$ books, find:
Which books are maximum in number?
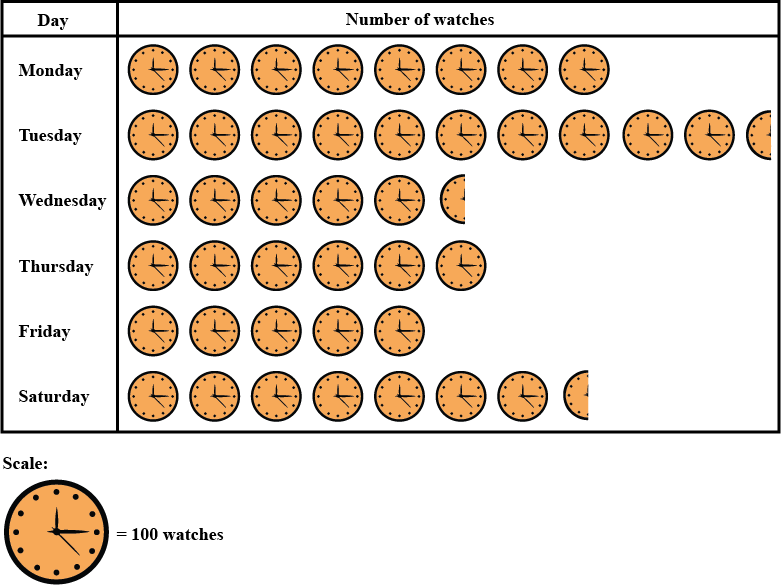
The following pictograph shows the number of watches manufactured by a factory, in a particular weeks.
Find:
total number of watches manufactured in the whole week?
The following pictograph shows different subject books which are kept in a school library.
Taking symbol of one book $$=50$$ books, find:
how many History books are there in the library?

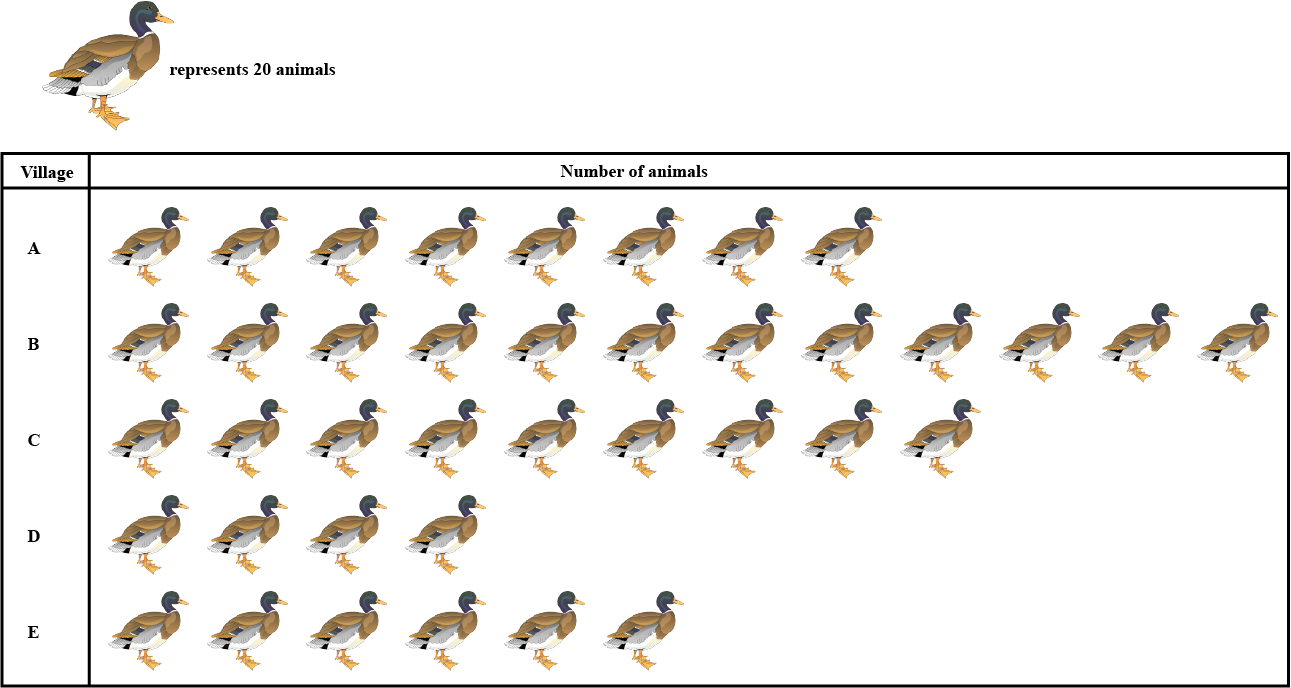
The number of animals in five villages are as follows:
| Village | $$A$$ | $$B$$ | $$C$$ | $$D$$ | $$E$$ |
| No. of animals | $$160$$ | $$240$$ | $$180$$ | $$80$$ | $$120$$ |
The pictograph representing animals in five villagesis as follows:
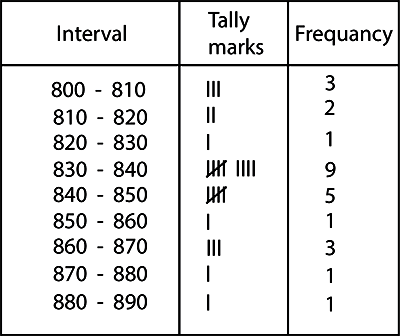
The weekly wages (in $$Rs$$) of $$30$$ workers in a factory are:
$$830, 835, 890, 810, 835, 836, 869, 845, 898, 890, 820, 860, 832, 833$$, $$855, 845, 804, 808, 812, 840, 885, 835, 835, 836, 878, 840, 868, 890$$, $$806, 840$$
Using tally marks make a frequency table with intervals as $$800-810, 810-820$$ and so on
Interval Tally marks Frequency
$$800-810$$ $$|||$$ $$3$$
$$810-820$$ $$||$$ $$2$$
$$820-830$$ $$|$$ $$1$$
$$830-840$$ $$\not{||||}$$ $$|||$$ $$9$$
$$840-850$$ $$\not{||||}$$ $$5$$
$$850-860$$ $$|$$ $$1$$
$$860-870$$ $$|||$$ $$3$$
$$870-880$$ $$|$$ $$1$$
$$880-890$$ $$|$$ $$1$$
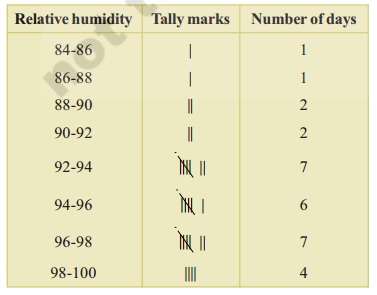
The relative humidity (in %) of a certain city for a September month of $$30$$ days was as follows:
| $$98.1$$ | $$98.6$$ | $$99.2$$ | $$90.3$$ | $$86.5$$ | $$95.3$$ | $$92.9$$ | $$96.3$$ | $$94.2$$ | $$95.1$$ |
| $$89.2$$ | $$92.3$$ | $$97.1$$ | $$93.5$$ | $$92.7$$ | $$95.1$$ | $$97.2$$ | $$93.3$$ | $$95.2$$ | $$97.3$$ |
| $$96.0$$ | $$92.1$$ | $$84.9$$ | $$90.0$$ | $$95.7$$ | $$98.3$$ | $$97.3$$ | $$96.1$$ | $$92.1$$ | $$89$$ |
The grouped frequency distribution table is follows-
Note: $$90$$ comes in interval $$90-92$$ likewise $$96$$ comes in $$96-98$$ class interval.
Note: $$90$$ comes in interval $$90-92$$ likewise $$96$$ comes in $$96-98$$ class interval.
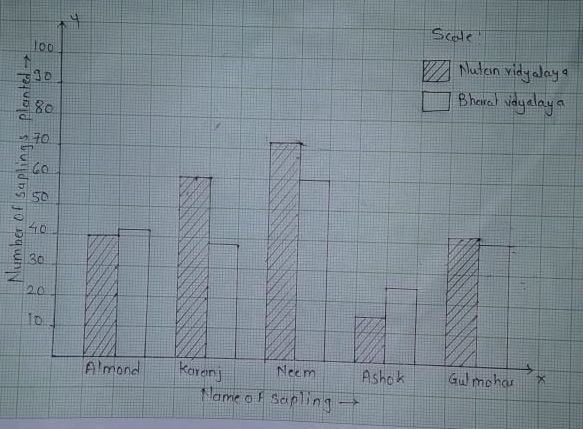
| School / Name of sapling | Almond | Karanj | Neem | Ashok | Gulmohar |
| Nutan Vidyalay | 40 | 60 | 72 | 15 | 42 |
| Bharat Vidyalaya | 42 | 38 | 60 | 25 | 40 |
$$\Rightarrow$$ The above graph shows joint bar graph.
$$\Rightarrow$$ On $$x-axis$$ contains name of saplings and $$y-axis$$ contains number of sapling planted.
The marks obtained by 40 students of a class are given below :
$$80, 10, 30, 70, 60, 50, 50, 40, 40, 20, 40, 90, 50, 30, 70, 10, 60, 50, 20, 70, 70, 30, 80, 40, 20, 80,$$$$ 90, 50, 80, 60, 70, 40, 50, 60, 90, 60, 40, 40, 60$$, and $$60$$
How many students obtained marks below $$40$$ ?
How many students obtained marks below $$40$$ ?
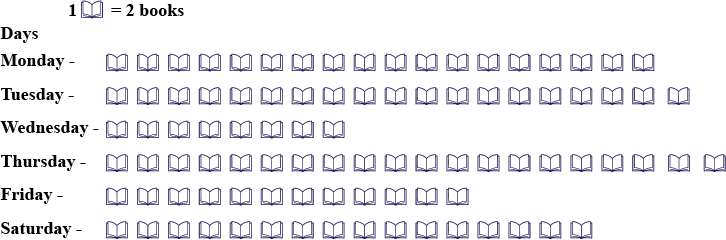
The numbers of books odd by a a shop doing a weak is given below Monday-$$36$$, Tuesday-$$38$$, Wednesday- $$16$$, Thursday- $$40$$, Friday-$$24$$, Saturday-$$32$$. Prepare pictograph.
How high was plant $$B$$ after (i) $$2$$ weeks (ii) $$3$$ weeks.

How much did plant $$A$$ grow during the $$3rd$$ week.

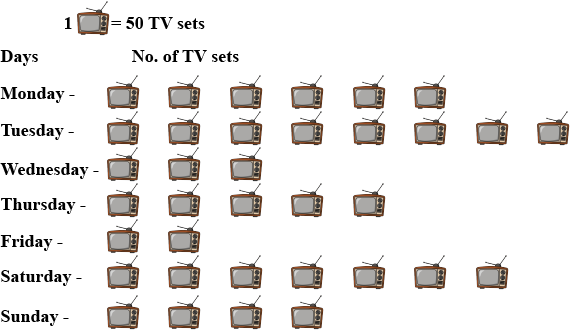
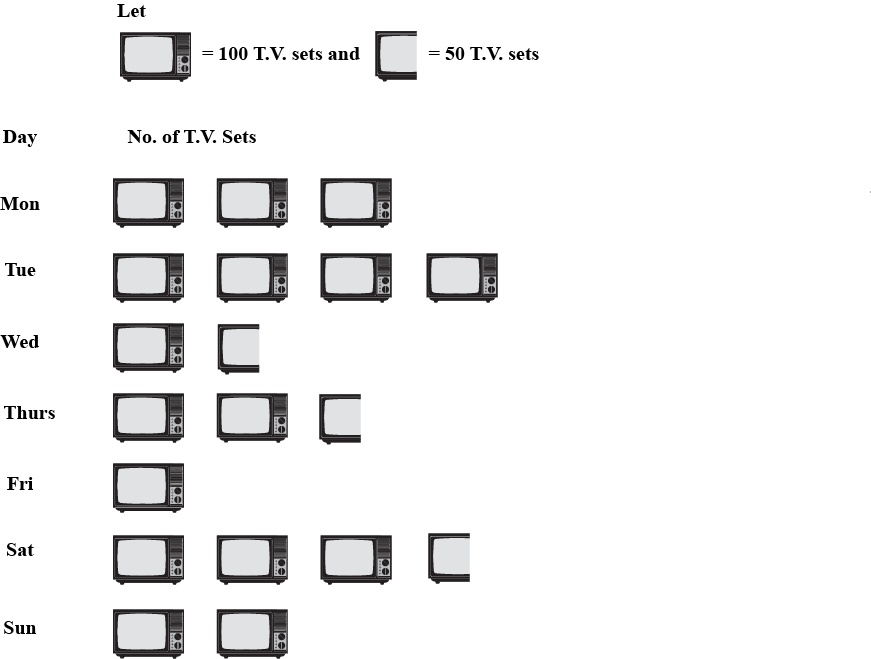
The following table shows the daily production of T.V. sets in an industry for 7 days of a week:
| Day | Mon | Tue | Wed | Thurs | Fri | Sat | Sun |
| Number of T.V. Sets | 300 | 400 | 150 | 250 | 100 | 350 | 200 |
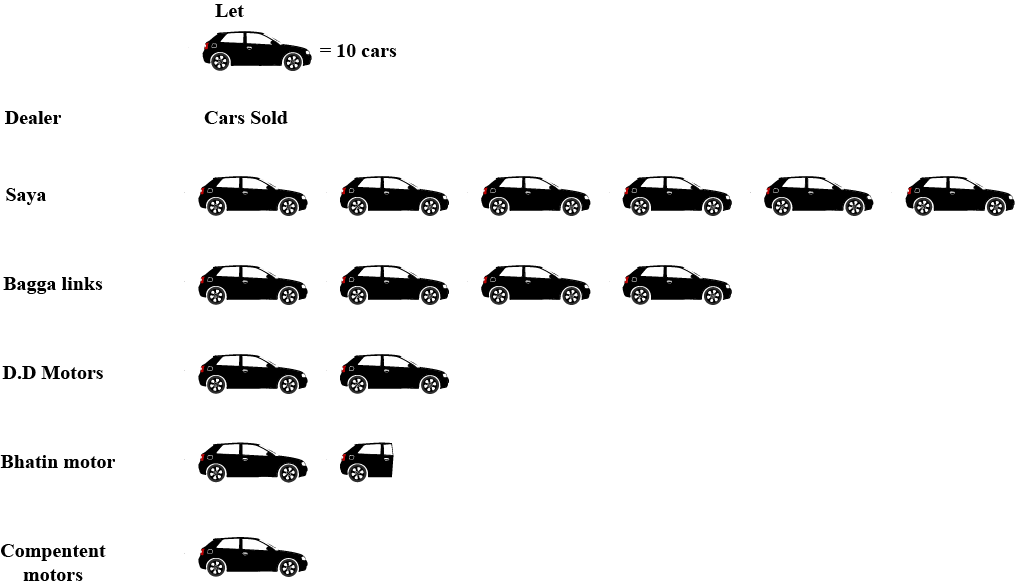
The following table shows the number of Maruti cars sold by five dealers in a particular month:
| Dealer: | Saya | Bagga Links | D.D Motors | Bhasin Motors | Competent |
| Cars sold: | 60 | 40 | 20 | 15 | 10 |
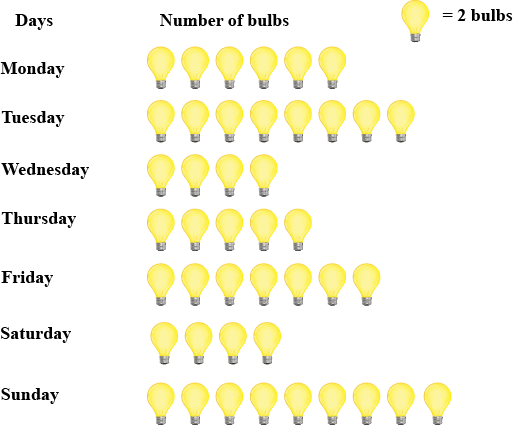
The sale of electric bulbs on different days of a week is shown below:
Observe the pictograph and answer the following questions:
On which day maximum number of bulbs were sold?

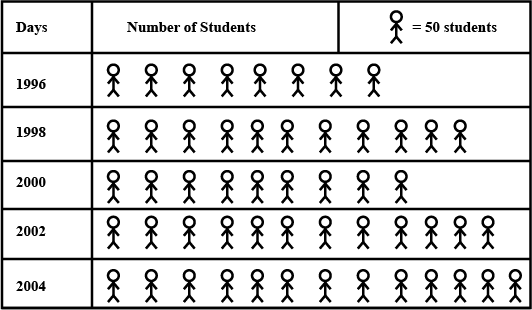
The total number of students in a school in different years is shown in the following table:
| Year | Number of students |
| 1996 | 400 |
| 1998 | 550 |
| 2000 | 450 |
| 2002 | 600 |
| 2004 | 650 |
We draw a pictograph using a complete symbol (icon of a student) to represent $$ 50$$ students.
The number of girl students in each class of co-ed. Middle school is depicted by the following pictograph:
Observe the above pictograph and answer the following questions:
How many girls are there in VII class?
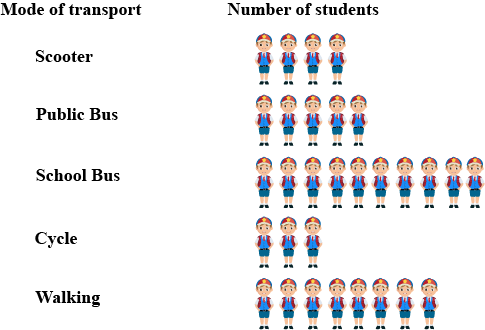
A survey was carried out in a certain school to find about different modes of transport used by students to travel to school each day. $$30$$ students of class VI were interviewed and the data obtained was displayed in the form of a pictograph.
Look at the above pictograph and answer the following questions:
Which is the most popular mode of travel?
The sale of electric bulbs on different days of a week is shown below:
Observe the pictograph and answer the following questions:
If one big carton can hold 9 bulbs. How many cartons were needed in the given week, more than 7, more than 8 or more than 9?

The following table shows the number of Maruti cars sold by five dealers in a particular month:
| Dealer | Saya | Bagga Links | D.D. Motors | Bhasin Motor | Competent Motors |
| Cars sold | 60 | 40 | 20 | 15 | 10 |
The sale of electric bulbs on different days of a week is shown.
Observe the pictograph and find out the total earning of the week, if each bulb sells for 10/- for each bulb?
A survey was carried out in a certain school to find about different modes of transport used by students to travel to school each day. 30 students of class VI were interviewed and the data obtained was displayed in the from of pictographs given below:
Look at the above pictograph and answer the following questions:
How many students are using cycle or walking as a mode of travel?

The number of girl students in each class of co-ed. Middle school is depicted by the following pictograph:
Observe the above pictograph and answer the following questions:
Which class has the maximum number of girl students?
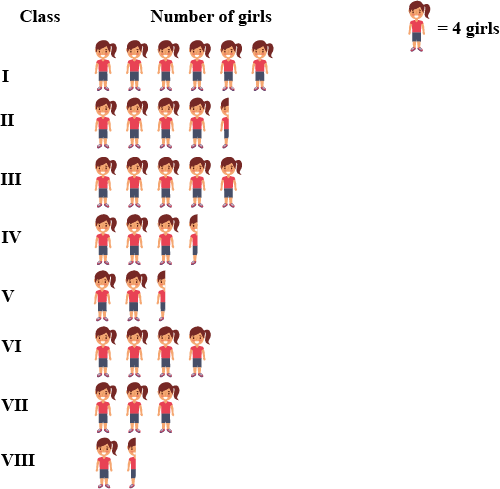
The number of girl students in each class of co-ed. Middle school is depicted by the following pictograph:
Observe the above pictograph and answer the following questions:
Is the number of girls in class VI is less than the number of girls in class V?

The total number of students of a school in different years is shown in the following table:
| Year | Number of students |
| 1996 | 400 |
| 1998 | 550 |
| 2000 | 450 |
| 2002 | 600 |
| 2004 | 650 |
How many symbols represent the total number of students for the year 1998?
We draw a pictograph using a complete symbol to represent $$100$$ students and an incomplete symbol to represent $$50$$ students.
To represent the number of students for the year $$1998$$, we use $$5$$ complete symbols and $$1$$ incomplete symbol

The pictograph shows different subject books which are kept in a library.
Which books are minimum in number?

In a village six fruit merchants sold the following number of fruit baskets in particular season:
Observe the above pictograph and answer the following questions.
How many fruit baskets ware sold by Anwar?

In a village six fruit merchants sold the following number of fruit baskets in particular season:
Observe the above pictograph and answer the following questions.
Which merchant sold the maximum number of baskets?
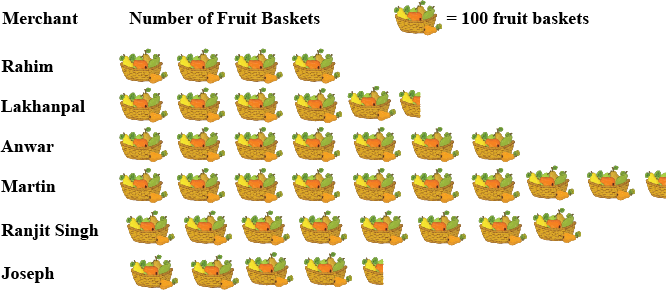
In a village six fruit merchants sold the following number of fruit baskets in particular season:
Observe the above pictograph and answer the following questions.
The merchants who have sold 600 or more number of baskets are planing to buy a godown for the next season. Can you name them?

The pictograph shows different subject books which are kept in a library.
How many English books are there in the library?
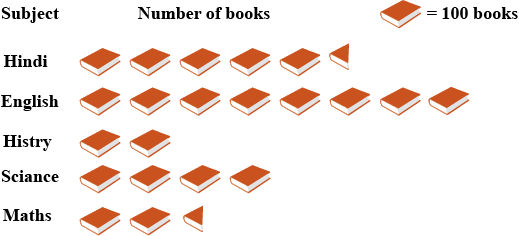
The pictograph shows different subject books which are kept in a library.
How many maths books are there?

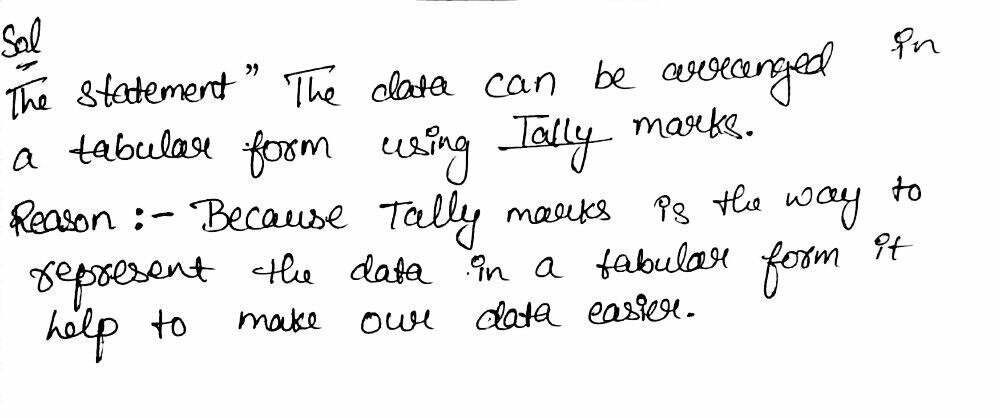
Fill in the blanks to make the
statements true:
The data can be arranged in a tabular form
using _______ marks.
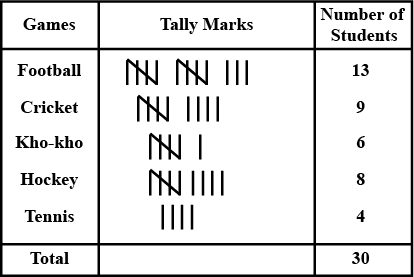
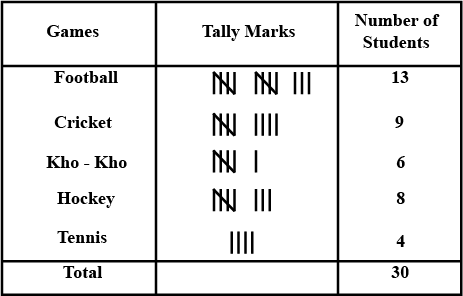
Following are the choices of games of $$40$$ students of
Class VI:
football, cricket, football, kho-kho, hockey, cricket,
hockey, kho-kho, tennis, tennis, cricket, football, football,
hockey, kho-kho, football, cricket, tennis, football, hockey,
kho-kho, football, cricket, cricket, football, hockey, khokho, tennis, football, hockey, cricket, football, hockey,
cricket, football, kho-kho, football, cricket, hockey,
football.
Which game is liked by most of the students?
Football game is liked by most of the students.
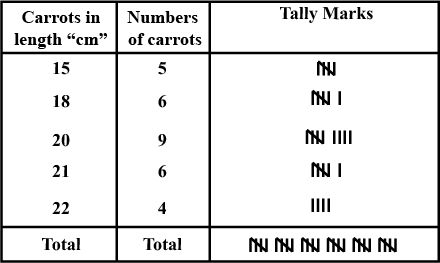
The lengths in centimeters (to the nearest centimeter) of $$30$$ carrots are given as follows:
$$15, 22, 21, 20, 22, 15, 15, 20, 20, 15, 20, 18,20, 22, 21,\\ 20, 21, 18, 21, 18, 20, 18, 21, 18, 22, 20, 15, 21, 18, 20$$
Arrange the data given above in a table using tally marks and answer the following questions.
What is the number of carrots which have a length of more than $$20$$ cm?
What is the number of carrots which have a length of more than $$20$$ cm?
From the table,
Number of carrots longer than $$20$$ cm $$=6+4=10$$.
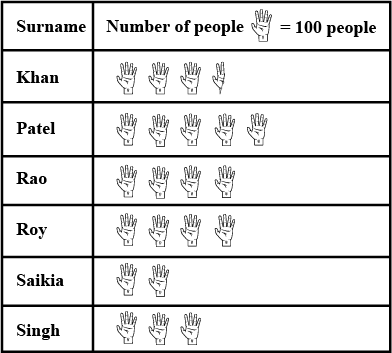
The following pictograph represents some surnames of people listed in the telephone directory of a city.Observe the pictograph and answer the following questions:
How many people have the surname ‘Roy’?

How many people have the surname ‘Roy’?
The number of two-wheelers owned individually
by each of $$50$$ families is listed below. Make a table
using tally marks.
$$1, 1, 2, 1, 1, 1, 2, 1, 2, 1, 0, 1, 1, 2, 3, 1, 2, 1, 1, 2, 1, 2, 3,1, 0,\\ 2, 1, 0, 2, 1, 2, 1, 2, 1, 1, 4, 1, 3, 1, 1, 2, 1, 1, 1, 1,2,3, 2, 1, 1$$
Find the number of families having two or more, two-wheelers.
Find the number of families having two or more, two-wheelers.
The table is formed as show.
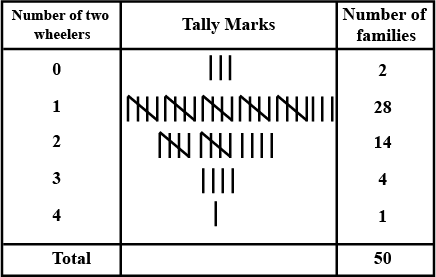
From the table,
Number of families two or more two-wheeles $$= 14+4+1=19$$
Following are the choices of games of $$40$$ students of
Class VI:
football, cricket, football, kho-kho, hockey, cricket,
hockey, kho-kho, tennis, tennis, cricket, football, football,
hockey, kho-kho, football, cricket, tennis, football, hockey,
kho-kho, football, cricket, cricket, football, hockey, khokho, tennis, football, hockey, cricket, football, hockey,
cricket, football, kho-kho, football, cricket, hockey,
football.
Which game is liked by a minimum number of
students?
Tennis game is liked by a minimum number of
students
students
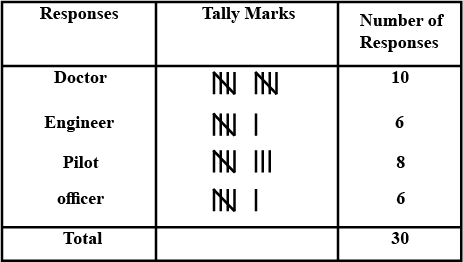
Thirty students were interviewed to find out what they want to be in the future. Their responses are listed below:
doctor, engineer, doctor, pilot, officer, doctor, engineer, doctor, pilot, officer, pilot, engineer, officer, pilot, doctor, engineer, pilot, officer, doctor, officer, doctor, pilot, engineer, doctor, pilot, officer, doctor, pilot, doctor, engineer
Arrange the data in a table using tally marks.
Fill in the blanks
A _______ represents data through pictures of
objects.
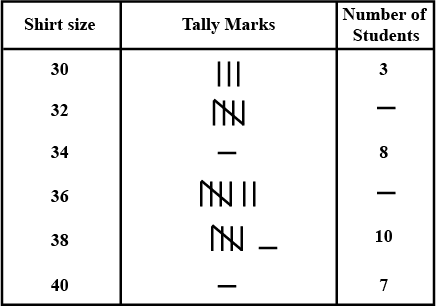
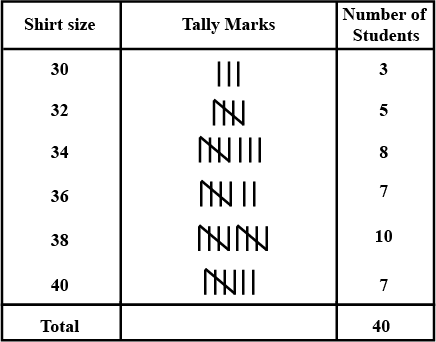
Fill in the blanks in the following table which
represents a shirt size of $$40$$ students of a school.
Students of Class VI in a school were given a task to count the number of articles made of different materials in the school. The information collected by them is represented as follows.
Observe the pictograph and answer the following questions:
Which material is used in exactly half the number of articles as those made up of metal?

The following pictograph represents some surnames of people listed in the telephone directory of a city.
Observe the pictograph and answer the following questions:
Which surname appears the maximum number of times in the telephone directory?
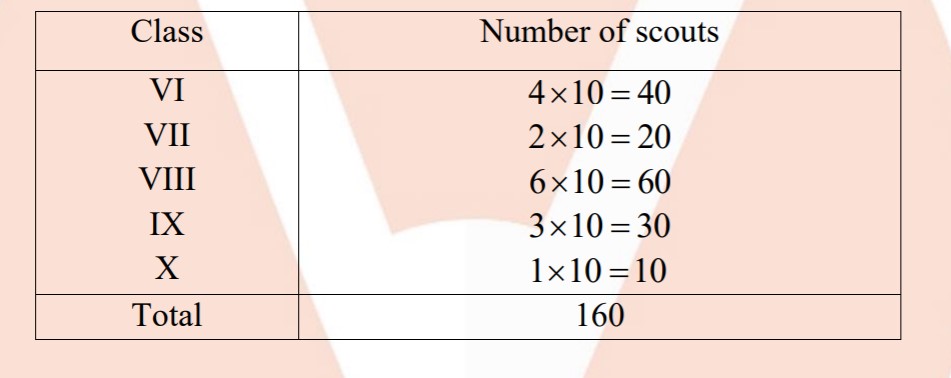
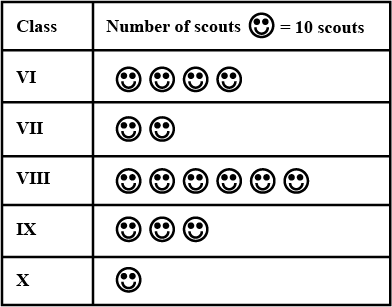
The number of scouts in a school is depicted by the following pictograph.
Observe the pictograph and answer the following questions:
Which class has the minimum number of scouts?

Data from the pictograph can be tabulated as shown.
From the table,
Class X has the minimum number of scouts.
The number of scouts in a school is depicted by the following pictograph.
Observe the pictograph and answer the following questions:
Which class has the maximum number of scouts?

The number of scouts in a school is depicted by the following pictograph.
Observe the pictograph and answer the following questions:
Which class has exactly four times the scouts as that of Class X?
Students of Class $$VI$$ in a school were given a task to count the number of articles made of different materials in the school. The information collected by them is represented as follows.
Observe the pictograph and answer the following questions:
Which material is used in the maximum number of articles?

The following pictograph represents some surnames of people listed in the telephone directory of a city.
Observe the pictograph and answer the following question:
Which two surnames appear an equal number of times?

Students of Class VI in a school were given a task to count the number of articles made of different materials in school. The information collected by them is represented as follows.
Observe the pictograph and answer the following questions:
Which material is used in a minimum number of articles?

The number of scouts in a school is depicted by the following pictograph.
Observe the pictograph and answer the following questions:
What is the total number of scouts in the Classes VI to X?

The number of scouts in a school is depicted by the following pictograph.
Observe the pictograph and answer the following questions:
How many scouts are there in Class VI?

The following pictograph depicts the information about the areas in sq-km (to nearest hundred) of some districts of Chhattisgarh State.
How many districts have an area more than $$5000$$ square kilometers?
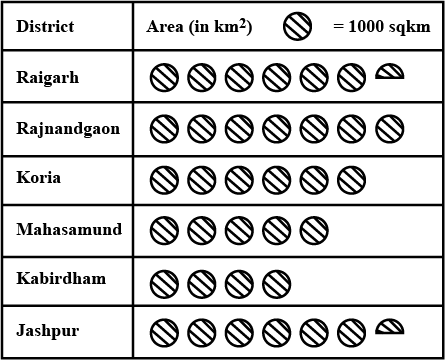
The following pictograph depicts the information about the areas in sq-km (to nearest hundred) of some districts of Chhattisgarh State:
What is the area of Koria district?

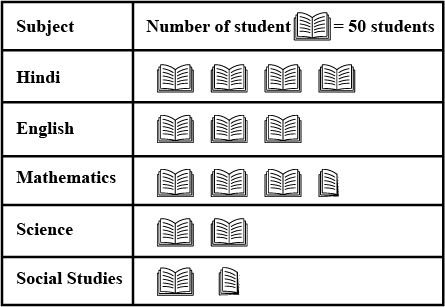
A survey was carried out in a certain school to find out the popular school subjects among students of Classes VI to VIII. The data in this regard is displayed as pictograph is given below.
Find the number of students who like subjects other than Mathematics and Science.

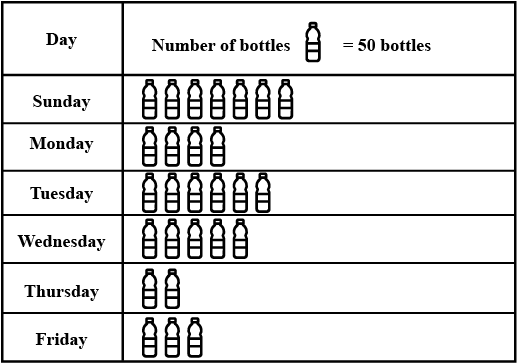
| Day | Sunday | Monday | Tuesday | Tuesday | Thursday | Friday |
| Number of bottles | 350 | 200 | 300 | 250 | 100 | 150 |
Prepare a pictograph of the data using one symbol to represent $$50$$ bottles.
Taking one symbol of bottle to represent $$50$$ bottles, the pictograph can be made as shown.
A survey was carried out in a certain school to find out the popular school subjects among students of Classes VI to VIII. The data in this regard is displayed as pictograph is given below.
Which subject is most popular among the students?
The following pictograph depicts the information about the areas in sq-km (to nearest hundred) of some districts of Chhattisgarh State:
Which two districts have the same area?

A survey was carried out in a certain school to find out the popular school subjects among students of Classes VI to VIII. The data in this regard is displayed as pictograph is given below.
Which subject is most popular among the students?

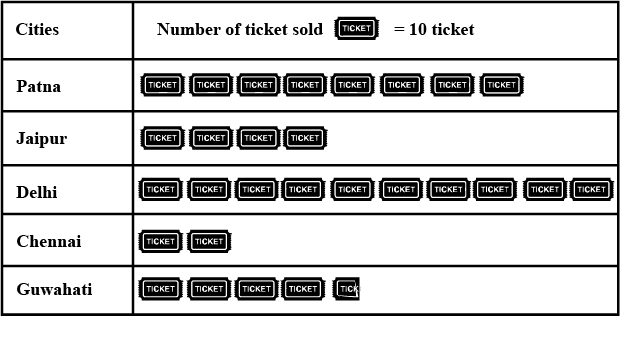
Prepare a pictograph of the information given in
graph.
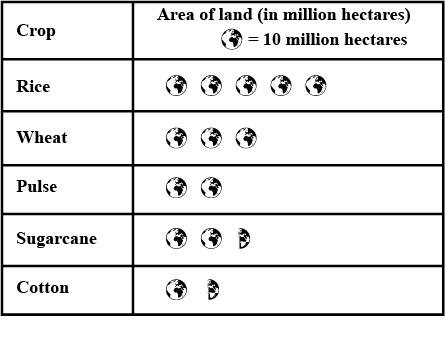
The following table shows the area of the land on which different crops were grown.
| Crop | Area of land (in million hectors) |
| Rice Wheat | $$50$$ $$30$$ |
| Pulses Sugarcane Cotton | $$20$$ $$25$$ $$15$$ |
Prepare a pictograph by choosing a suitable symbol to represent $$10$$ million hectares.
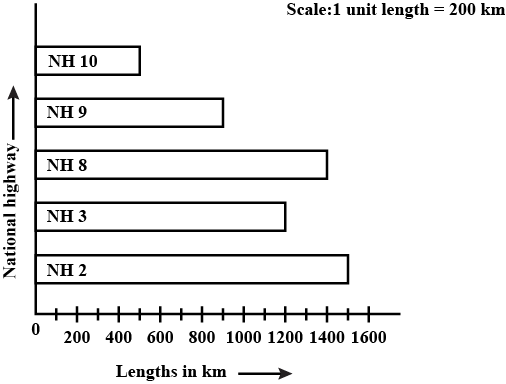
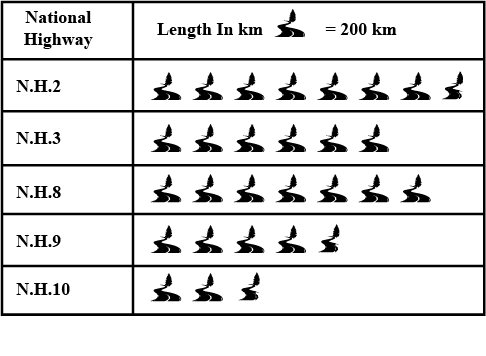
Prepare a pictograph of the data by taking a
suitable symbol to represent $$200$$ kilometers.
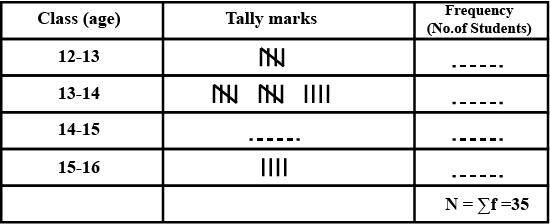
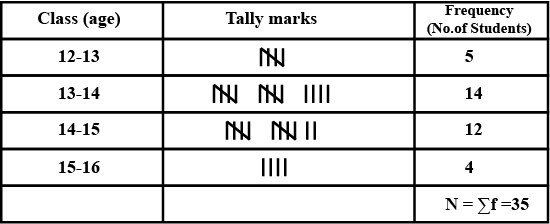
Complete the following table :
Find the total number of persons whose weights are given in the above table.
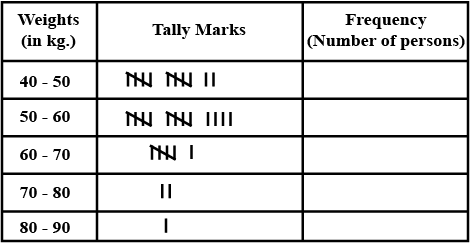
One line represents to count $$1$$ and one cross line over other four lines means it is set of $$5$$, So by counting these we can complete frequency table.
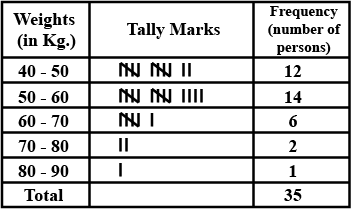
So, from table
Total persons $$ =35 $$
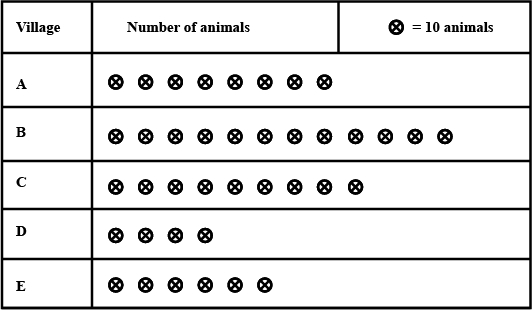
Total number of animals in five villages are as follows:
Villages A :80 Village B :120
Village C :90 Village D :40
Village E :60
Prepare a pictograph of these animals using one symbol to represent $$10$$ animals and answer the following question:
Which village has more animals : Village A or Village C ?
Village C(90) has more animal than Village A(80)

Total number of animals in five villages are as follows:
Villages A :80 Village B :120
Village C :90 Village D :40
Village E :60
Prepare a pictograph of these animals using one symbol to represent $$10$$ animals and answer the following question:
Which village has the maximum number of animals ?
Village B

Total number of animals in five villages are as follows:
Villages A :80 Village B :120
Village C :90 Village D :40
Village E :60
Prepare a pictograph of these animals using one symbol to represent $$10$$ animals and answer the following question:
How many symbols represent animals of village $$E$$ ?
$$6$$
The number of girl students in each class of a co-educational middle school is depicted by the pictograph.
Observe this pictograph and answer the following question:
Is the number of girls in VI less than the number of girls in Class V ?
Fill in the blanks:
In a pictograph, if one bicycle represents $$20$$ bicycles then $$140$$ bicycles can be represented by ................. bicycles.
Fill in the blanks:
The frequency of $$8$$ is written symbolically as ........ using tally marks.
The frequency of $$8$$ is written symbolically as (refer to figure) using tally marks.

Fill in the blanks:
In a pictograph, if one electric bulb represents $$10$$ bulbs then the picture of half a bulb will represent ....... bulbs.
Fill in the blanks:
A pictorial representation of a data is called a .........
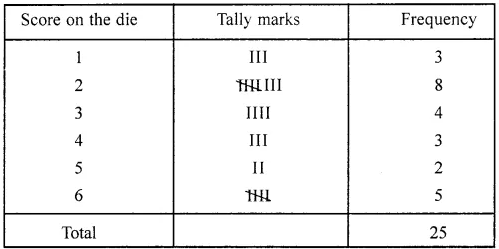
A die is thrown $$25$$ times and the scores were as given below:
$$2, 1, 4, 6, 2, 3, 1, 5, 6, 3, 4, 5, 2, 1, 6, 6, 6, 3, 2, 2, 2, 4, 3, 2, 2$$
Construct tally chart and frequency distribution table.
Tally chart and frequency distribution table.
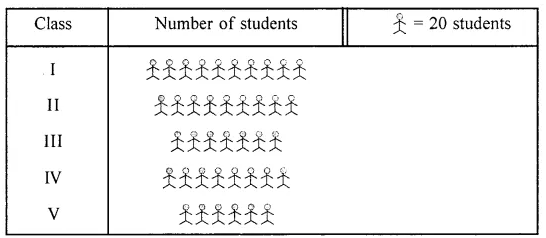
In primary school, the number of students in different classes are as follows:
| Class | I | II | III | IV | V |
| Number of students | 200 | 180 | 140 | 160 | 120 |

The pictograph for the given information is:
The following pictograph shows different subject books which are kept in a school library.
Taking symbol of one book $$=50$$ books, find:
how many Science books are there in the library?

The sale of electric bulbs on different days of a week is shown below:
Observe the pictograph and answer the following questions:
On Which of the days minimum number of bulbs were sold?
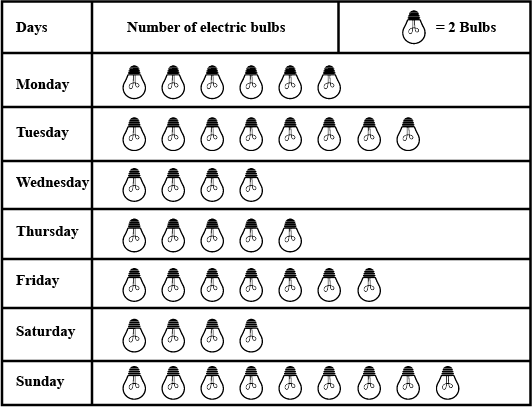
The sale of electric bulbs on different days of a week is shown below:
Observe the pictograph and answer the following questions:
On Which of the days, the same number of bulbs were sold?

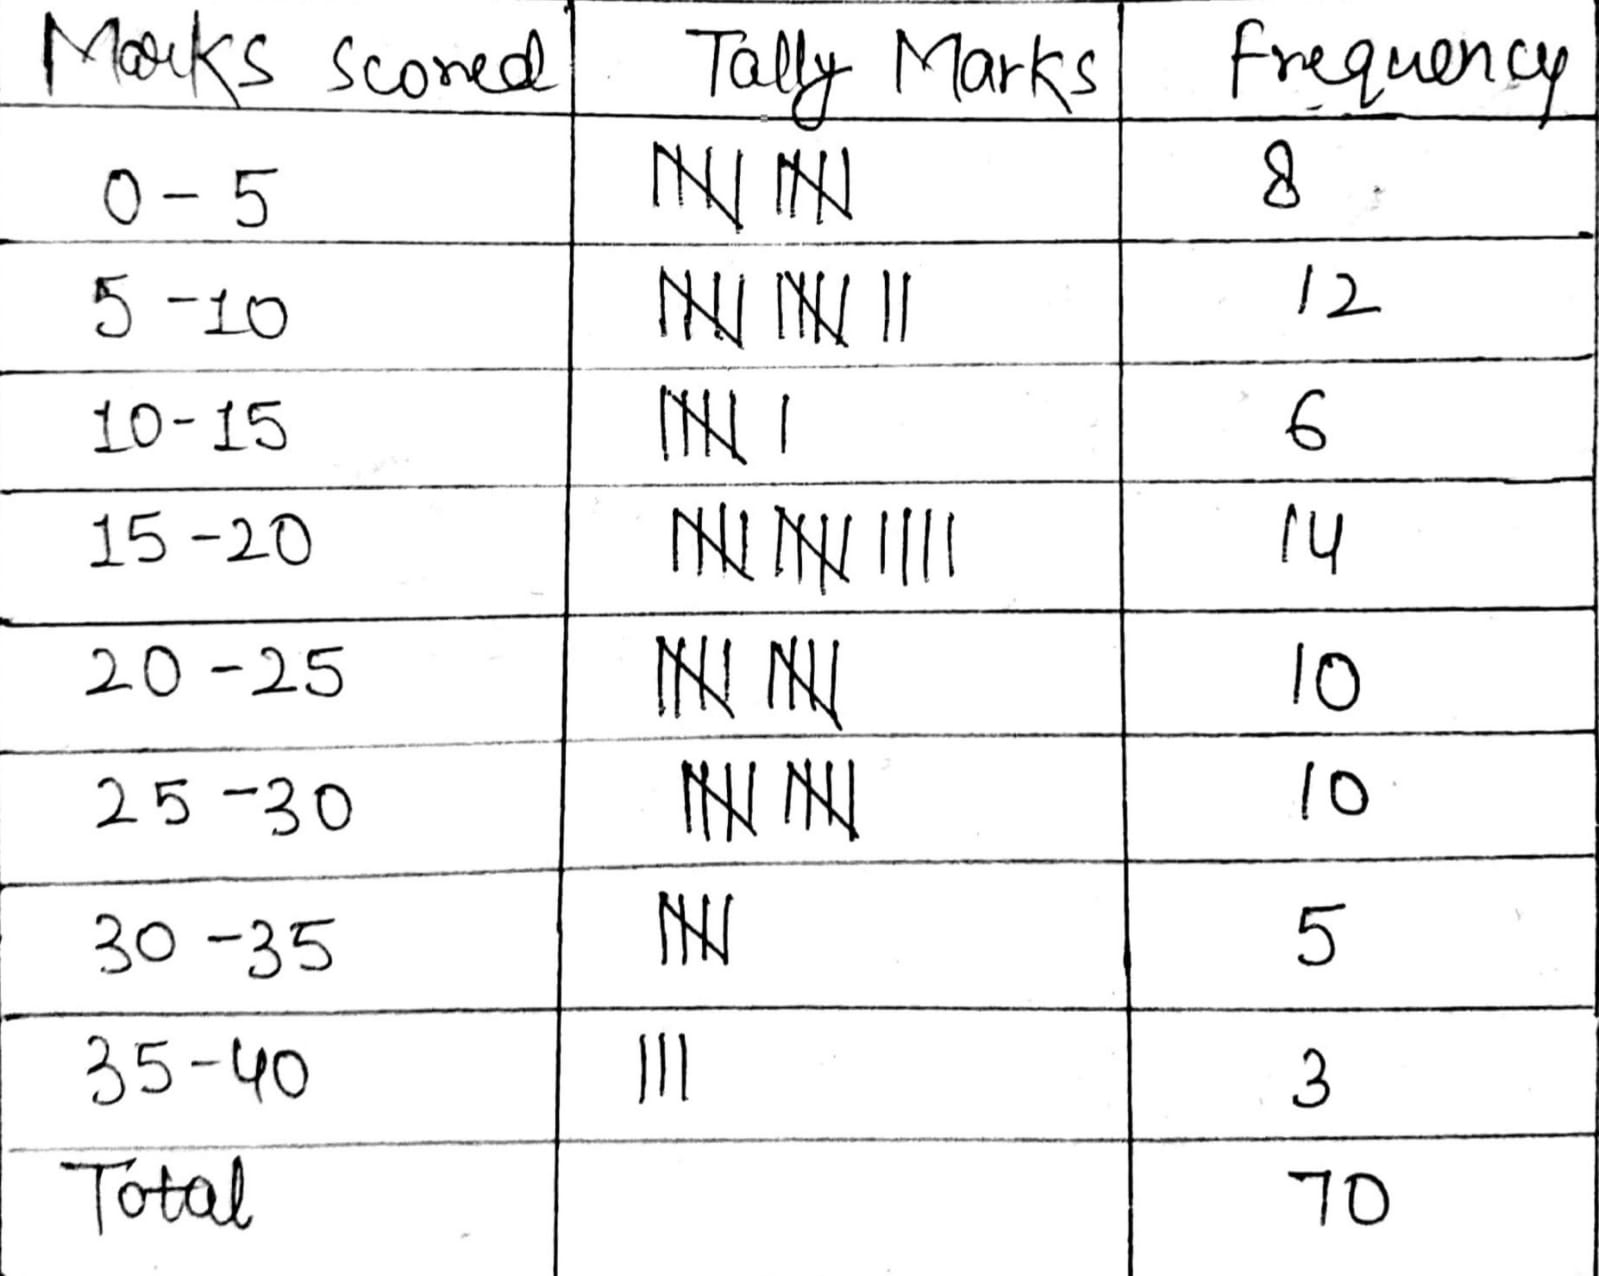
Prepare a tally marking chart for the marks scored by 70 students in an examination, by taking the class interval of 5.
| 28 | 17 | 15 | 22 | 29 | 21 | 23 | 27 | 18 | 12 | 7 | 2 | 9 | 4 | 1 | 8 | 3 | 10 |
| 5 | 20 | 15 | 12 | 8 | 4 | 33 | 27 | 21 | 15 | 3 | 36 | 27 | 21 | 15 | 3 | 37 | 16 |
| 28 | 9 | 2 | 4 | 6 | 32 | 31 | 29 | 18 | 14 | 13 | 15 | 11 | 9 | 7 | 1 | 5 | 37 |
| 32 | 23 | 24 | 20 | 19 | 25 | 19 | 25 | 15 | 19 | 25 | 19 | 20 | 6 | 9 | 30 |
Solution is as follows:
Following data shows the weekly wages (in ) of $$10$$ workers in a factory.$$3500, 4250, 4000, 4250, 4000, 3750, 4750, 4000, 4250$$ and $$4000$$.
How many workers are getting the maximum wages?
Complete the Following Table.
Fill in the blanks
An observation occurring seven times in a data is represented as _____ using tally marks.
The following are the details or the number of students in a class of 30 students present during a week.
| Day | Number of students present |
| Monday | 24 |
| Tuesday | 20 |
| Wednesday | 28 |
| Thursday | 30 |
| Friday | 26 |
| Saturday | 22 |
Given that
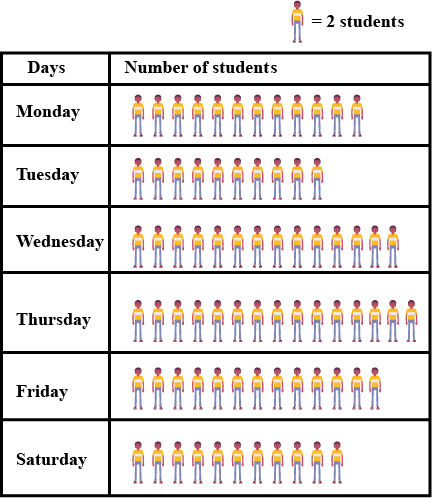
The details or the number of students in a class of 30 students present during a week
| Day | Number of students present |
| Monday | 24 |
| Tuesday | 20 |
| Wednesday | 28 |
| Thursday | 30 |
| Friday | 26 |
| Saturday | 22 |
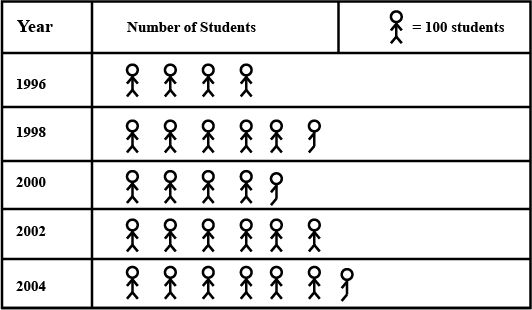
Total number of students of a school in different years is shown in the following table:
| Year | Number of students |
| 1996 | 400 |
| 1998 | 550 |
| 2000 | 450 |
| 2002 | 600 |
| 2004 | 650 |
Prepare a pictograph of students using one symbol an icon of a student to represent 100 students and answer the following question:
How many symbols represent total number of students in the year 2002?
From pictograph, we can observe that 6 symbols are required to represent total number of students in the year 2002.
The pictograph shows different subject books which are kept in a library.
Which books are maximum in number?
The following table shows the daily production of T.V. sets in the industry for $$7$$ days of a week:
| Day | Mon | Tue | Wed | Thurs | Fri | Sat | Sun |
| Number of T.V. Sets | $$300$$ | $$400$$ | $$150$$ | $$250$$ | $$100$$ | $$350$$ | $$200$$ |
Class 6 Maths Extra Questions
- Algebra Extra Questions
- Basic Geometrical Ideas Extra Questions
- Data Handling Extra Questions
- Decimals Extra Questions
- Fractions Extra Questions
- Integers Extra Questions
- Knowing Our Numbers Extra Questions
- Mensuration Extra Questions
- Playing With Numbers Extra Questions
- Practical Geometry Extra Questions
- Ratio And Proportion Extra Questions
- Symmetry Extra Questions
- Understanding Elementary Shapes Extra Questions
- Whole Numbers Extra Questions