Data Handling - Class 8 Maths - Extra Questions
Which of the following have equally likely outcomes?
Explain
Mr Sharma has one child. The child is either a boy or a girl.
A die is thrown. Write the sample space. If $$B$$ is the event of getting an even number, write the event $$B$$ using set notation.
A card is drawn from the pack of $$25$$ cards labelled with numbers $$1$$ to $$25$$. Write the sample space for this random experiment.
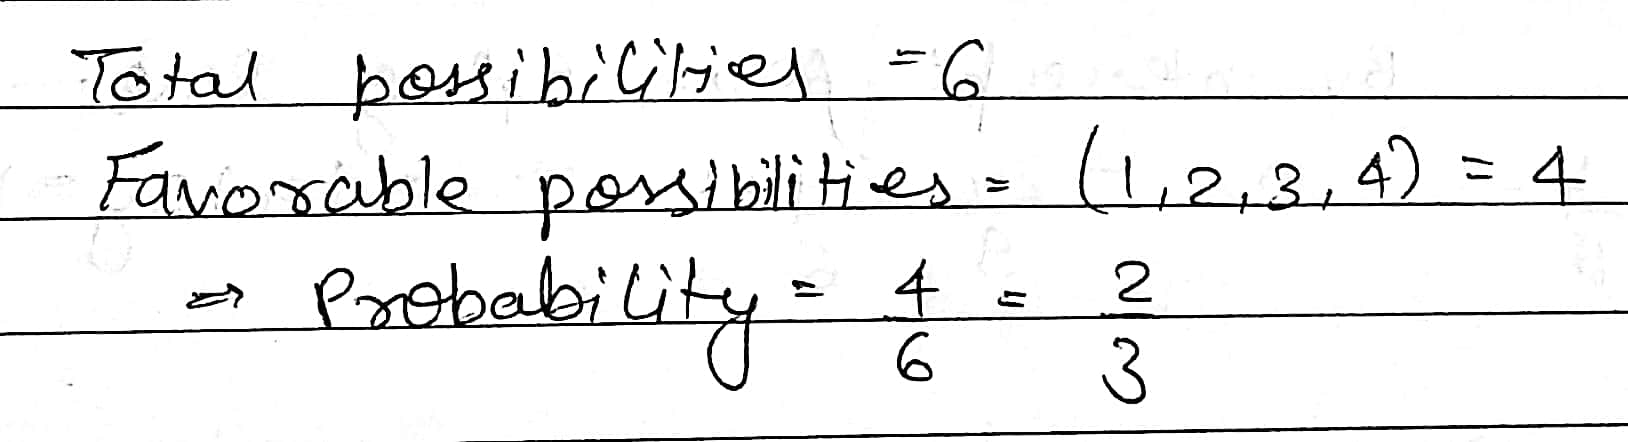
A die if thrown once. Find the probability of getting a number less than $$5$$.
Total possibilities $$=6$$
Favourable possibilities $$=(1, 2, 3, 4)=4$$
$$\Rightarrow$$ Probability $$=\dfrac{4}{6}=\dfrac{2}{3}$$.
When a die is thrown, list the number of outcomes of an event of getting a number greater than $$5$$.
Toss a coin for number of times as shown in the table. And record your findings in the table.
| Number of Tosses | Number of heads | Number of tails |
| 10 | ||
| 20 | ||
| 30 | ||
| 40 | ||
| 50 |
Why is tossing a coin considered to be a fair way of deciding which team should get the ball at the beginning of a football game?
Which of the following experiments have equally likely outcomes? Explain.
(i) A driver attempts to start a car. The car starts or does not start.
(ii) A player attempts to shoot a basketball. She/he shoots or misses the shot.
(iii) A trial is made to answer a true-false question. The answer is right or wrong.
(iv) A baby is born. It is a boy or a girl
A die is thrown. If $$A$$ is an event of getting an odd number, then write the sample space and event $$A$$ in set notation.
There are $$30$$ tickets numbered from $$1$$ to $$30$$ in a box and a ticket is drawn at random. If $$A$$ is the event that the number on the ticket is a perfect square, then write the sample space $$S$$, $$n(S)$$, the event $$A$$ and $$n(A)$$.
A die is thrown. Write the sample space. If $$P$$ is the event of getting an odd number, then write the event $$P$$ using set notation.
A die is thrown. If $$A$$ is the event that the number on upper face is less than $$5$$, then write sample space and event $$A$$ in set notation.
A die is thrown. Write the sample space. If $$A$$ is the event that the number is a perfect square, write the event $$A$$ using set notation.
There are $$30$$ tickets in a box numbered from $$1$$ to $$30$$. A ticket is drawn out at random. Let $$A$$ be the event that the number on the ticket is a multiple of $$6$$. Write the sample set $$S$$ and outcomes of event $$A$$ in set form.
A die is thrown. If $$A$$ is the event that the number on upper face is an even, then write sample space and event $$A$$ in set notation.
A die is thrown. If $$A$$ is the event that the number on upper face is a prime, then write sample space and event $$A$$ in set notation.
There are $$30$$ tickets numbered from $$1$$ to $$30$$ in a box. A ticket is drawn at random. If $$A$$ is the event that the number on the ticket is a prime number less than $$15$$, write the sample space $$S$$, $$n(S)$$ the event $$A$$ and $$n(A)$$.
A die is thrown. Write the sample space. If $$A$$ is the event that the number is less than four, write the event $$A$$ using set notation.
There are $$30$$ tickets numbered from $$1$$ to $$30$$ in a box. A ticket is drawn at random from the box and if $$A$$ is the event that the number on the ticket is a multiple of five, write the sample space $$S$$, $$n(S)$$, the event $$A$$ and $$n(A)$$.
Two coins are tossed simultaneously. Write the sample space $$'S'$$ and the number of sample point $$n(S)$$. $$A$$ is the event of getting no head. Write the event $$A$$ in set notation and find $$n(A)$$.
Two coins are tossed simultaneously. Write the sample space $$S$$ and the number of sample point $$n(S)$$. $$A$$ is the event of getting at least one head. Write the event $$A$$ in set notation and find $$n(A)$$
A die is thrown then write the sample $$S$$ and number of sample points $$n(S)$$ and also write event $$A$$ of getting a perfect square on the upper face write $$n(A)$$
Form $$2$$ digit number using $$0, 1, 2, 3, 4, 5$$ without repeating the digits. Write the sample space $$S$$, number of sample points $$n(S), U, n(U)$$ for $$U$$ is the event that the number so formed is divisible by $$5$$.
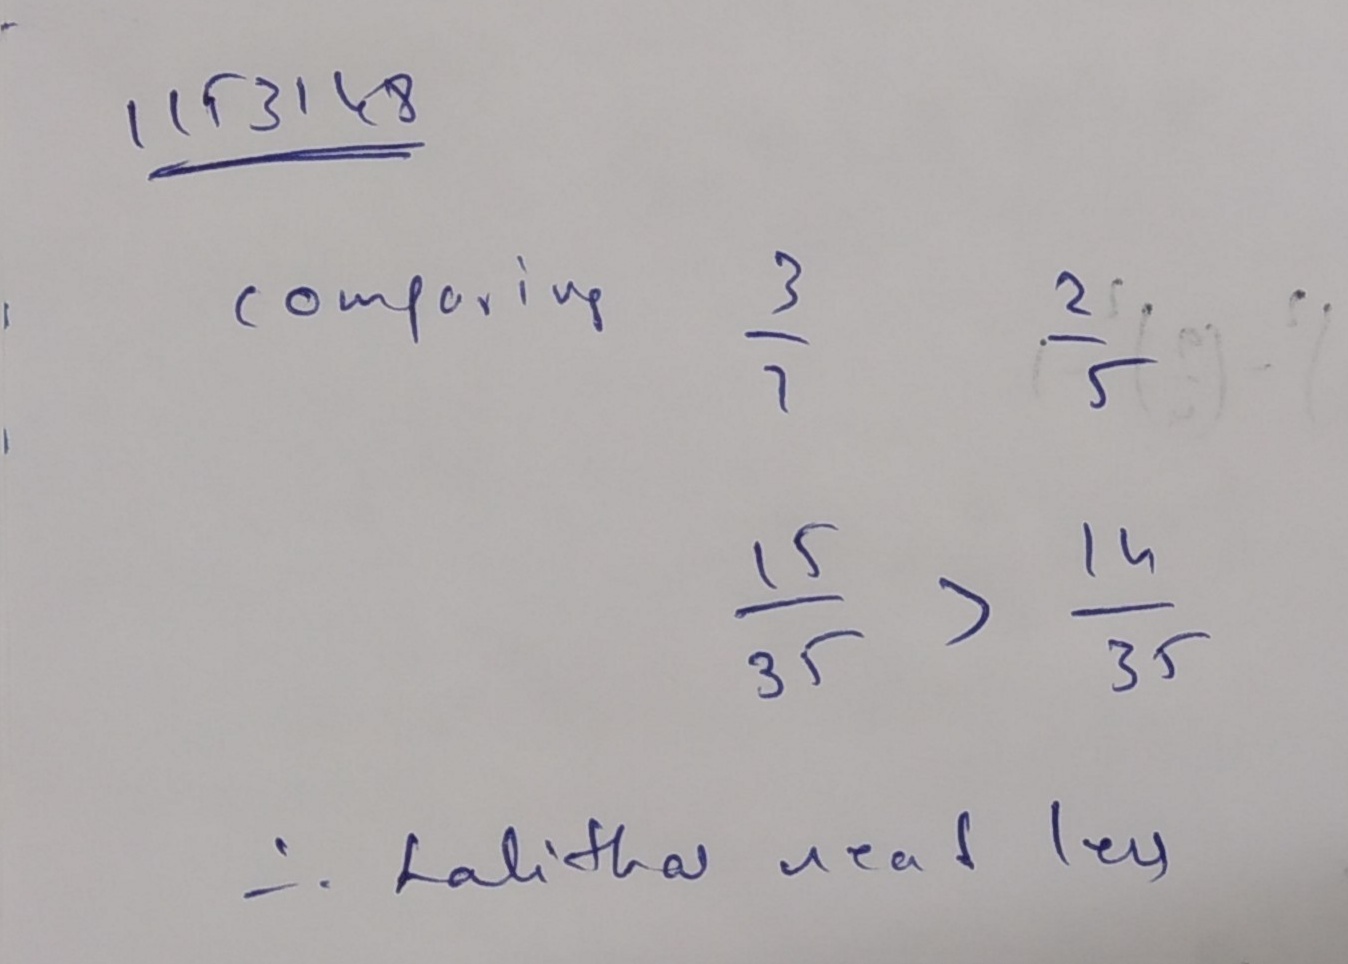
I read $$\dfrac{3}{7}$$ pages of a book containing 100 pages. Lalita read $$\dfrac{2}{5}$$of the same book. who read less ?
Comparing
$$\dfrac {3}{7}\,\,\,\,\,\,\,\,\,\,\,\,\, \dfrac {2}{5}$$
$$\dfrac {15}{35} > \dfrac {14}{35}$$
$$\therefore $$ Lalita read less
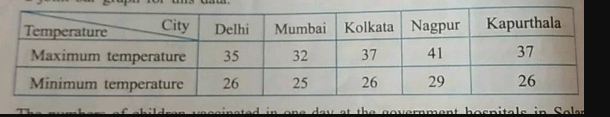
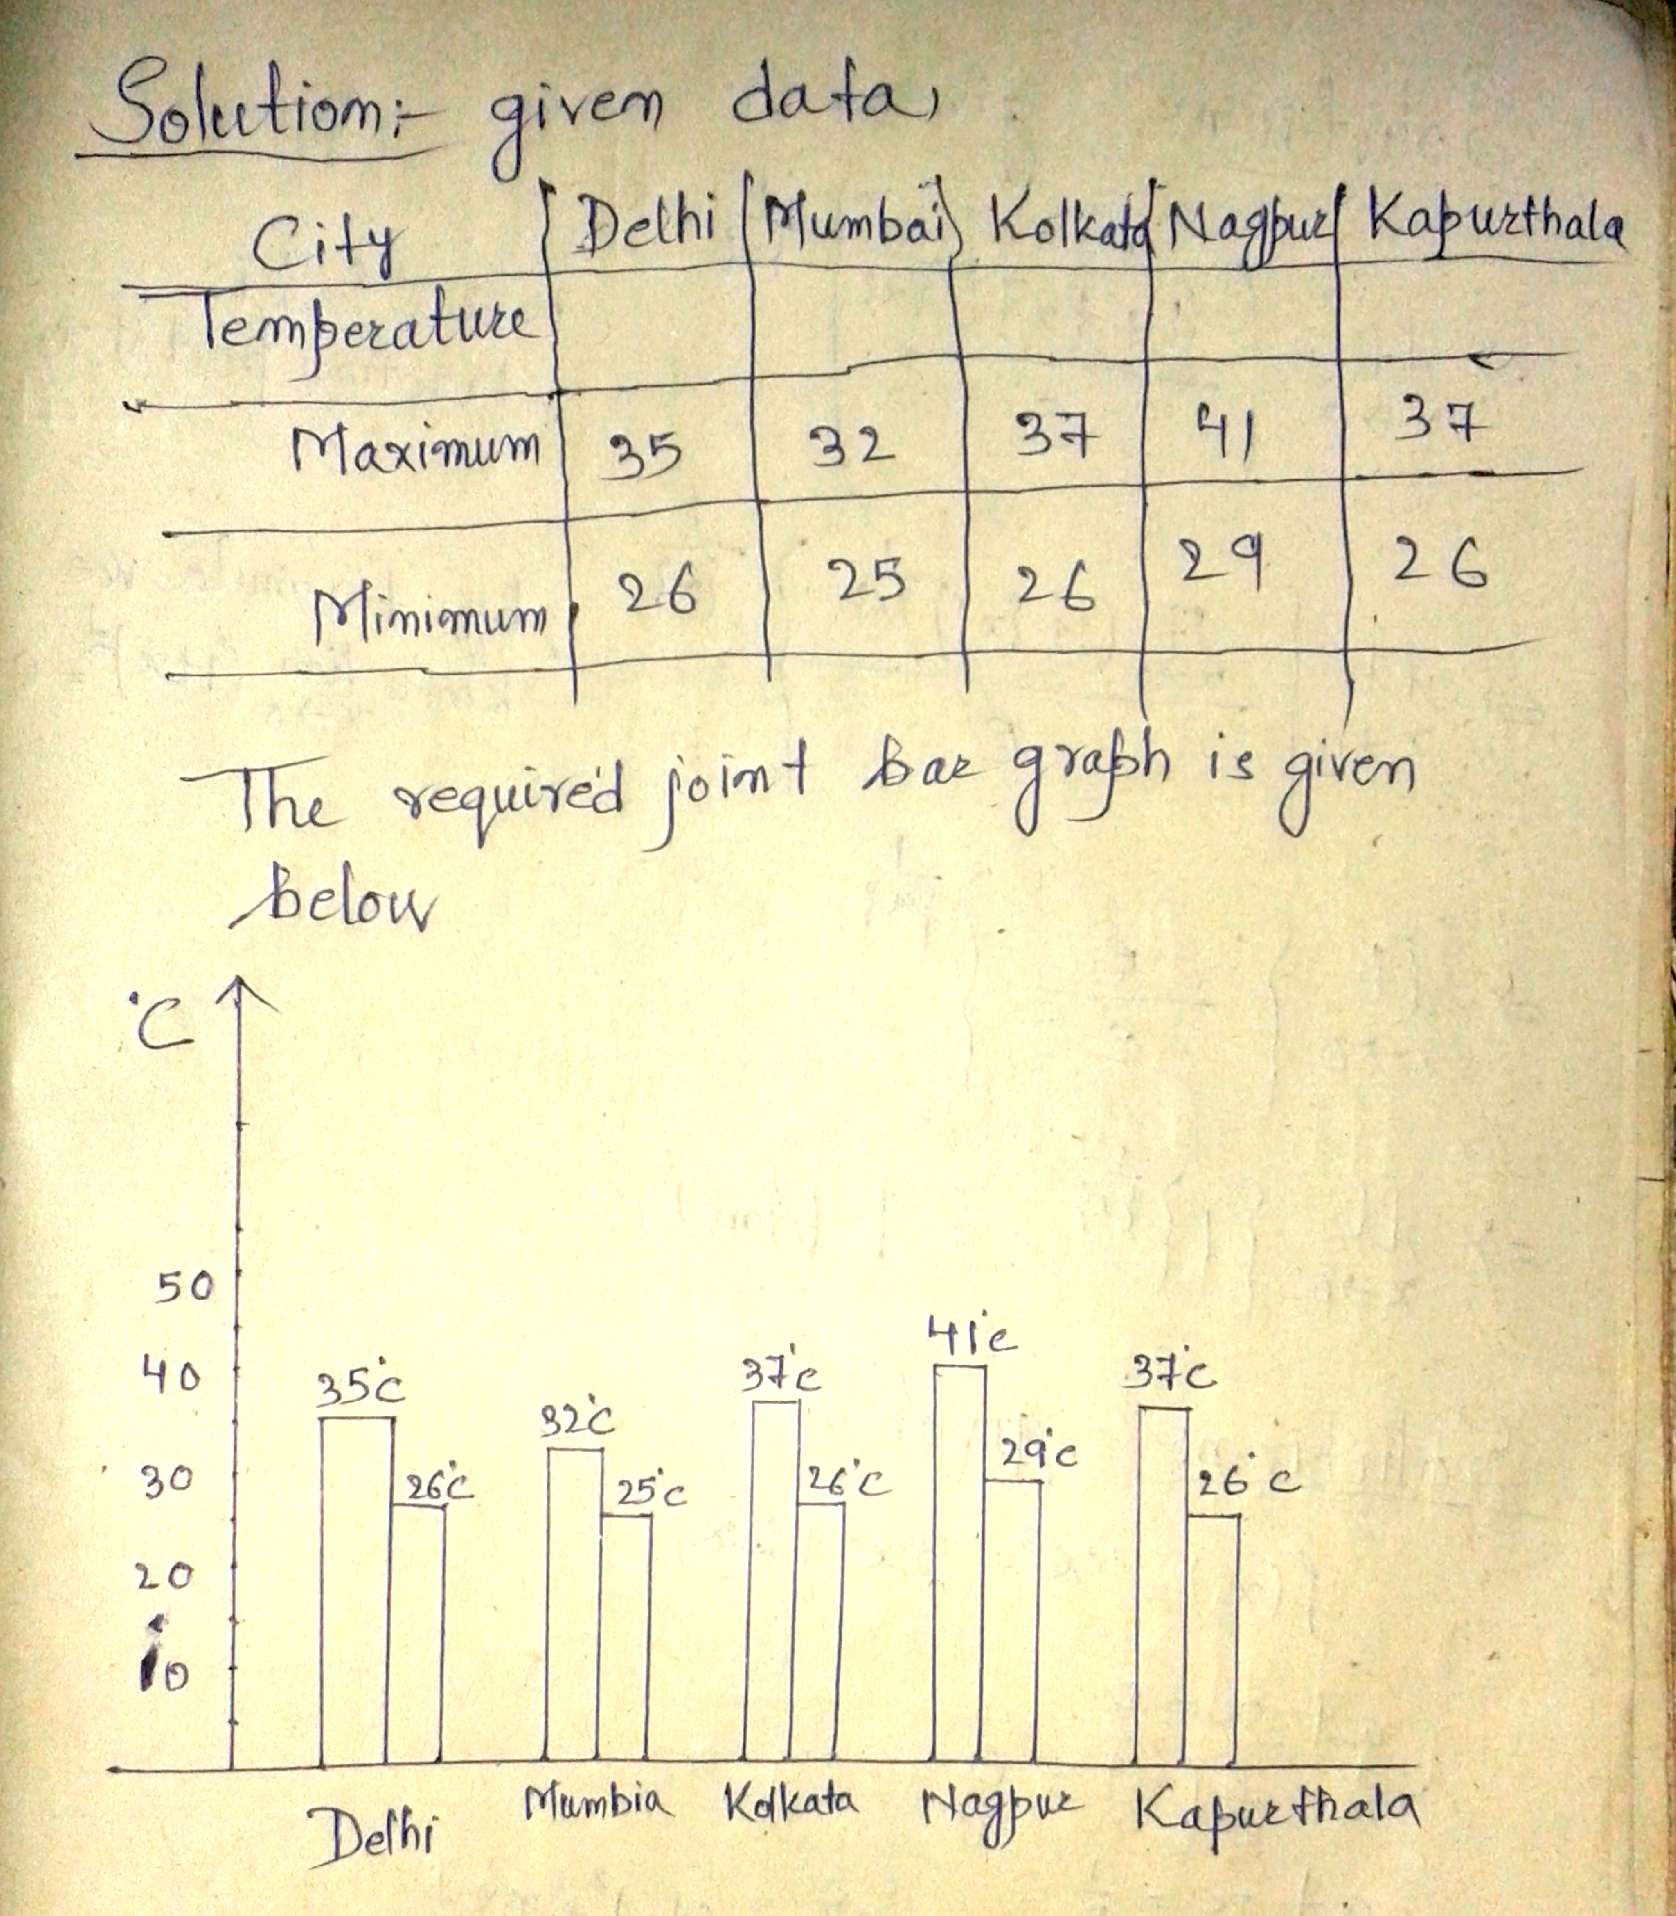
The maximum and minimum temperatures of five Indian cities are given in $$C^\circ.$$ Draw a joint bar graph for this data.
$$2$$ $$5$$ $$6$$ $$8$$ $$2$$ $$6$$ $$3$$ $$9$$
For the numbers in the list, write down
(a) the range
(b) the mode
(c) the median
Write all the possible outcomes for the occurrence of a number 4 when a fair die is tossed.
Three coins are tossed once. Find the probability of getting exactly two tails?
When a dice is thrown, outcomes $$ 1, 2,3,4,5, 6 $$ are equally ______
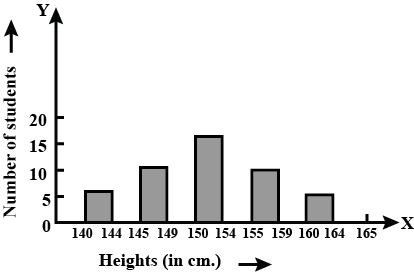
The bar graph as shown in above figure represents the heights (in cm) of 50 students of Class XI of a particular school. Study the graph and answer the following questions:
How many students are in the range of shortest height of the class?
An experiment whose outcomes cannot be predicted exactly in advance is called a_______ experiment.
Each outcome or a collection of outcomes in an experiment makes an _______
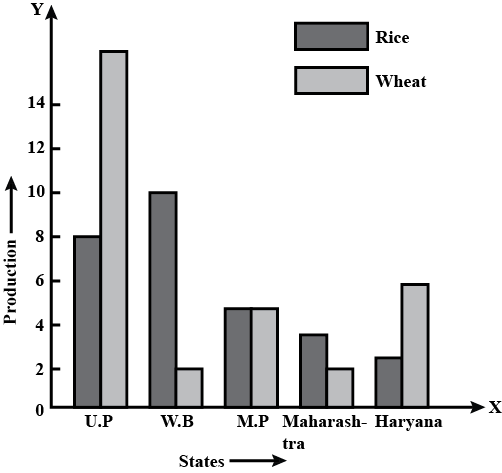
Read the above bar graph and answer the following question:
Which state has the total production of wheat and rice minimum?
When a dice is rolled, the six possible outcomes are______.
In a simultaneous throw of a pair of dice, find the probability of getting a total more than $$7$$.
In a throw of coin, find the probability of getting a head.
An unbiassed coins are tossed. Find the probability of getting at most one head.
An unbiassed die is toossed. Find the probability that it is a multiple of $$3 $$.
Two coins are tossed simultabeously. Find the probability of getting:
(i) at least one Tail
(ii) atmost two Head
(iii) one Head
Total outcomes when two coins are tossed $$= HH, HT, TH, TT$$
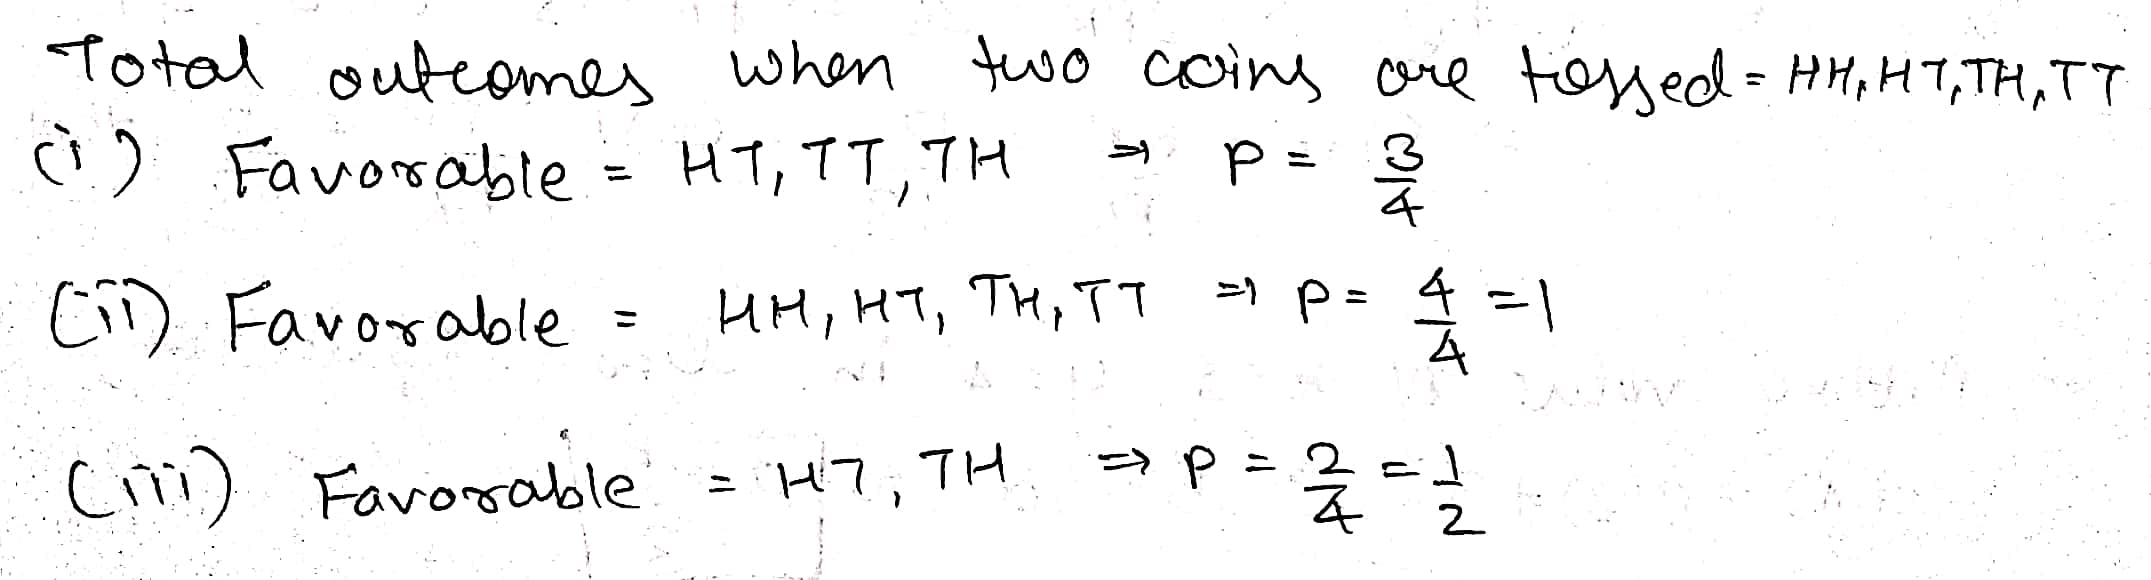
(i) Favorable $$= HT, TT, TH \Rightarrow P = \dfrac{3}{4}$$
(ii) Favorable $$=HH, HT, TH, TT \Rightarrow P = \dfrac{4}{4} = 1$$
(iii) Favorable $$= HT, TH \Rightarrow P = \dfrac{2}{4} = \dfrac{1}{2}$$
In a cricket match, a batswoman hits a boundary $$6$$ times out of $$30$$ balls she plays. Find the probability that she did not hit a boundary.
If a coin is tossed 3 times, then the number of outcomes will be?
Two-digit numbers are formed using the digits $$0, 1, 2, 3, 4, 5$$ where digits are not repeated.
$$\text{P}$$ is the event that the number so formed is even.
$$\text{Q}$$ is the event that the number so formed is greater than $$50$$.
$$\text{R}$$ is the event that the number so formed is divisible by $$3$$.
Then write the sample space $$\text{S}$$ and events $$\text{P, Q,} $$ and $$ \text{R}$$ using set notation.
Suppose that the letter cards for the word $$MATHEMATICS$$ were put face down and mixed up and a card is picked up at random. What is the probability of picking up a vowel?
From a group of $$2$$ men and $$3$$ women, two persons are selected. Describe the sample space of the experiment. If $$E$$ is the event in which one man and one woman are selected, then which are the cases favourable to $$E$$ ?
There are $$5$$ cards in a box with numbers $$1\ to 5$$ written on them. If $$2\ cards$$ are picked out from the box, write all the possible outcomes and find the probpossible ability of getting both even numbers.
Three different coins are tossed together find the probability of .
i) Exactly two heads ii) At least one tails
ii) Almost two heads iv) At most two tails
v) At least two tails vi) At most one head
vii) At least one head
What is the probability of obtaining total outcome in the multiple of $$12$$ if two die is tossed together once.
A die has six faces numbered from $$1$$ to $$6$$. It is rolled and number on the top face is noted. When this is treated as random trial.
(a) What are the possible outcomes?
(b) Are they equally likely? Why?
(c) Find the probability of a composite number turning up on the top face.
Roll a die ten times and record the outcomes in the form of table.
In a two child family, one child is a boy. What is the probability that the other child is a girl?
A bag contains $$4$$ identical red balls and $$3$$ identical black balls. The experiment consists of drawing one ball, then putting it into the bag and again drawing a ball. What are the possible outcomes of the experiment?
The population of Delhi State in different census years is as given below:
| Census year | 1961 | 1971 | 1981 | 1991 | 2001 |
| Population in Lakhs | 30 | 55 | 70 | 110 | 150 |
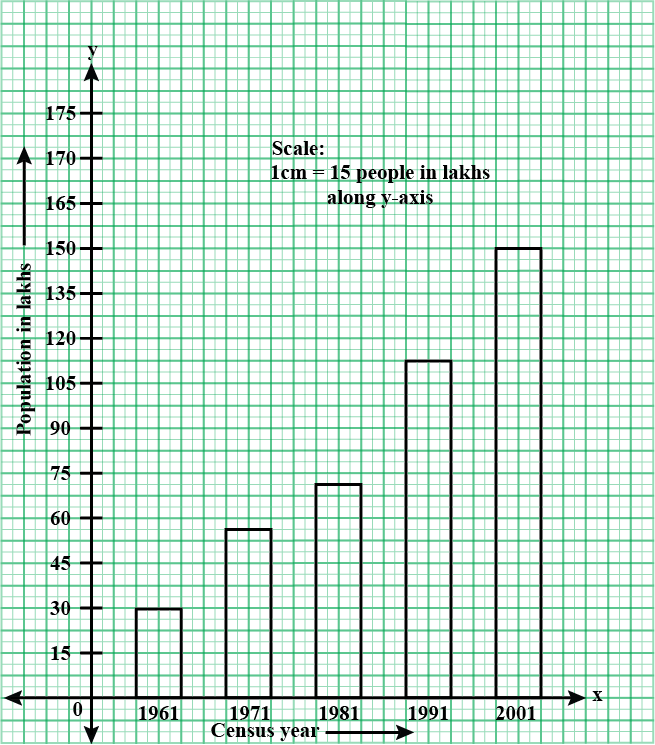
Read the following bar graph and answer the following questions:
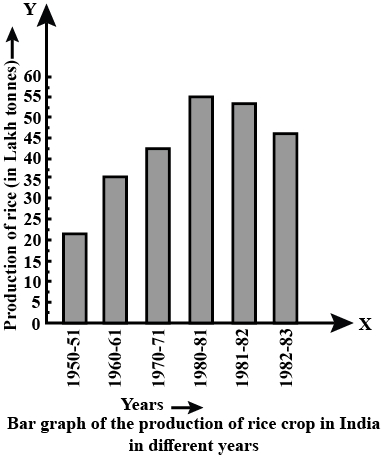
What is the information given by the bar graph?
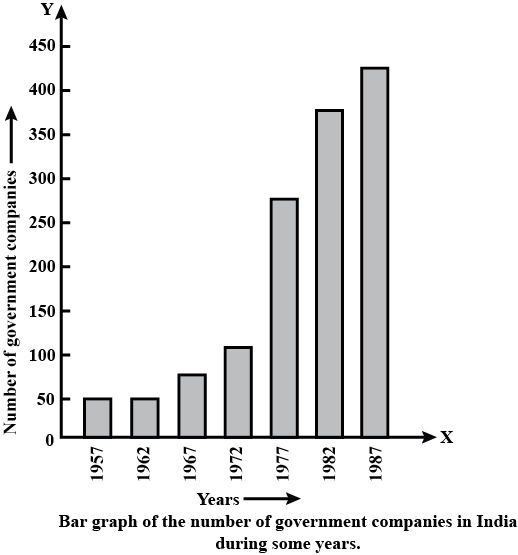
Read the following bar graph and answer the following questions : What information is given by the bar graph ?
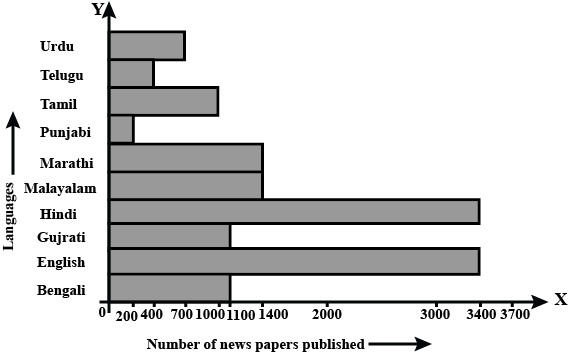
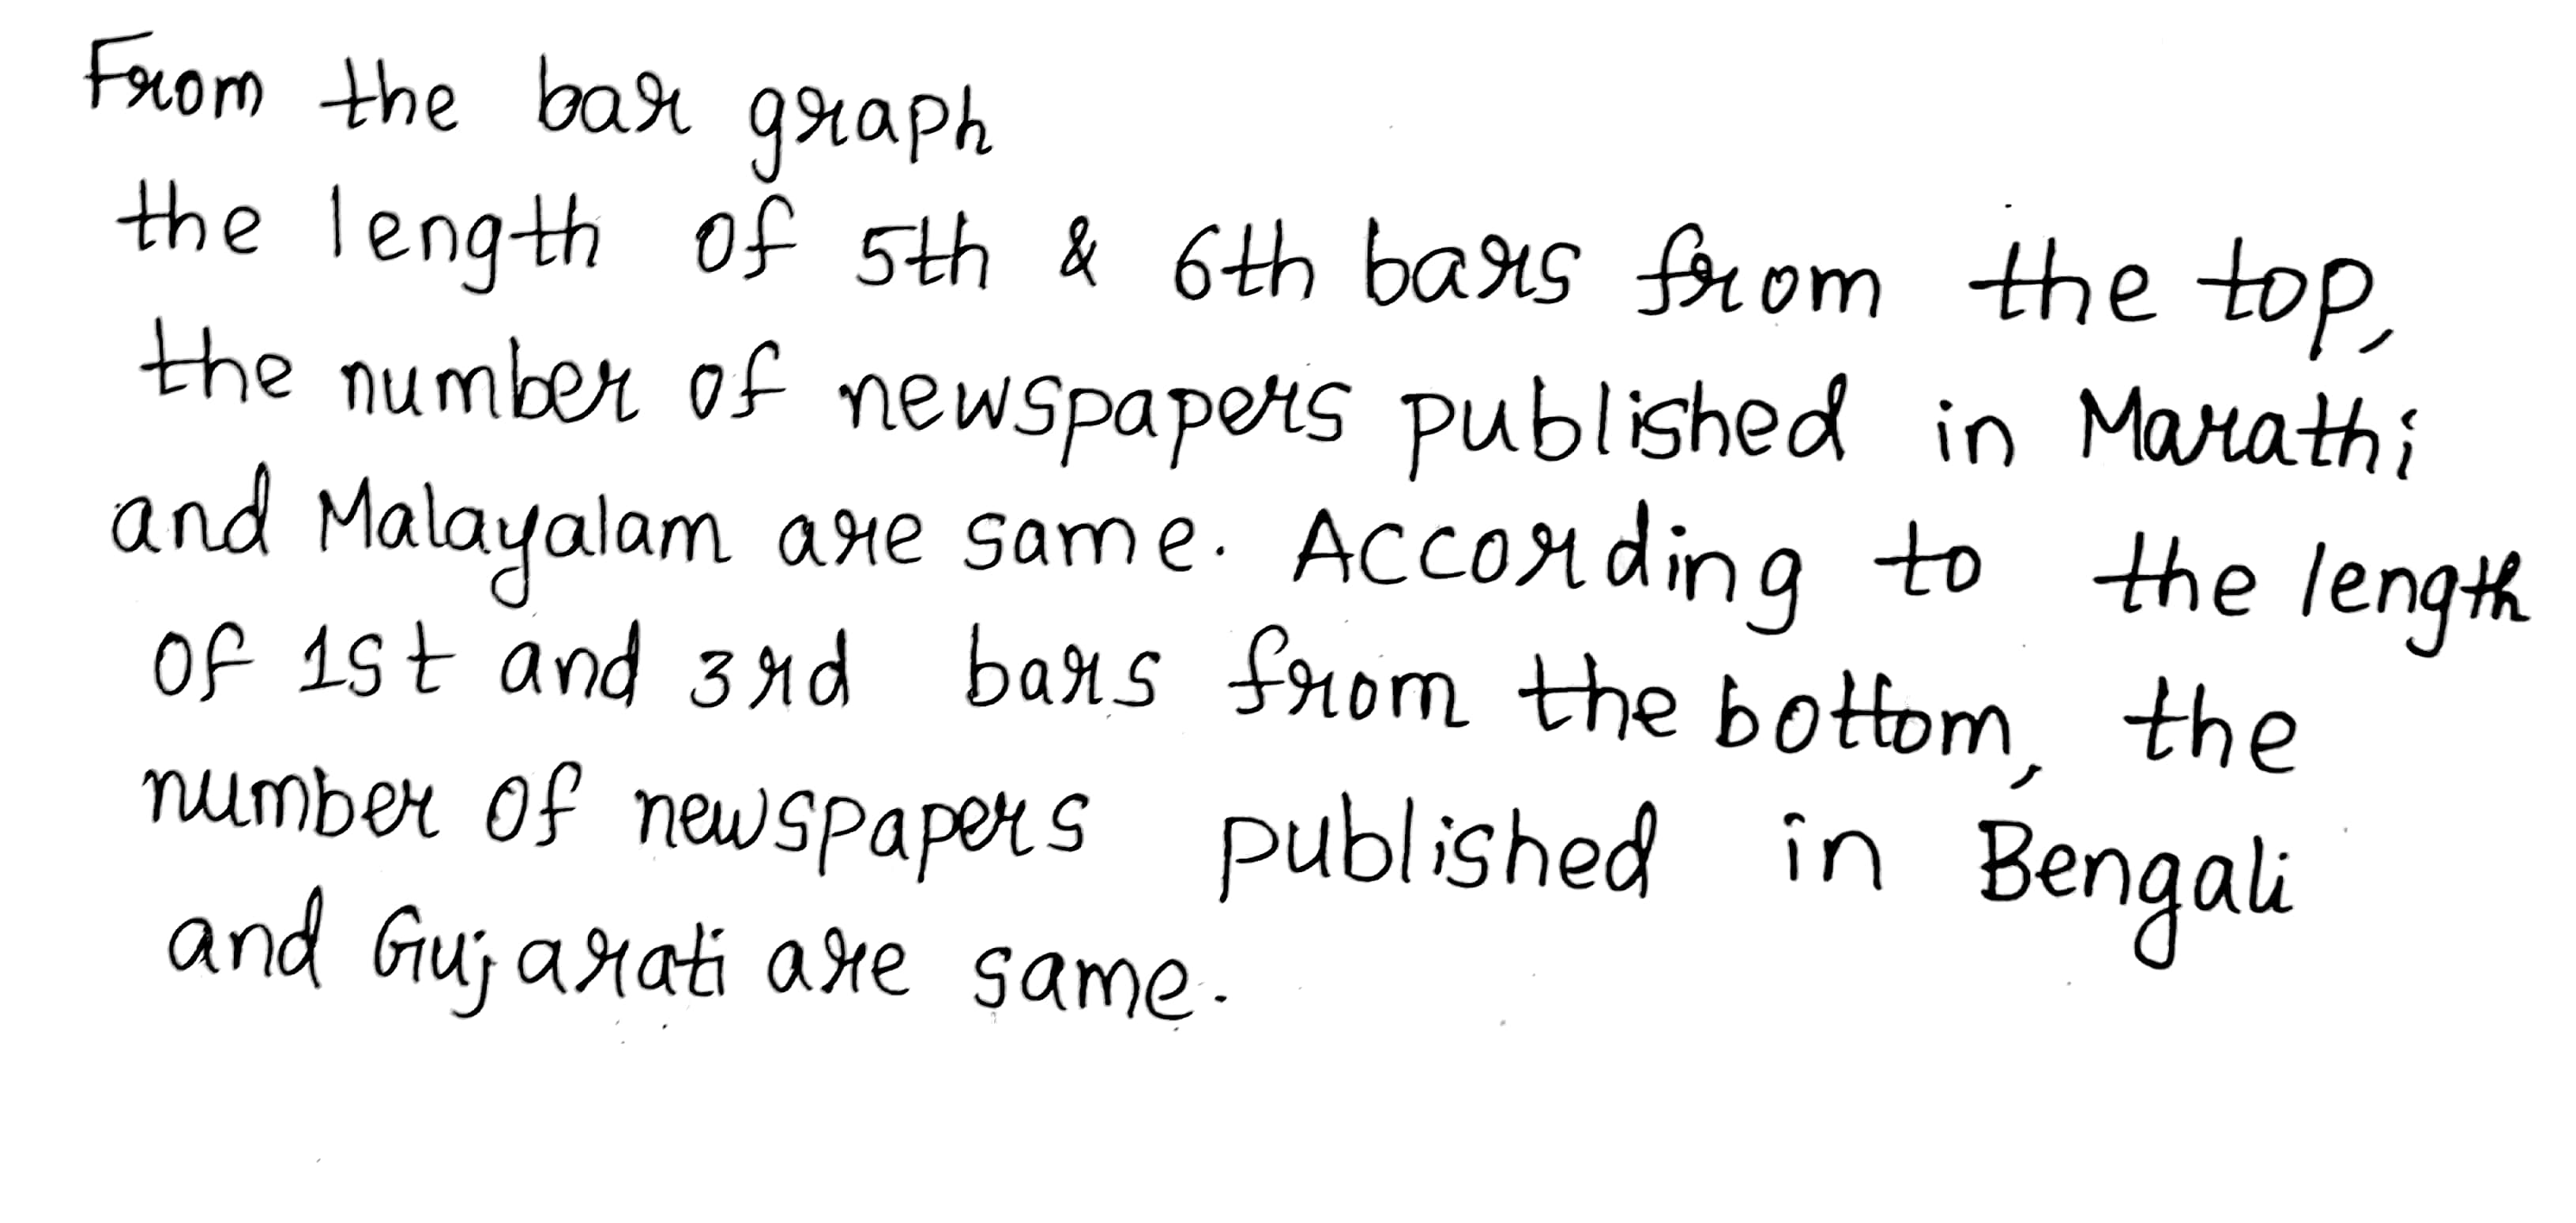
The bar graph shown in above figure represents the circulation of newspapers in 10 languages.
study the bar graph and answer the following question:
State the language in which the smallest number of newspapers are published.
Read the following bar graph (Fig. 23.15) and answer the following questions:
What is the minimum and maximum productions of cement and corresponding years?

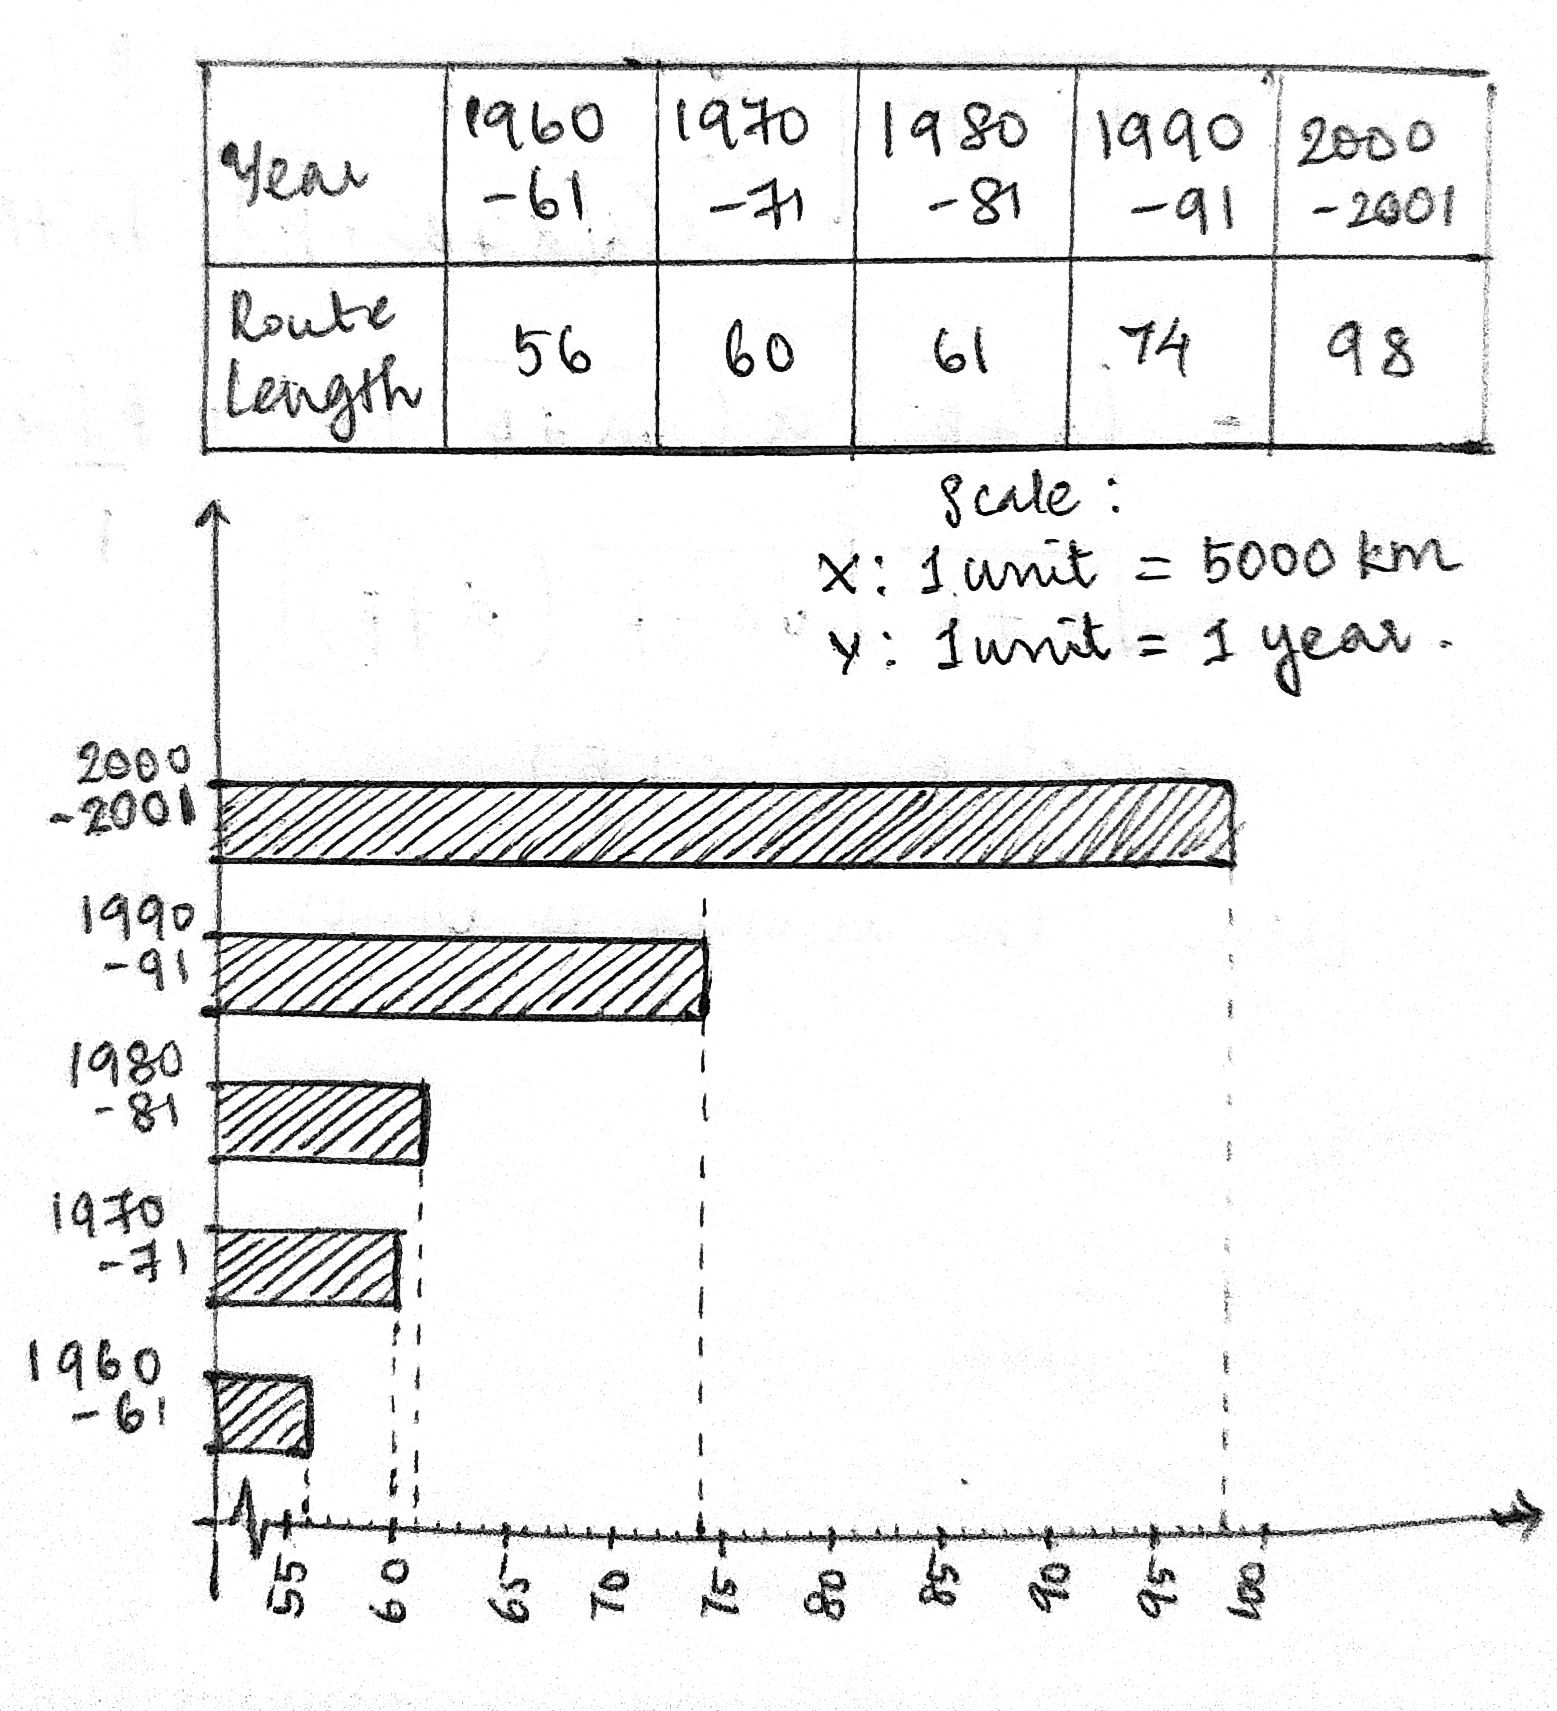
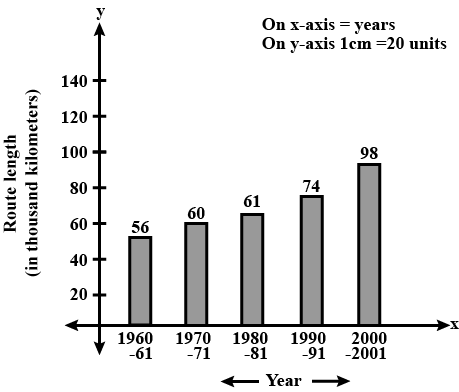
The following table gives the route length (in thousand kilometers) of the Indian Railway in some of the years :
| Year | 1960 - 61 | 1970 - 71 | 1980 - 81 | 1990 - 91 | 2000 - 2001 |
| Route length (in thousand km ) | 56 | 60 | 61 | 74 | 98 |
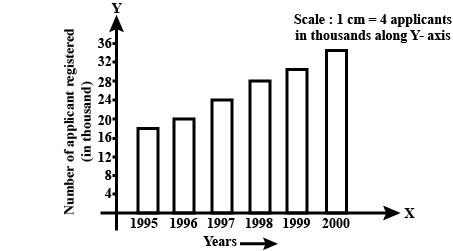
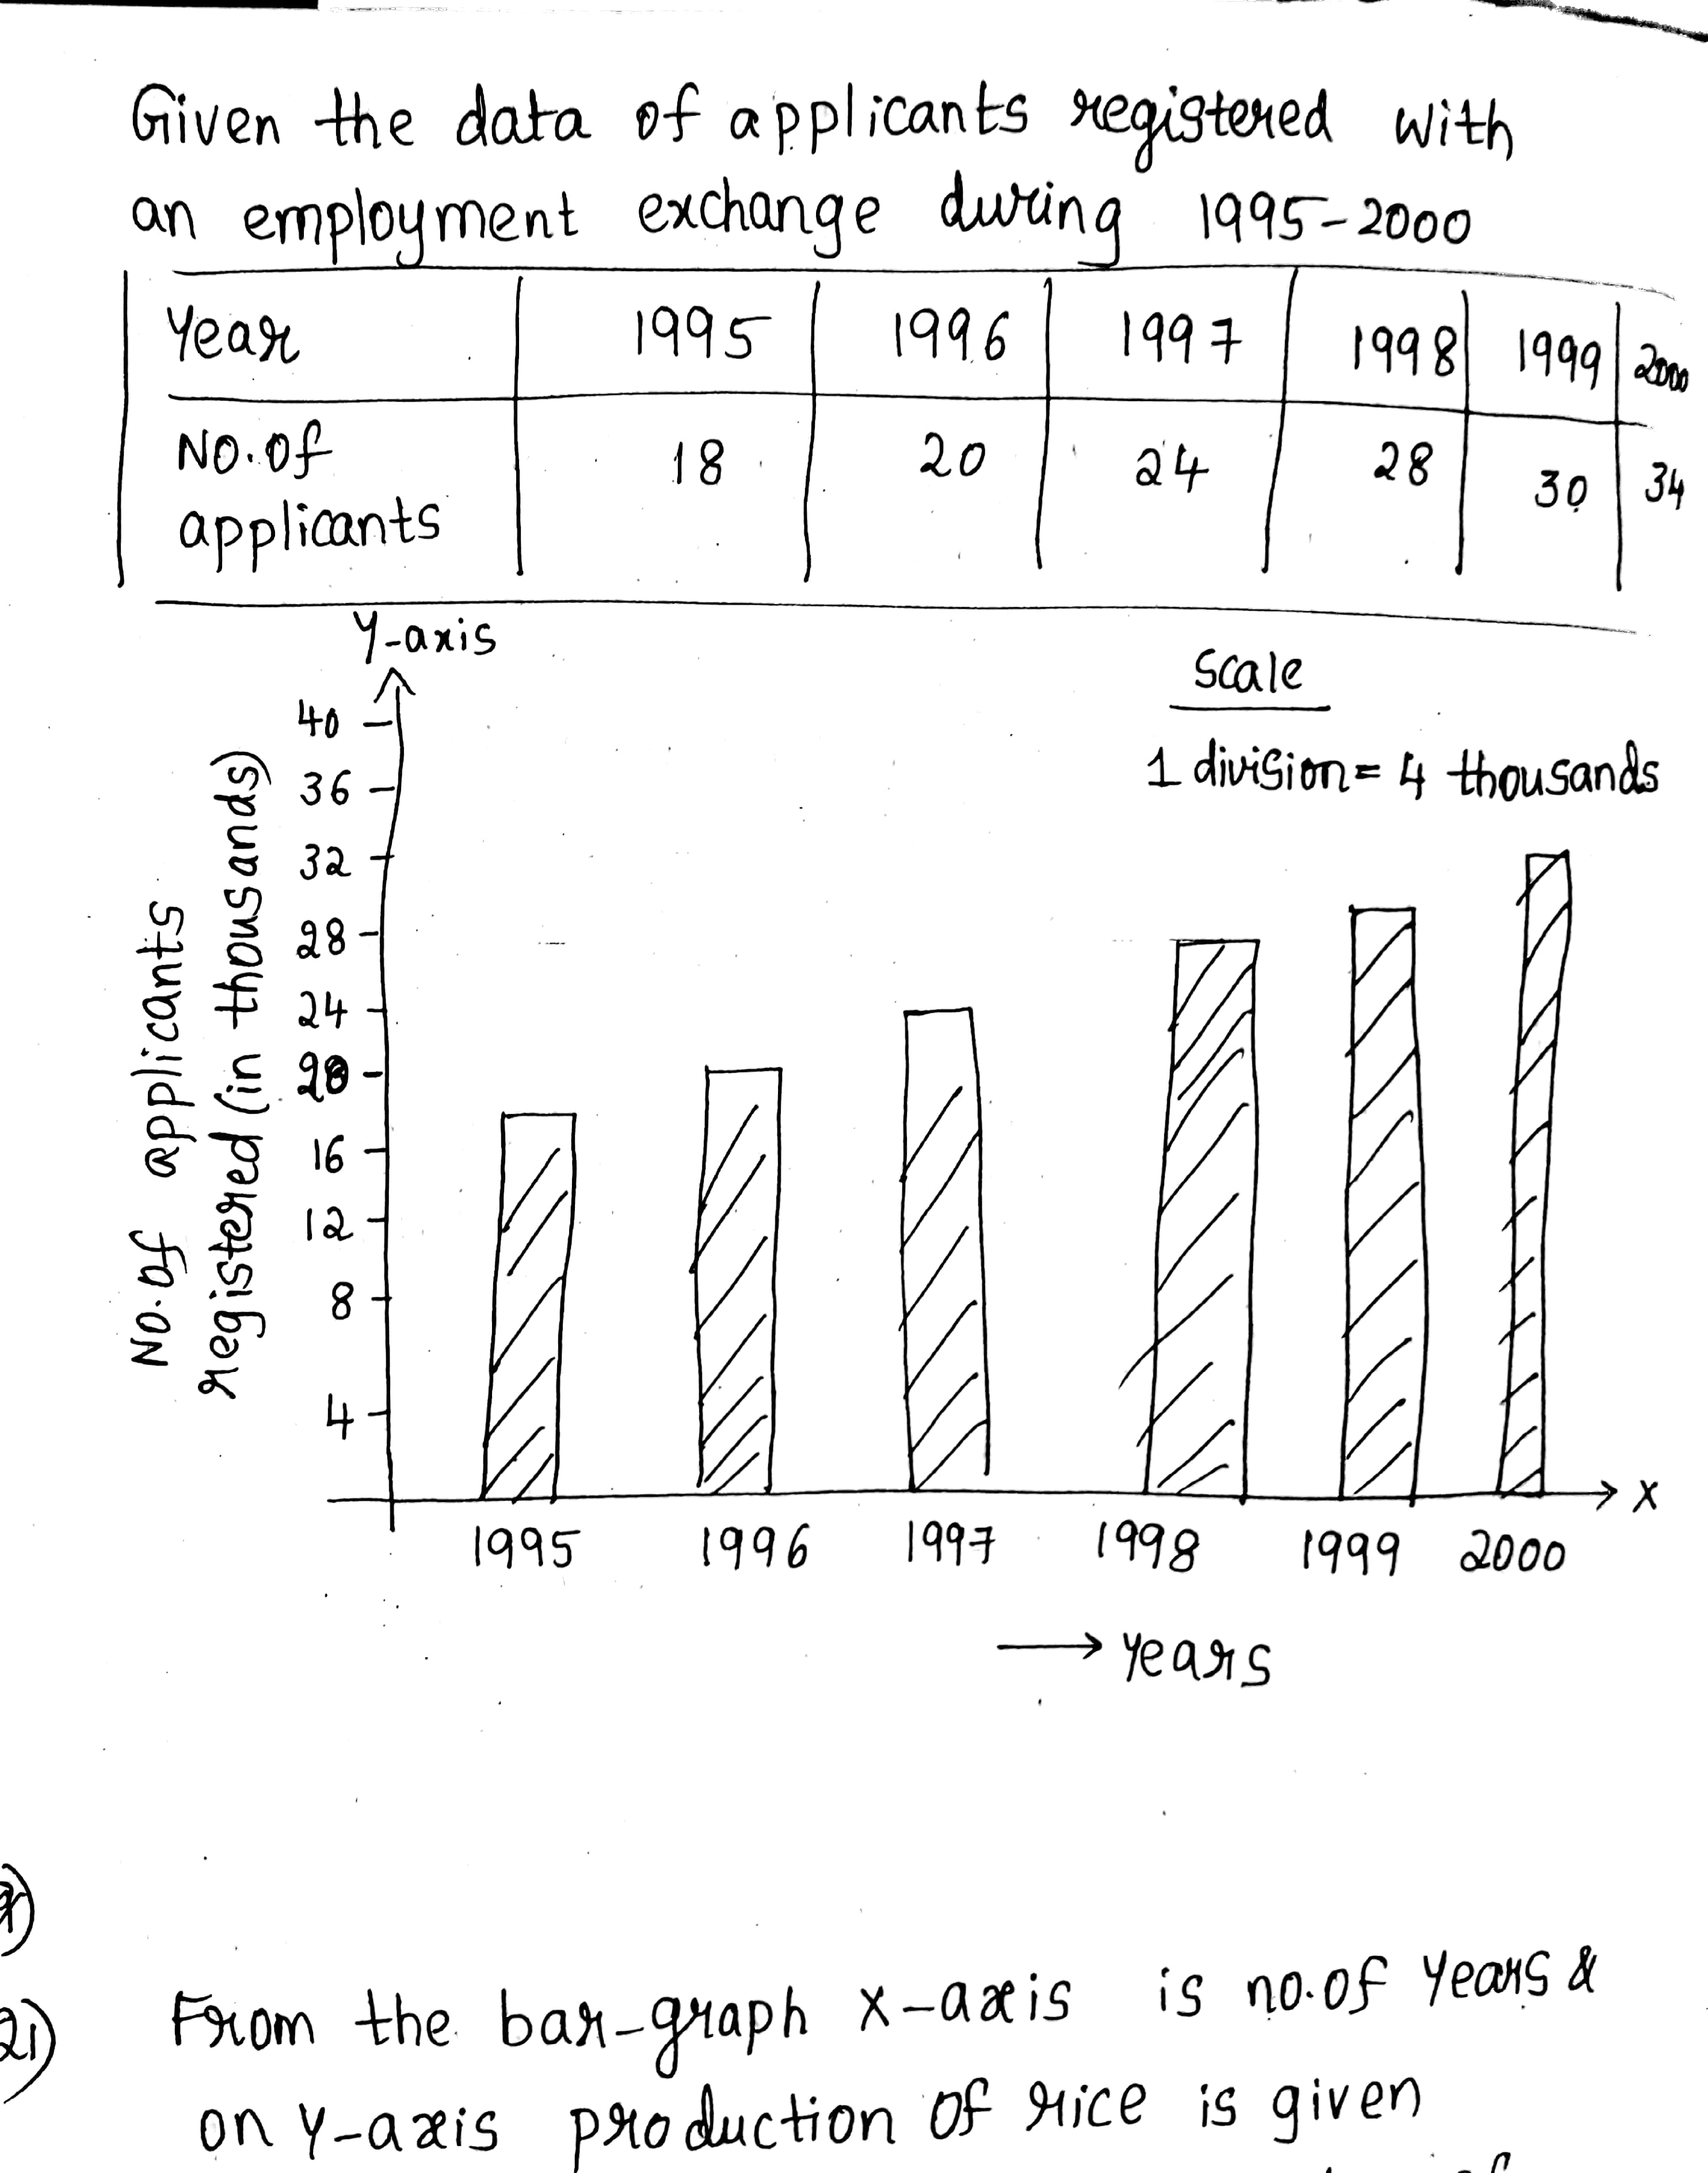
The following data gives the number (in thousands) of applicants registered with an Employment Exchange during, 1995-2000 :
| Year | 1995 | 1996 | 1997 | 1998 | 1999 | 2000 |
| Number of applicants registered (in thousands ) | 18 | 20 | 24 | 28 | 30 | 34 |
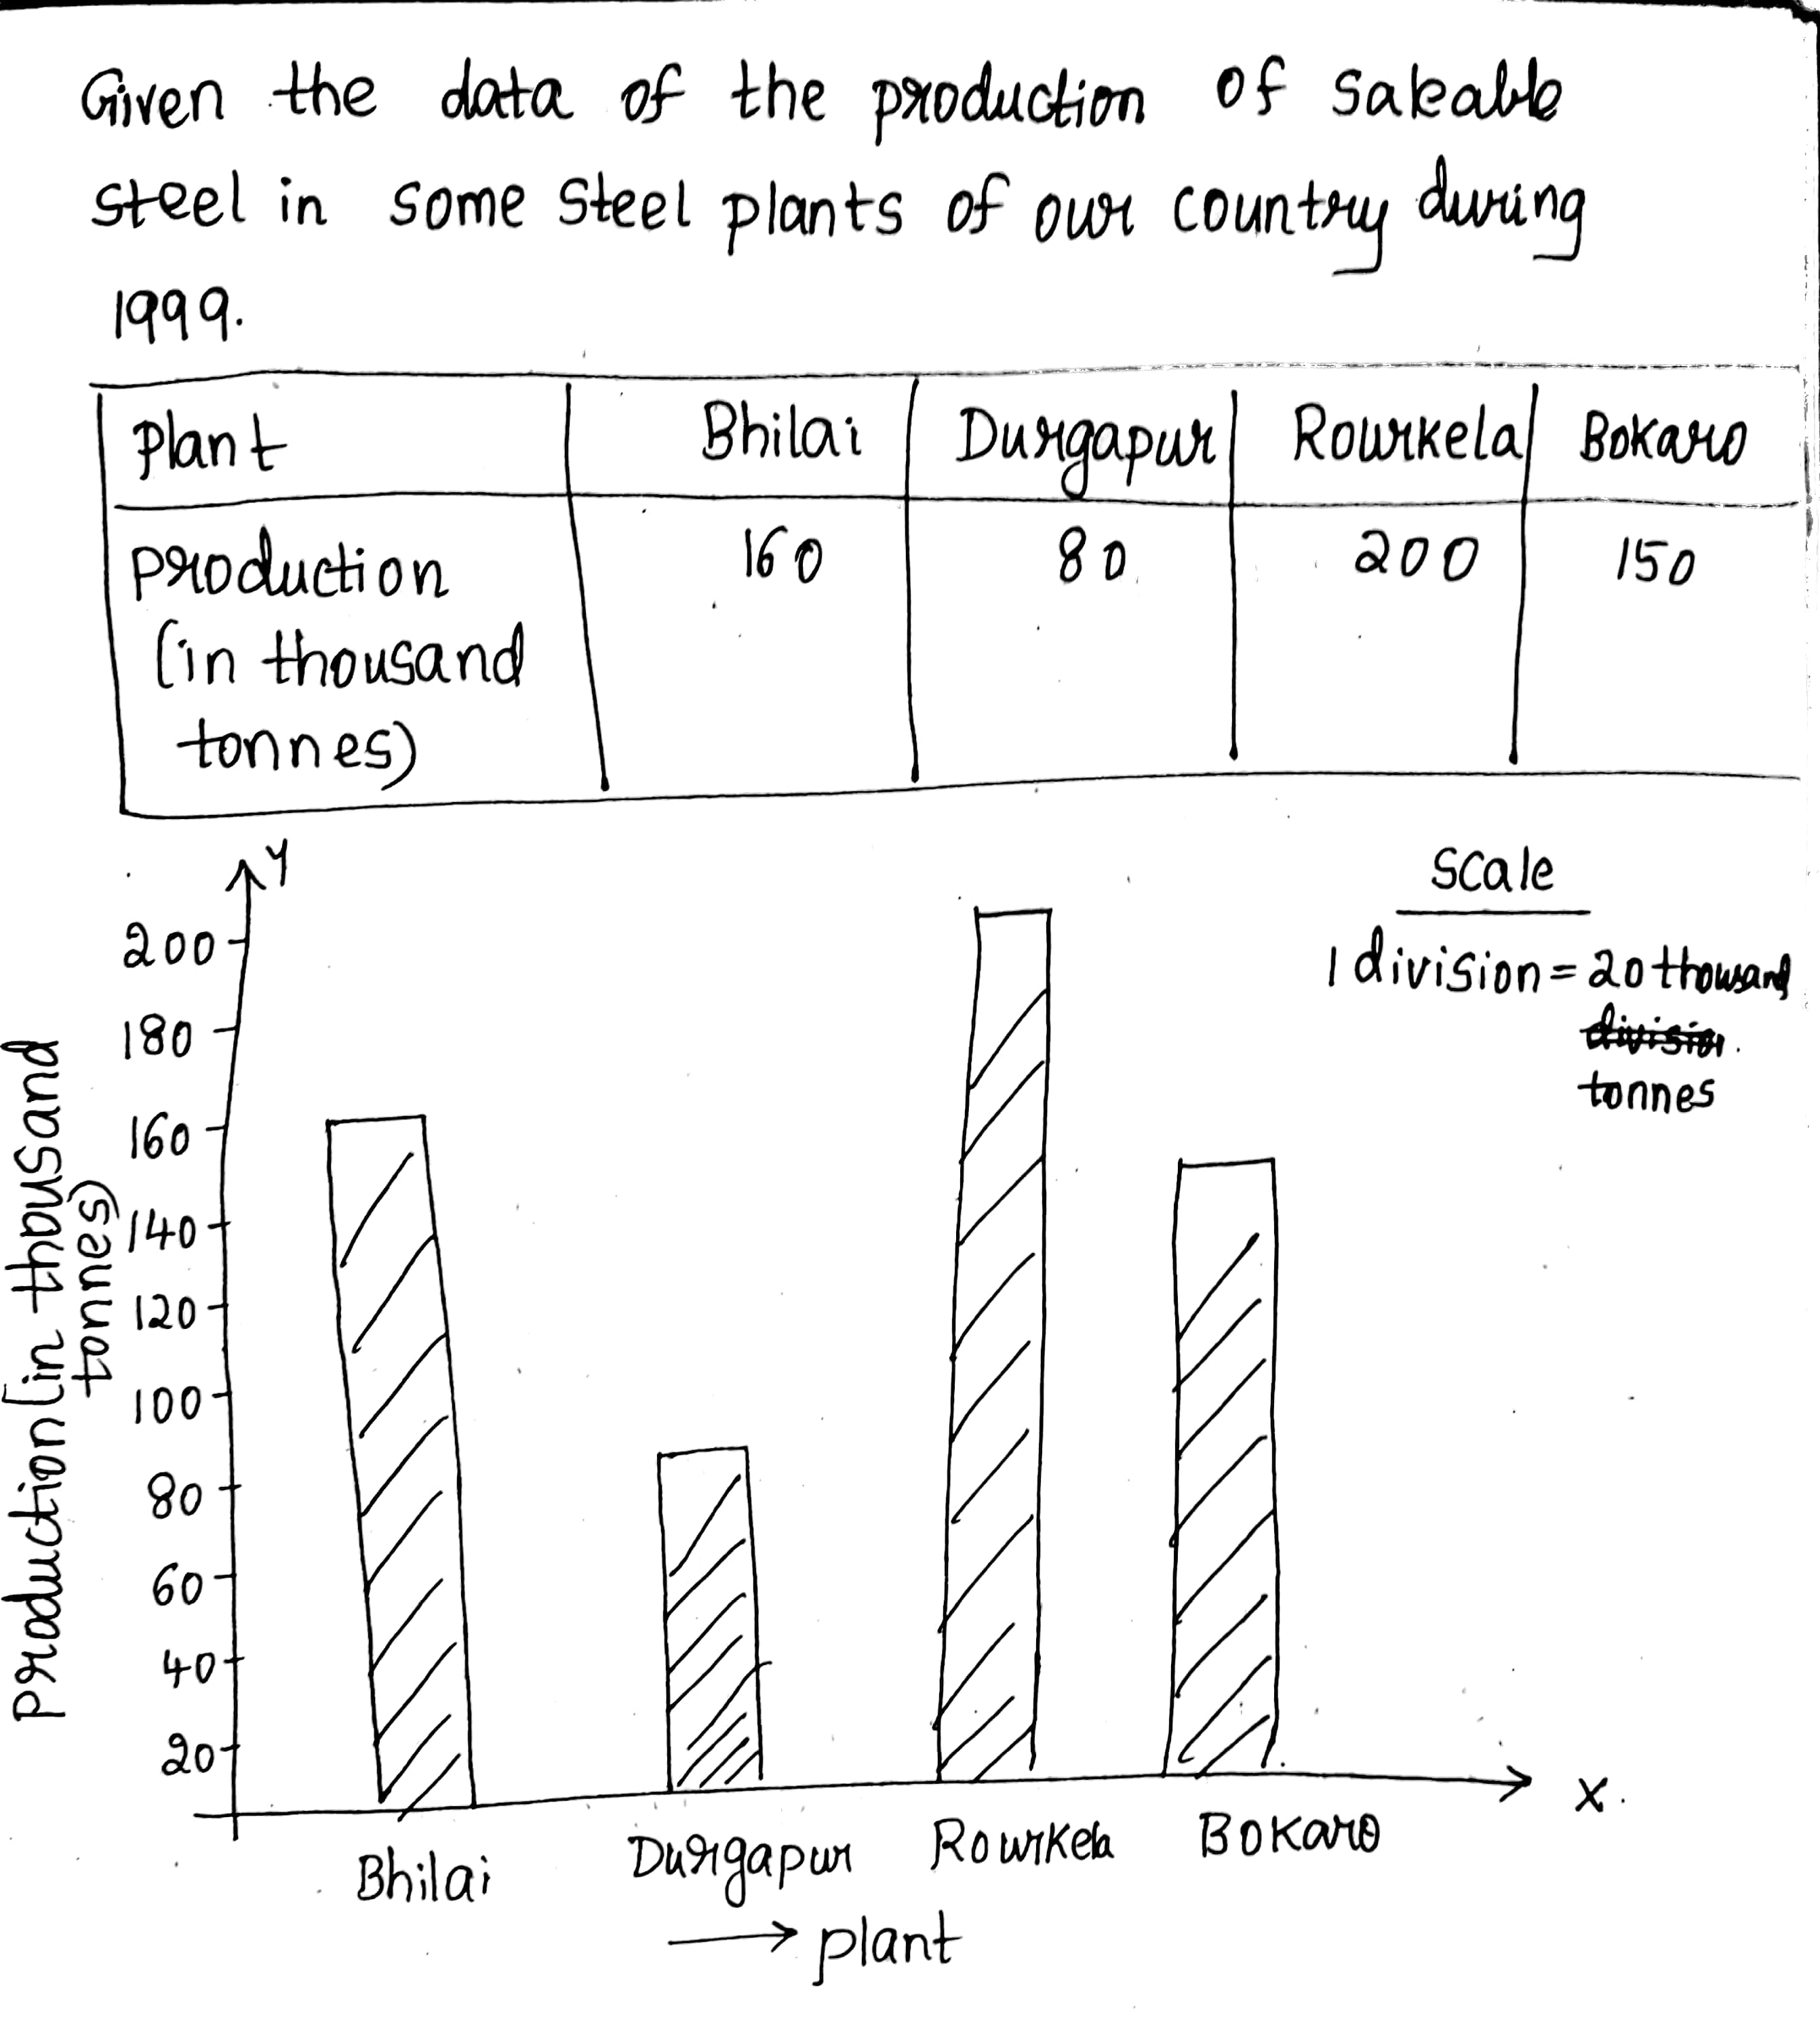
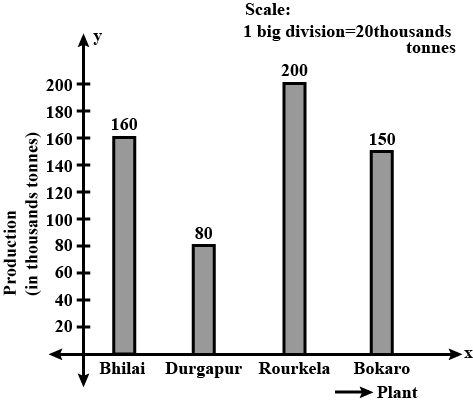
The production of saleable steel in some of the steel plants of our country during 1999 is given below:
| Plant | Bhilai | Durgapur | Rourkela | Bokaro |
| Production (In thousand tonnes ) | 160 | 80 | 200 | 150 |
The bar graph shown in Fig.16 represents the circulation of newspapers in 10 languages.
study the bar graph and answer the following question:
Name two pairs of languages which publish the same number of newspapers.

The following data gives the number (in thousands) of applicants with an Employment Exchange during, 1995-2000 :
| Year | 1995 | 1996 | 1997 | 1998 | 1999 | 2000 |
| Number of applicants registered (in thousands ) | 18 | 20 | 24 | 28 | 30 | 34 |
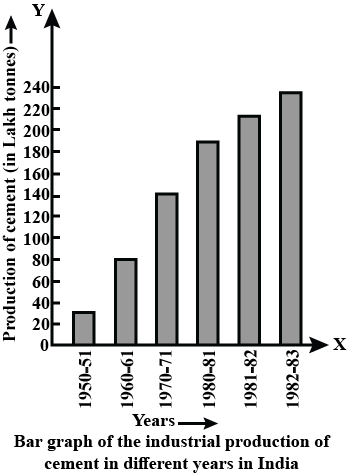
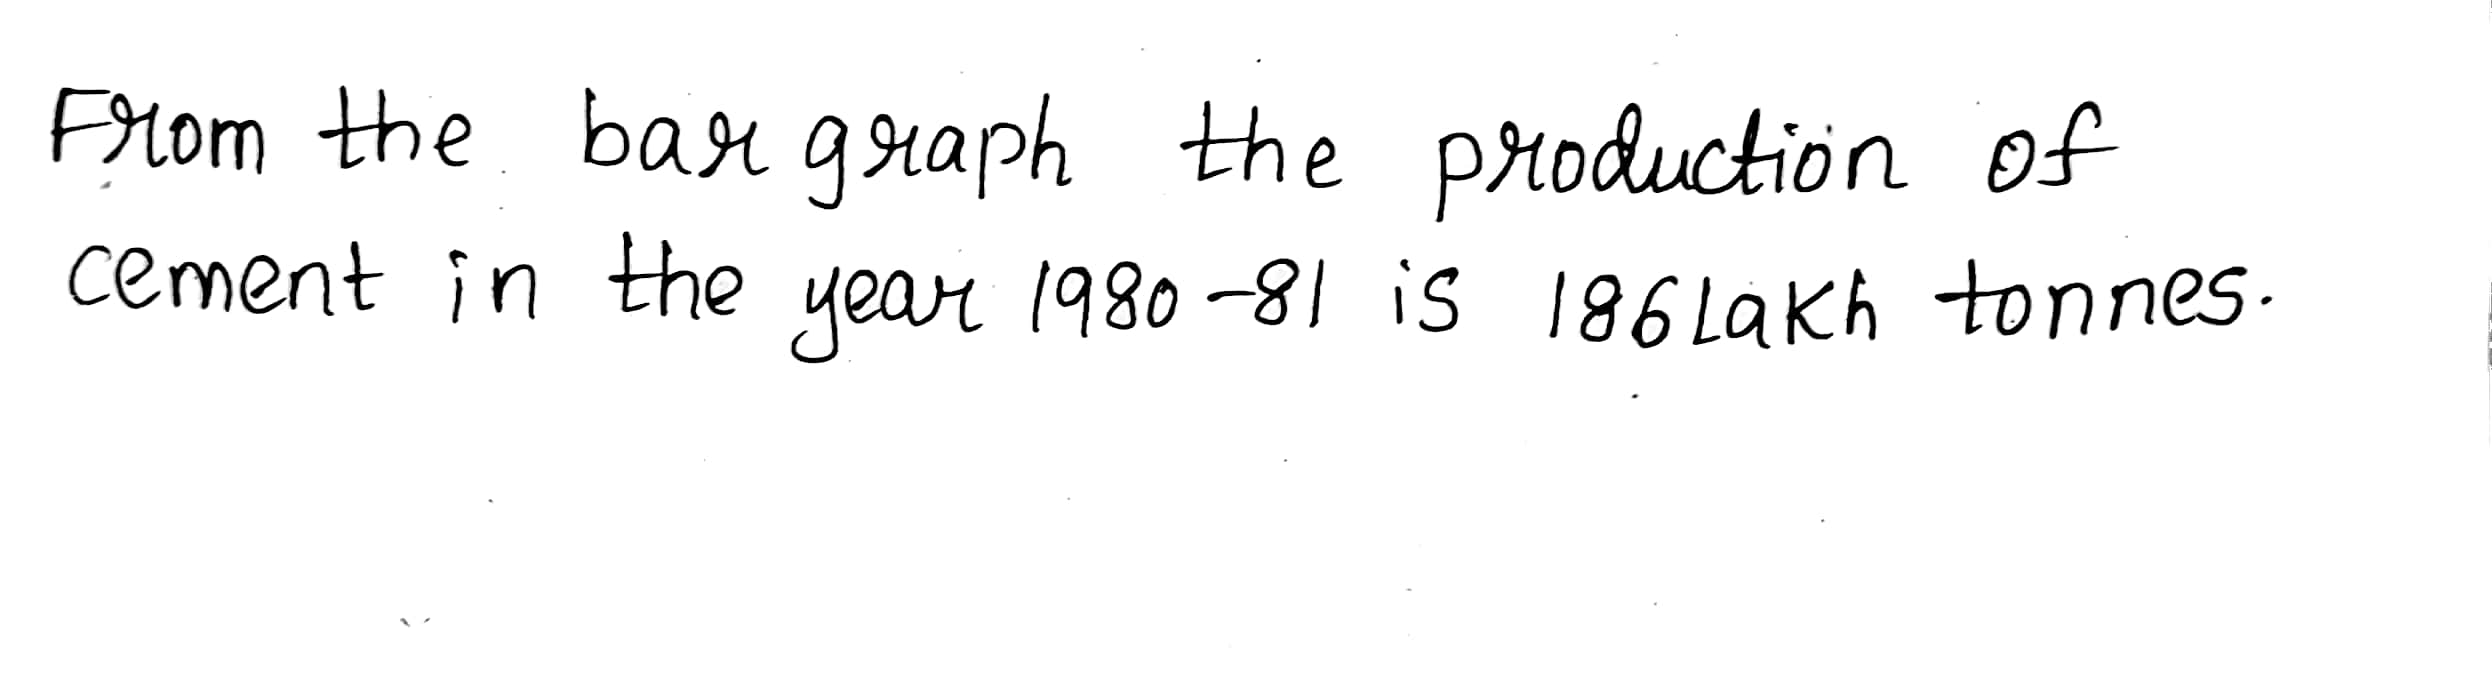
Read the following bar graph (Fig. 23.15) and answer the following questions:
What was the production of cement in the year 1980-81?
Read the bar graph given in above figure and answer the following question:
What information is given by the bar graph?
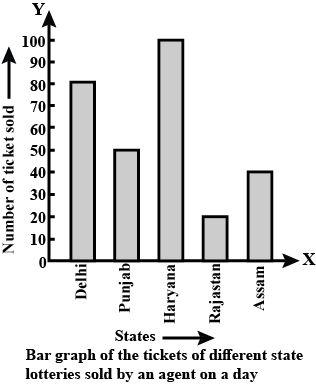
Read the bar graph shown in fig. and answer the following question:
Of which state, were the minimum number of tickets sold?
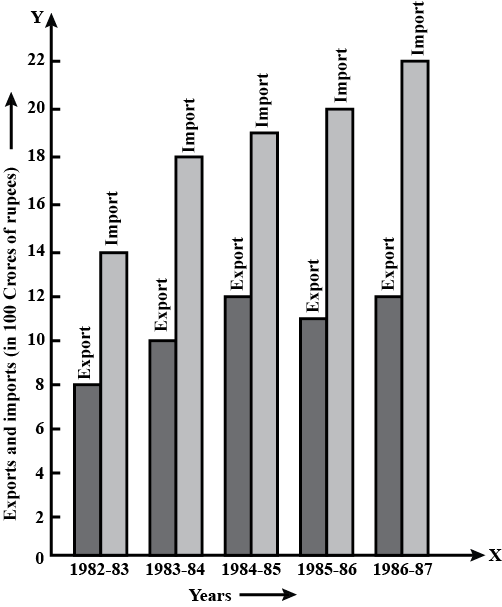
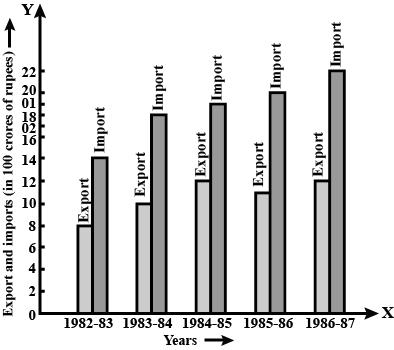
Read the following bar graph and answer the following questions:
In which year the difference of the values of export and import is maximum?
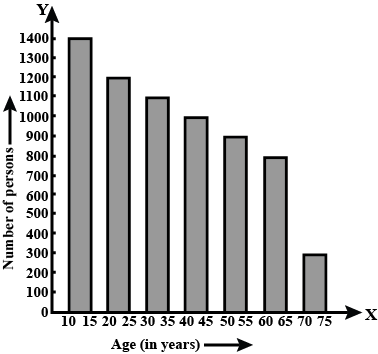
Study the bar graph representing the number of persons in various age groups in a town shown in Fig.. Observe the bar graph and answer the following questions:
What is the age-group of exactly $$1200$$ persons living in the town?
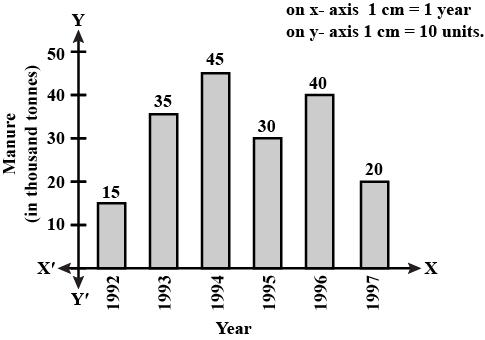
The following data gives the amount of manure (in thousand tonnes) manufactured by a company during some years:
| Year | 1992 | 1993 | 1994 | 1995 | 1996 | 1997 |
| Manure (in thousand tonnes) | 15 | 35 | 45 | 30 | 40 | 20 |
Given data gives the amount of manure(in thousand tonnes) manufactured by a company during some years
Year $$1992$$ $$1993$$ $$1994$$ $$1995$$ $$1996$$ $$1997$$
Manure(in thousand tonnes) $$15$$ $$35$$ $$45$$ $$30$$ $$40$$ $$20$$
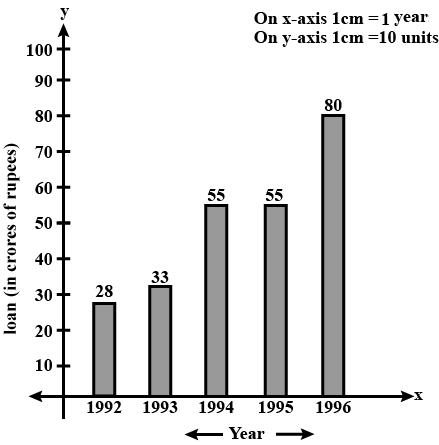
The following data gives the amount of loans (in crores of rupees) disbursed by a bank during some years:
| Year | 1992 | 1993 | 1994 | 1995 | 1996 |
| Loan (in crores of rupees) | 28 | 33 | 55 | 55 | 80 |
The amount of loans(in crores of rupees) disturbed by a bank-during some years
Year $$1992$$ $$1993$$ $$1994$$ $$1995$$ $$1996$$
Loan(in crores of rupees) $$28$$ $$33$$ $$55$$ $$55$$ $$80$$
The following data gives the number (in thousands) of applicants registered with an Employment Exchange during. $$1995-2000$$:
| Year | $$1995$$ | $$1996$$ | $$1997$$ | $$1998$$ | $$1999$$ | $$2000$$ |
| Number of applicants registered (in thousands) | $$18$$ | $$20$$ | $$24$$ | $$28$$ | $$30$$ | $$34$$ |
Given that
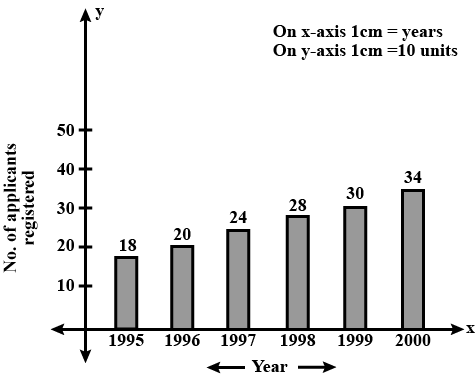
the number (in thousand) of applicant's registered with an employment Exchange during $$1995-2000$$
| Year | 1995 | 1996 | 1997 | 1998 | 1999 | 2000 |
| No of applicants registered (in thousand) | 18 | 20 | 24 | 28 | 30 | 34 |
The production of saleable steel in some of the steel plants of our country during 1999 is given below:
| Plant | Bhilai | Durgapur | Rourkela | Bokaro |
| Production (In thousand tonnes) | 160 | 80 | 200 | 150 |
Given that
the production of salesble steel in some of the steel
plants of our country during $$1999$$ is
Plant Bhilai Durgapur Rourkela Bokaro
Production(in thousand tonnes) $$160$$ $$80$$ $$200$$ $$150$$
Two dice, one blue and one grey, are thrown at the same time. Write down all the possible outcomes. What is the probability that sum of the two numbers appearing on the top of the dice is
$$8$$
The following table gives the route length (in thousand kilometres) of the Indian Railways in some of the years:
| Year | 1960-61 | 1970-71 | 1980-81 | 1990-91 | 2000-2001 |
| Route length (in thousand kilometres) | 56 | 60 | 61 | 74 | 98 |
The data gives the route length(in thousand kilometer) of the Indian Railways in some of the years.
Year $$1960-61$$ $$1970-71$$ $$1980-81$$ $$1990-91$$ $$2000-2001$$
Route length(in thousand kilometers) $$56$$ $$60$$ $$61$$ $$74$$ $$98$$
From a well-shuffled deck of $$ 52 $$ cards, one card is drawn at random. What is the number of all possible outcomes?
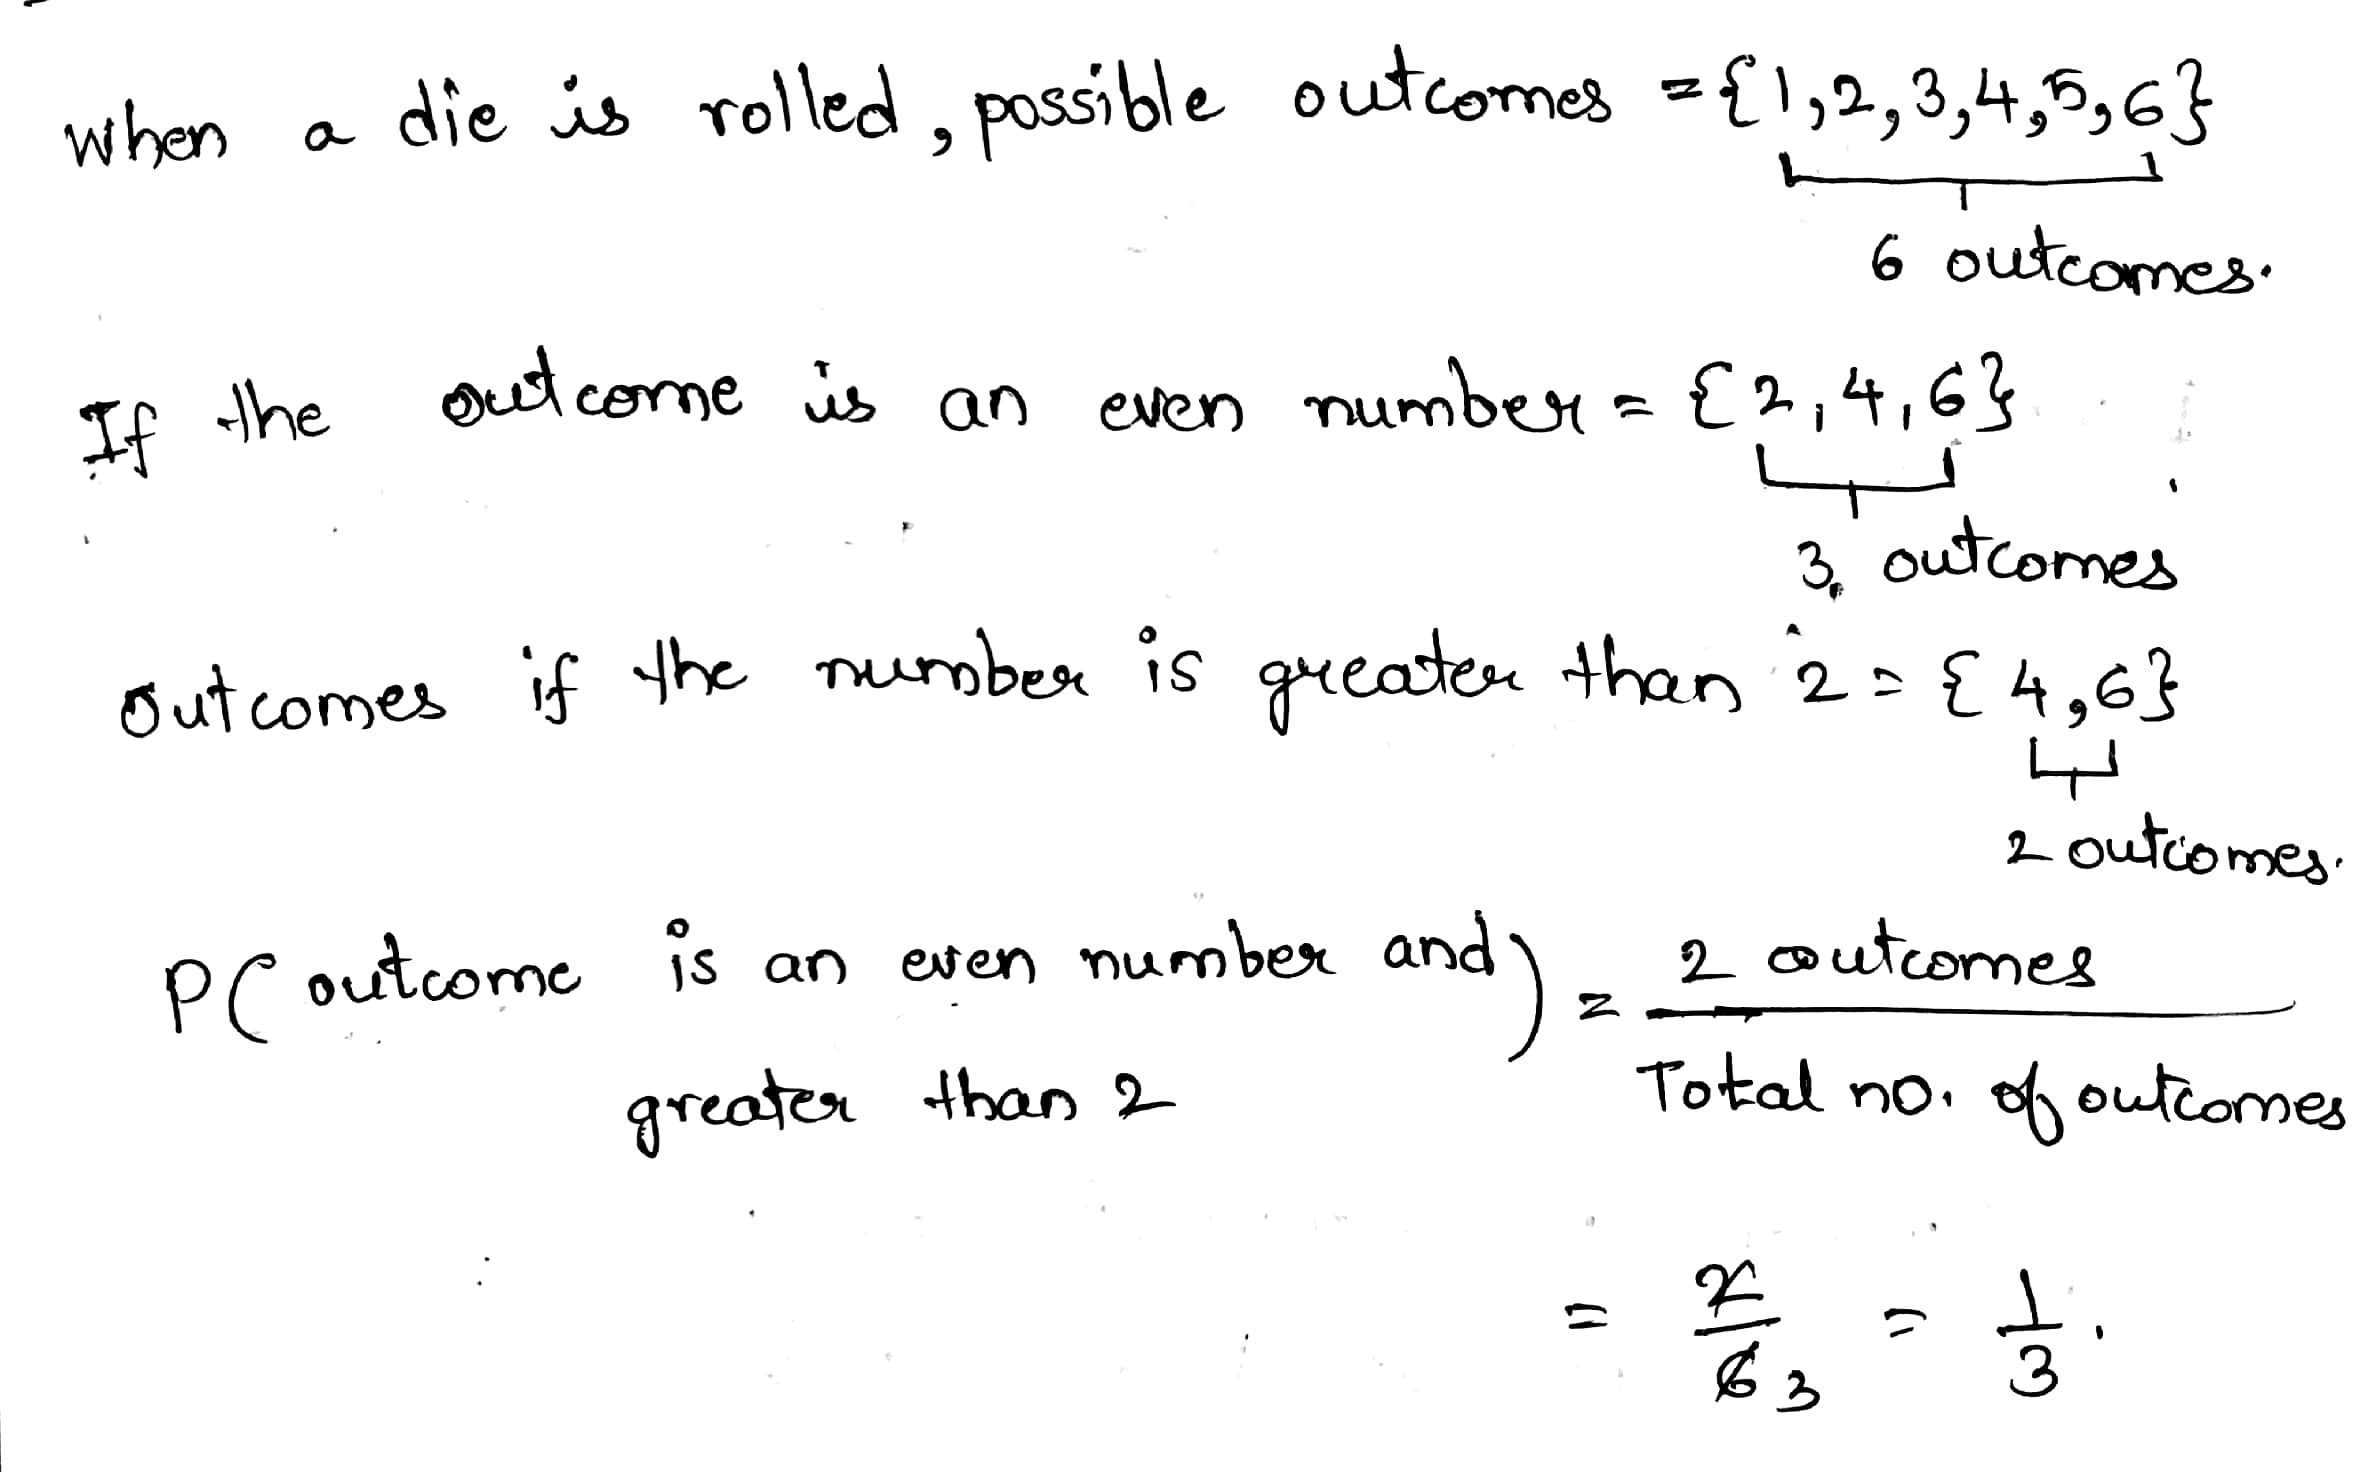
A die is rolled. If the outcome is an even number, what is the probability that it is a number greater than $$2$$?
Two coins are tossed simultaneously. What are all possible outcomes?
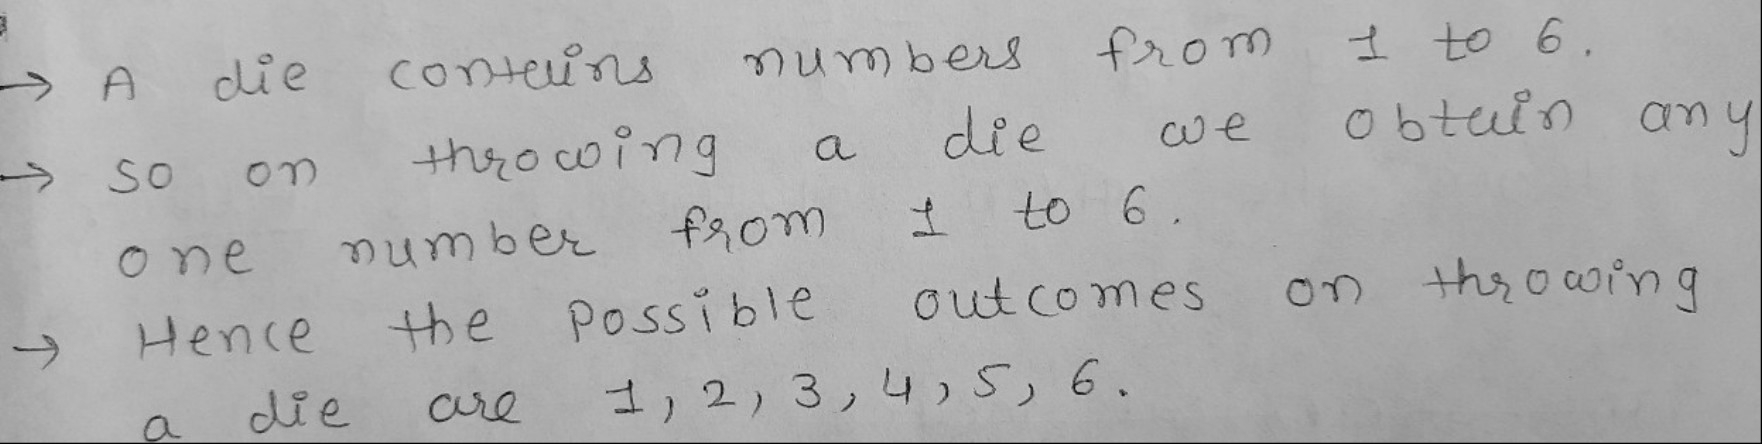
A die is thrown. What are all possible outcomes?
A coin is tossed. What are all possible outcomes?
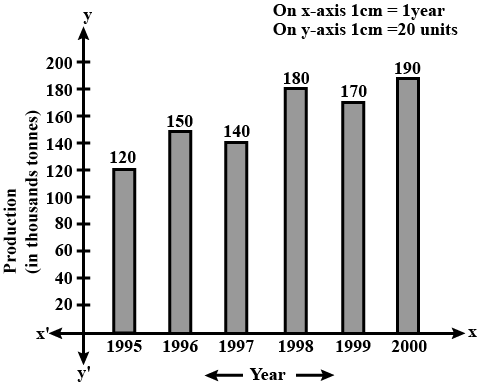
The following data gives the production of foodgrains (in thousand tonnes) for some years:
| Year | 1995 | 1996 | 1997 | 1998 | 1999 | 2000 |
| Production (in thousand tonnes) | 120 | 150 | 140 | 180 | 170 | 190 |
Given data gives
the production of food grains(in thousand tonnes) for some years
Year $$1995$$ $$1996$$ $$1997$$ $$1998$$ $$1999$$ $$2000$$
Production(in thousand tonnes) $$120$$ $$150$$ $$140$$ $$180$$ $$170$$ $$190$$
The lengths in km (rounded to nearest hundred)
of some major rivers of India are given below:
Draw a bar graph to represent the above information.
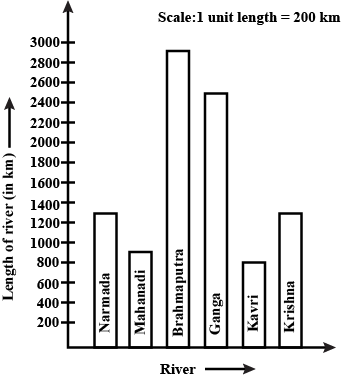
Take the length of River on the vertical axis and name of River on
horizontal axis.

horizontal axis.
In Throwing a die the number of possible outcomes is
In the experiment of tossing a coin one time, the outcome is either _____ or ______.
The total number of outcomes when a coin is tossed is ______
List the outcomes you can see in these experiments
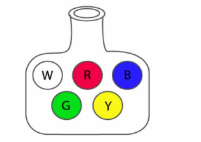
Drawing a ball from the containing $$5$$ identical ball of different containing $$5$$ identical ball of different colours
List the outcomes you can see in these experiments
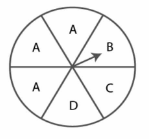
Spinning a wheel
Which of the following experiments have equality likely outcomes? Explain
A player attempts to shoot a basketball. She/he shoot or misses the shot.
Two dice are rolled together. Write all the possible outcomes and find the probability of getting
a doubtlet (the same number appearing on each of the die)
Which of the following experiments have equality likely outcomes? Explain
A driver attempts to start a car. The car starts or does not start.
Which of the following have equally likely outcomes?
Explain
A player calls for a head in a toss of a coin. The coin shows up either heads or tails.
Which of the following have equally likely outcomes?
Explain
A batsman plays and misses a ball. The either hits the wickets or misses them.
Which of the following have equally likely outcomes?
Explain
An attempt was made to answer a true-false question.
The answer is correct or incorrect.
Two dice, one blue and one grey, are thrown at the same time. Write down all the possible outcomes. What is the probability that sum of the two numbers appearing on the top of the dice is
$$13$$
Two dice, one blue and one grey, are thrown at the same time. Write down all the possible outcomes. What is the probability that sum of the two numbers appearing on the top of the dice is
less than or equal to $$12$$?
A die of six faces marked with the integers $$1,2,3,4,5,6$$ one on each face. Is thrown twice in succession what is the total number of outcomes thus obtained?
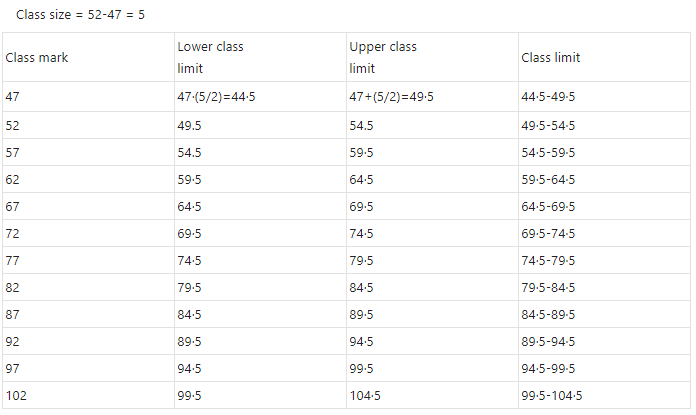
Write the class size and class limits in each of the following:
$$47,52,57,62,67,72,77,82,87,92,97$$ and $$102$$
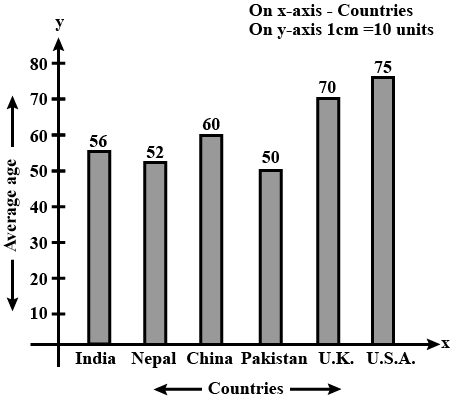
The following data shows the average age of men in various countries in a certain year:
| Country | India | Nepal | China | Pakistan | U.K. | U.S.A. |
| Average age (in years) | 56 | 52 | 60 | 50 | 70 | 75 |
Given data shows
The average age of man in various countries in a certain year
Country India Nepal China Pakistan U.K U.S.A
Average age(in years) $$56$$ $$52$$ $$60$$ $$50$$ $$70$$ $$75$$
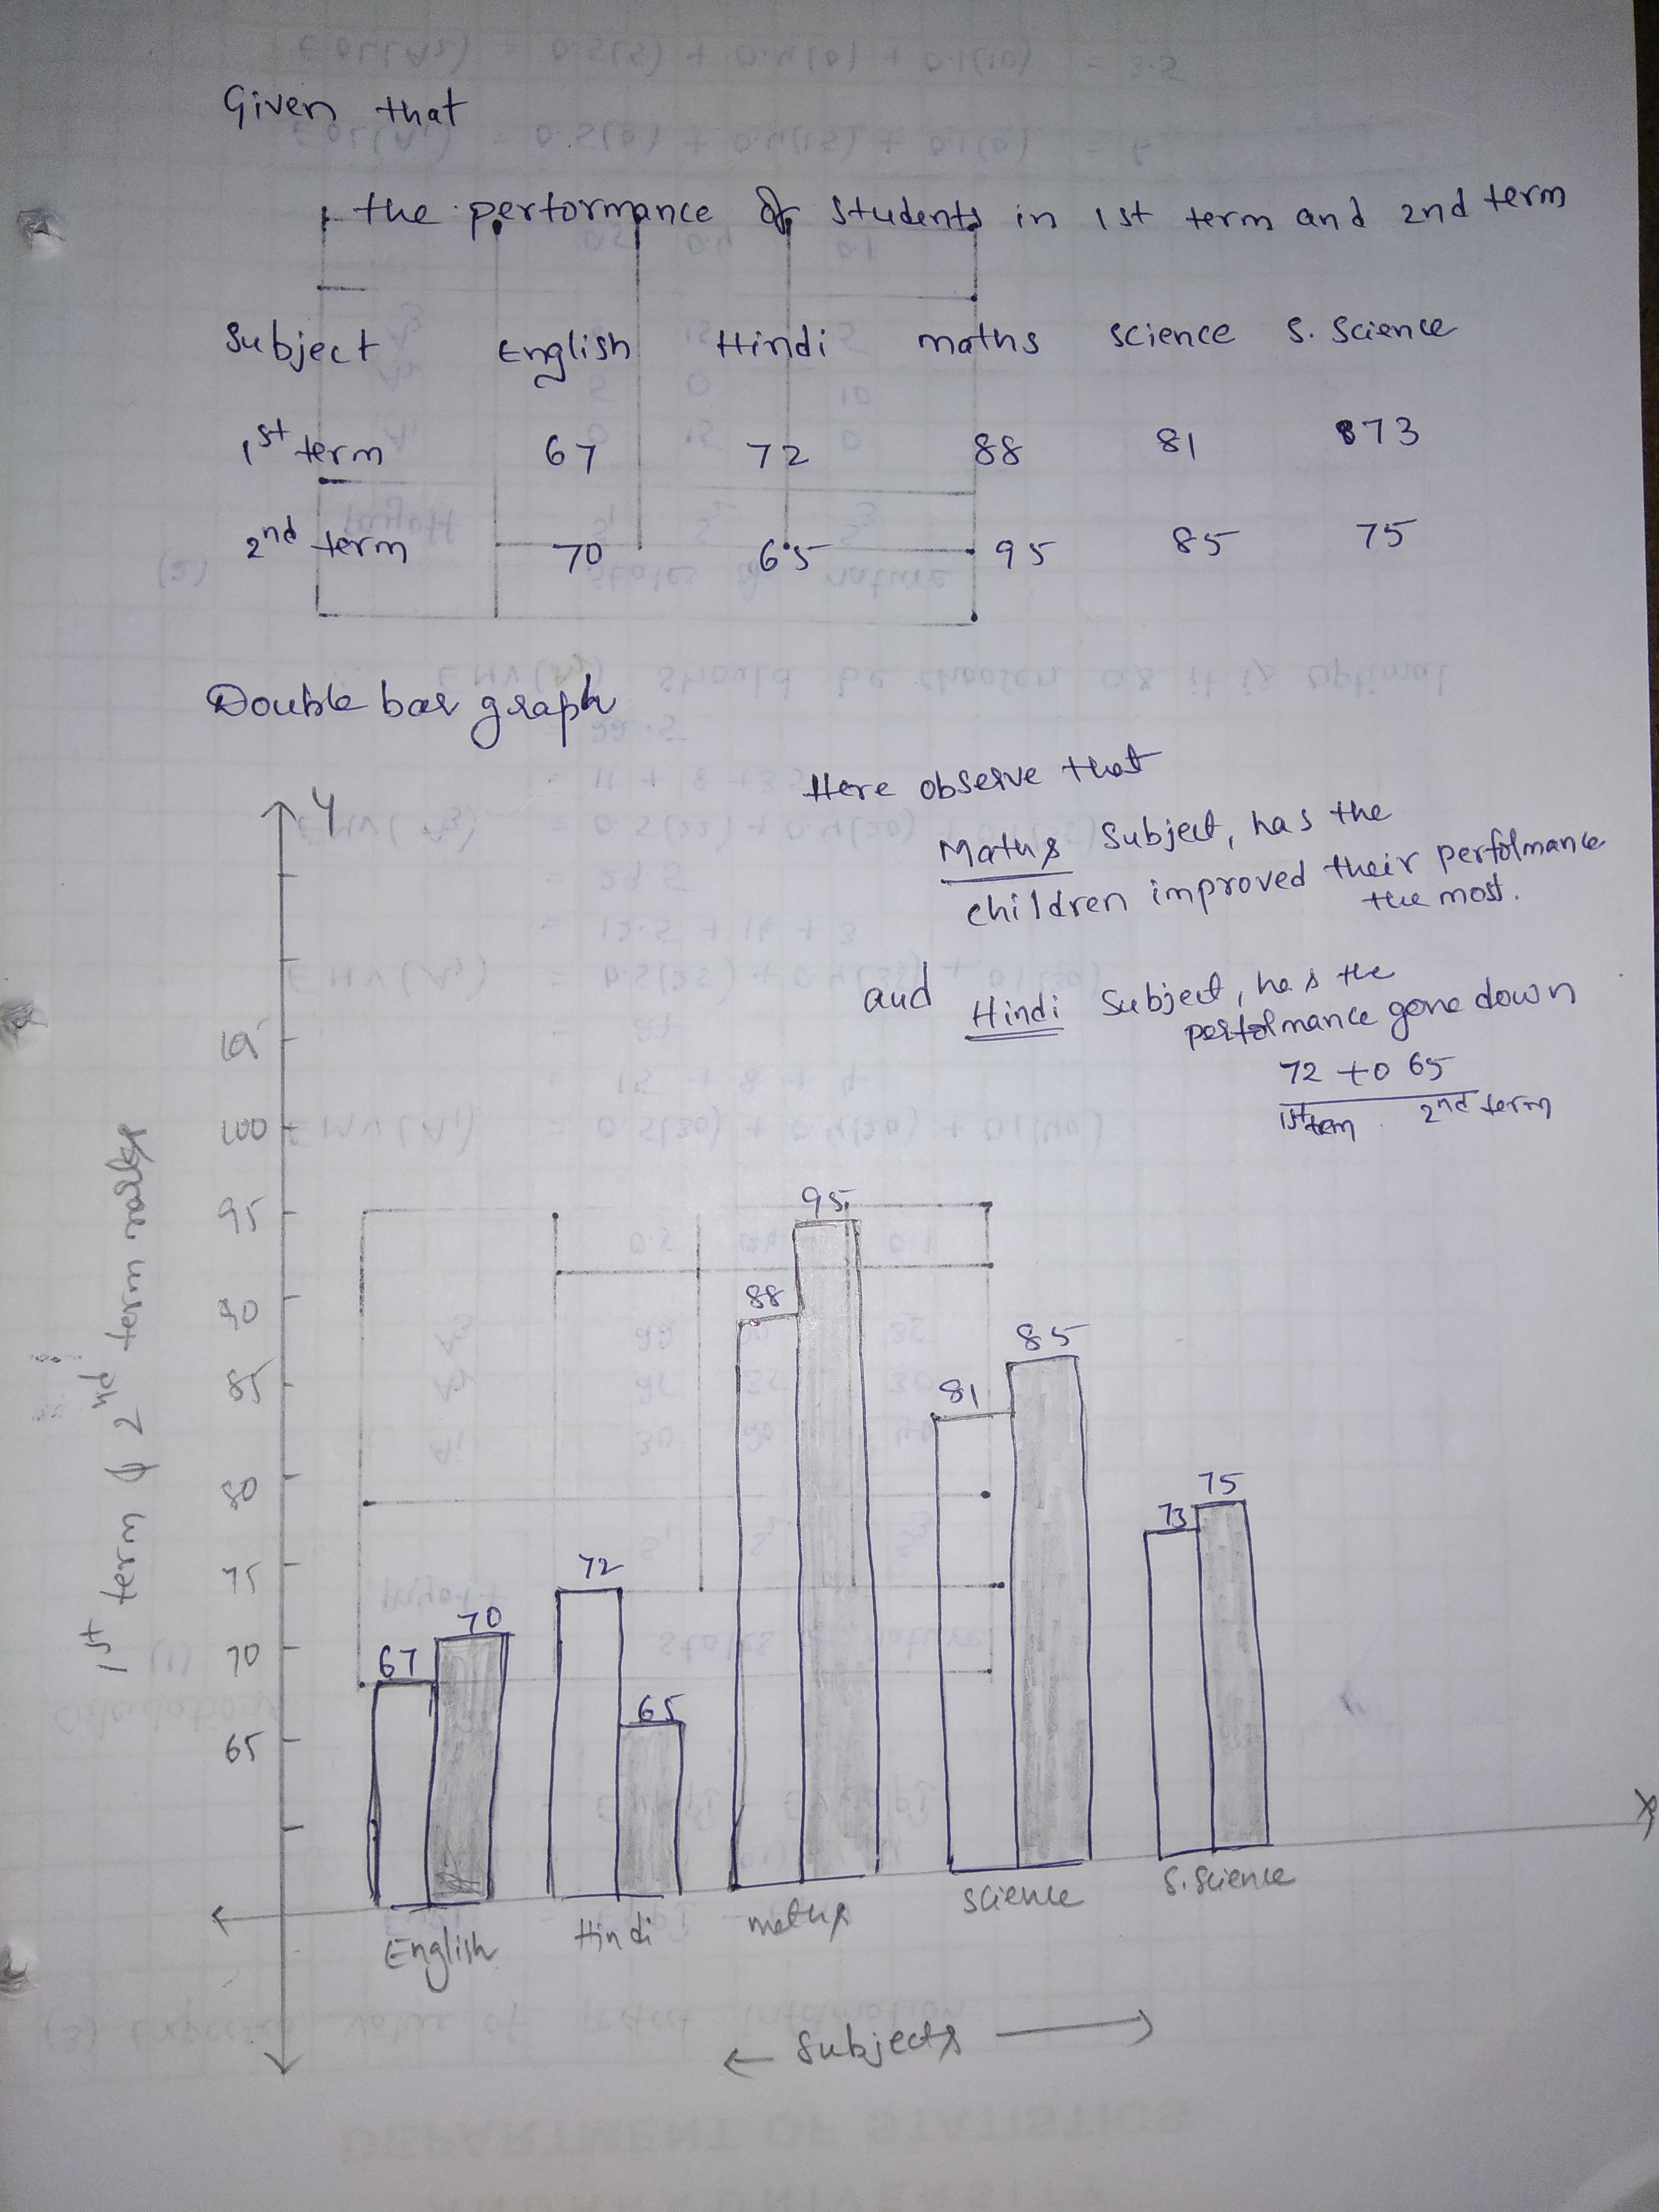
The performance of students in 1 st term and 2nd term is as given below. Draw a double bar graph choosing appropriate scale and answer the following:
| Subject: | English | Hindi | Maths | Science | S.Science |
| $$ 1^{st}$$ term: | 67 | 72 | 88 | 81 | 73 |
| $$ 2^{nd}$$ term: | 70 | 65 | 95 | 85 | 75 |
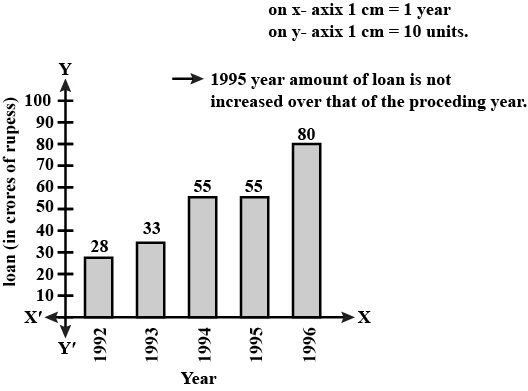
The following data gives the amount of loans (in crores of rupees) disbursed by a bank during some years:
| Year | 1992 | 1993 | 1994 | 1995 | 1996 |
| Loan(in crores of rupees) | 28 | 33 | 55 | 55 | 80 |
Given data
the amount of loans(in crores of rupees) distributed by a bank-during some years
Year $$1992$$ $$1993$$ $$1994$$ $$1995$$ $$1996$$
Loan(in crores of rupees) $$28$$ $$33$$ $$55$$ $$55$$ $$80$$
$$1995$$ year amount of loan is not increased over that of the proceding year.
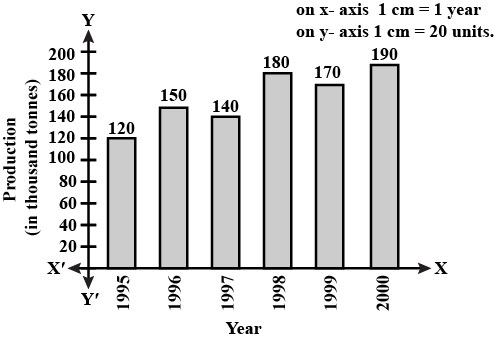
The following data gives the production of food grains (in thousand tonnes) for some years:
| Year | 1995 | 1996 | 1997 | 1998 | 1999 | 2000 |
| Production (in thousand tonnes) | 120 | 150 | 140 | 180 | 170 | 190 |
Given data gives
the production of food grains(in thousand tonnes) for same years
Year $$1995$$ $$1996$$ $$1997$$ $$1998$$ $$1999$$ $$2000$$
Production(in thousand tonnes) $$120$$ $$150$$ $$140$$ $$180$$ $$170$$ $$190$$.
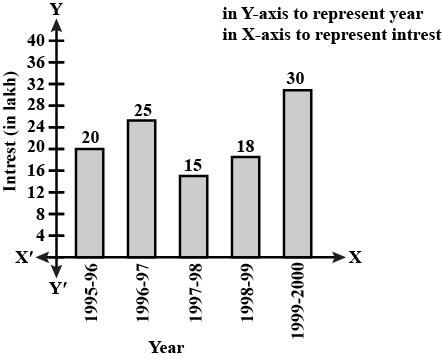
The following table shows the interest paid by a company (in lakhs):
| Year | 1995-96 | 1996-97 | 1997-98 | 1998 | 1999-2000 |
| Interest (in lakes of rupees) | 20 | 25 | 15 | 18 | 30 |
Given table shows
the interest paid by a company(in lakhs)
Year $$1995-96$$ $$1996-97$$ $$1997-98$$ $$1998-1999$$ $$1999-2000$$
Interest(in lakhs) $$20$$ $$25$$ $$15$$ $$18$$ $$30$$
Class 8 Maths Extra Questions
- Algebraic Expressions And Identities Extra Questions
- Comparing Quantities Extra Questions
- Cubes And Cube Roots Extra Questions
- Data Handling Extra Questions
- Direct And Inverse Proportions Extra Questions
- Exponents And Powers Extra Questions
- Factorisation Extra Questions
- Introduction To Graphs Extra Questions
- Linear Equations In One Variable Extra Questions
- Mensuration Extra Questions
- Playing With Numbers Extra Questions
- Practical Geometry Extra Questions
- Rational Numbers Extra Questions
- Squares And Square Roots Extra Questions
- Understanding Quadrilaterals Extra Questions
- Visualising Solid Shapes Extra Questions