Introduction To Graphs - Class 8 Maths - Extra Questions
Write the co-ordinates of the point of intersection of x-axis and Y-axis.
The process of fixing a point with the help of the coordinates is known as ________ of the point.
The $$y$$-coordinate of the point $$(2, 4)$$ is _______ .
Fill in the blank space in the following statement :-
"The abscissa of a point on the $$y$$-axis is ____
$$\text{Given below are some points, with their co-ordinates.}$$
$$P(4, 3), Q(-3, 2), R(5, 1), S(0, -4)$$
$$What\space is\space the\space x-coordinate\space of \space point P$$?
Write the name of the point where the two axes meet.
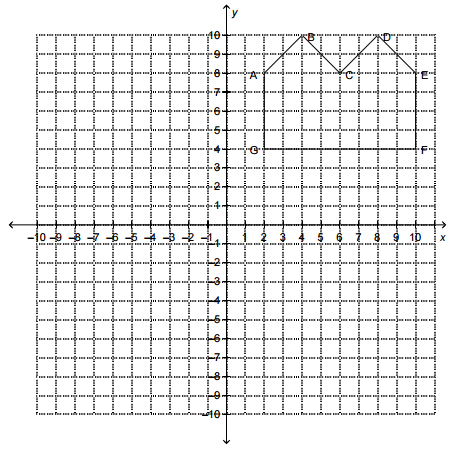
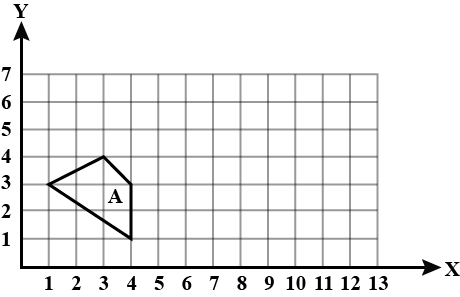
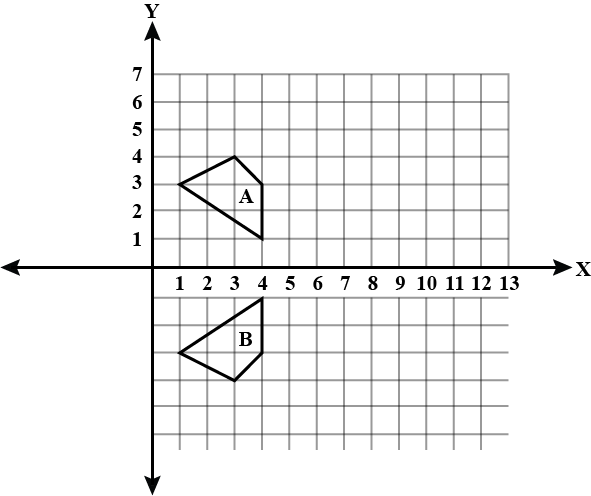
Find a transformation of the polygon that does not result in a diagram with line symmetry or rotational symmetry. Draw the image and list the coordinates of the vertices of the larger shape. How do you know the diagram does not have symmetry?
Given below are some points, with their co-ordinates.
$$P(4, 3), Q(-3, 2), R(5, 1), S(0, -4)$$
What is the $$y-$$coordinate of point $$Q$$ ?
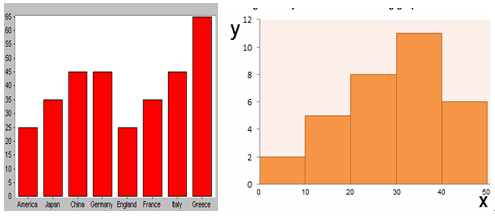
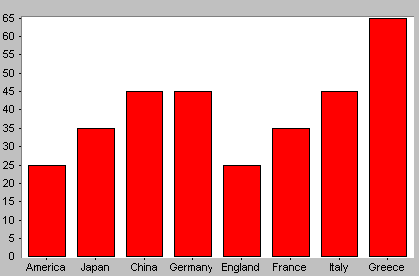
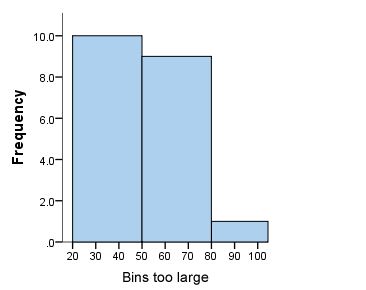
Find the bar graph and state why?
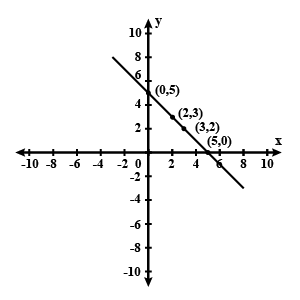
Draw the line passing through $$(2,\,3)$$ and $$(3,\,2)$$. Find the coordinates of the points at which this line meets the x-axis and y-axis.
What is the abscissa of any point on $$y$$-axis?
The centre of a circle is at $$(-6, 4)$$. If one end of a diameter of the circle is at the origin, then find the other end
Give Reasons
A histogram is not a diagram.
Using graph paper (take $$2\ cm = 1$$ unit on both axis), plot the points $$A (-4, 2)$$ and $$B (2, 4)$$
Fill in the blanks with suitable word:
The $$x$$-coordinate is called as ____________.
Give Reasons
A histogram is a two dimensional graph
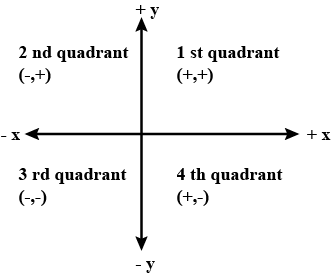
In which quadrant or on which axis do each of the points $$(-2, 4), (3, -1), (-1, 0), (1, 2)$$ and $$(-3, -5)$$ lie?
Find the distance of the point $$(6,-8)$$ from the origin.
Let $$(x+y,1)$$ and $$(3,x-y)$$ be equal ordered pairs then find the value of $$x,y$$.
Find the area of a square whose one pair of opposite vertices are (3,4) and (5,6).
$$A\ (2,\ 3)$$ and $$B\ (-2,\ 5)$$ are two given points.
Find: (i) the gradient of $$AB$$;
(ii) the equation of $$AB$$;
(iii) the co-ordinates of the point, where $$AB$$ intersects x-axis.
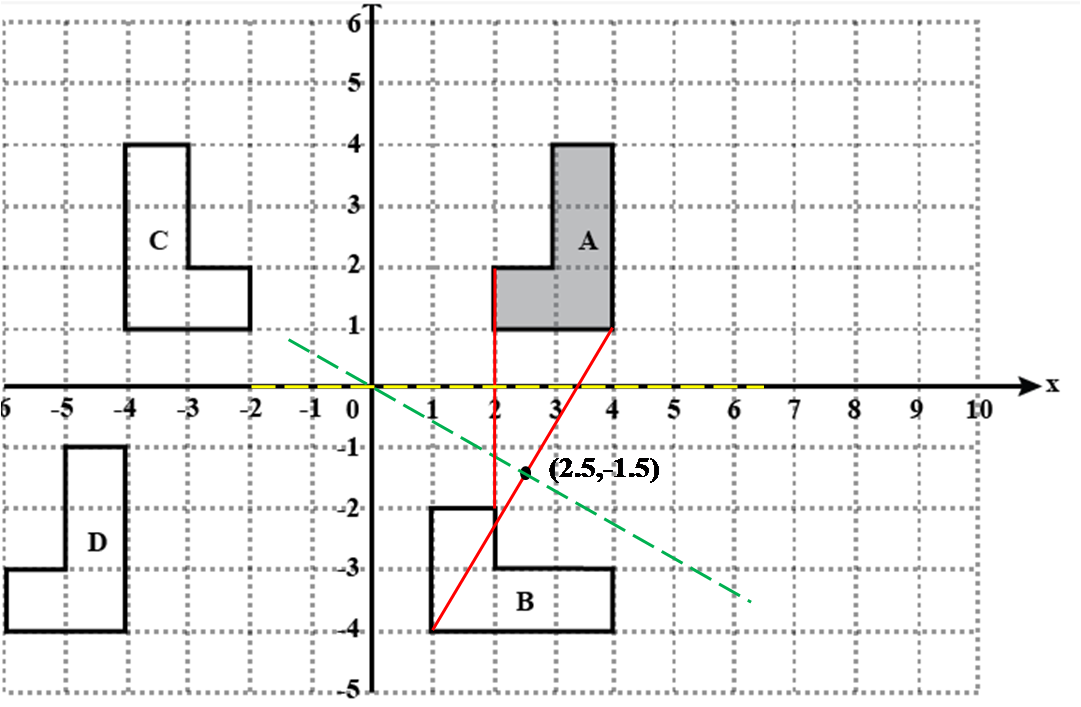
Reflect shape A in $$x-axis$$. Label the image shape B.
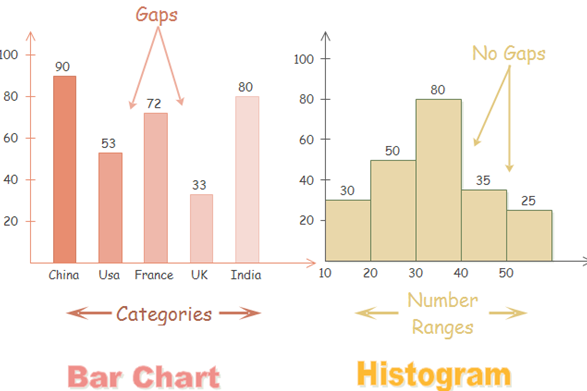
Write and draw the two difference between bar and histogram graph.
In a bar graph, the $$X$$-axis can represent anything, where as in a histogram it represents only a continuous data in the form of numbers.
How will you describe the position of a table lamp on your study table to another person
Plot the points (0, 0) (0, 3) (3, 4) (4, 0) in graph sheet. Join the points with straight lines to make a rectangle. Find the area of the rectangle.
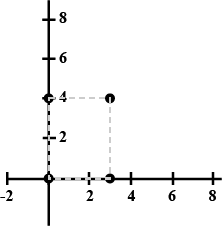
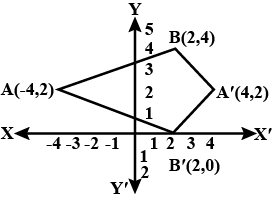
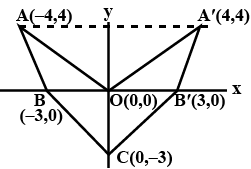
Using graph paper, (take $$2\ cm = 1$$ unit on both axis), plot $$A(-4,2)$$ and $$B(2,4)$$. $$A'$$ is the image of $$A$$ when reflected in the $$y$$-axis. Plot it on the graph paper and write the coordinates of $$A'$$. $$B'$$ is the image of $$B$$ when reflected about the line $$AA'$$. Join $$A-B-A'-B'$$ and name the quadrilateral.

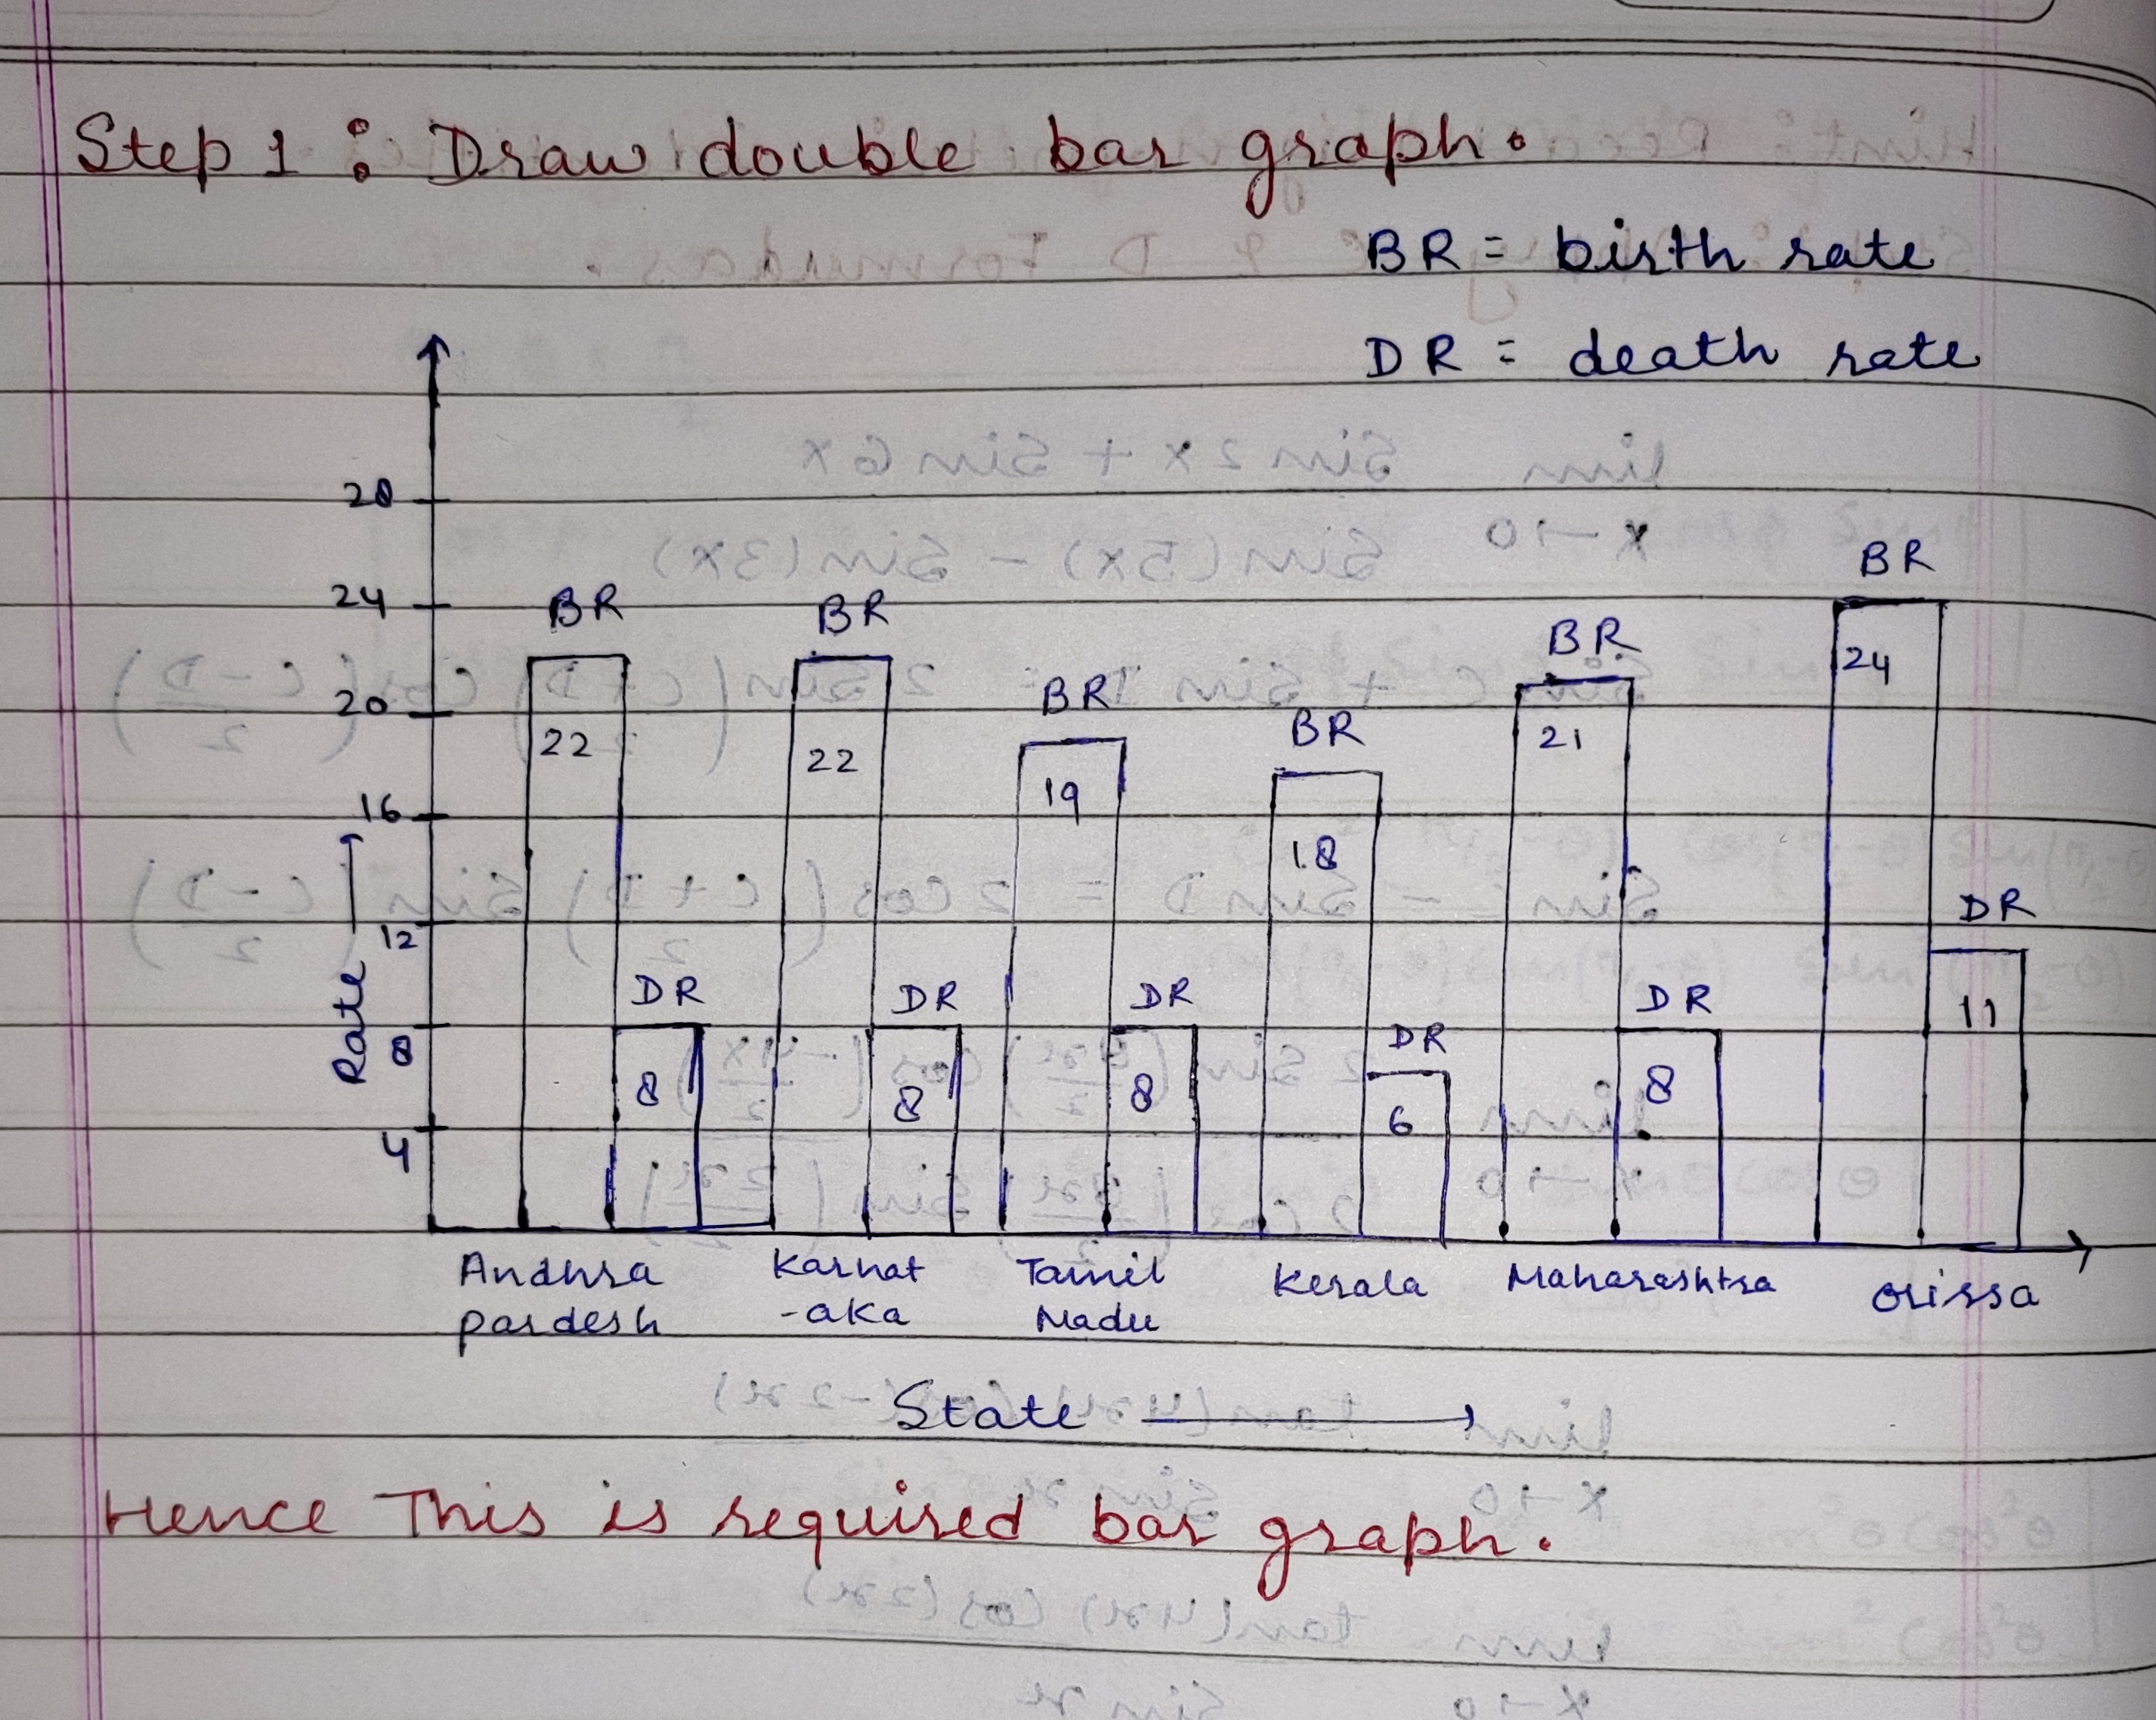
Draw a double bar graph for the following data.
Birth and Death rates of different states in 1999.
| State | Birth Rate (Per 1000) | Death Rate (Per 1000) |
| Andhra Pradesh | 22 | 8 |
| Karnataka | 22 | 8 |
| Tamil Nadu | 19 | 8 |
| Kerala | 18 | 6 |
| Maharashtra | 21 | 8 |
| Orissa | 24 | 11 |
Use graph paper for this question.
(Take $$2\ cm = 1$$ unit along both $$x$$ and $$y$$ axis).
Plot the point $$O(0, 0), A(-4, 4), B(-3, 0)$$ and $$C(0, -3)$$.Join the figure $$OABCB'A'$$.
Draw double bar graph for the following data
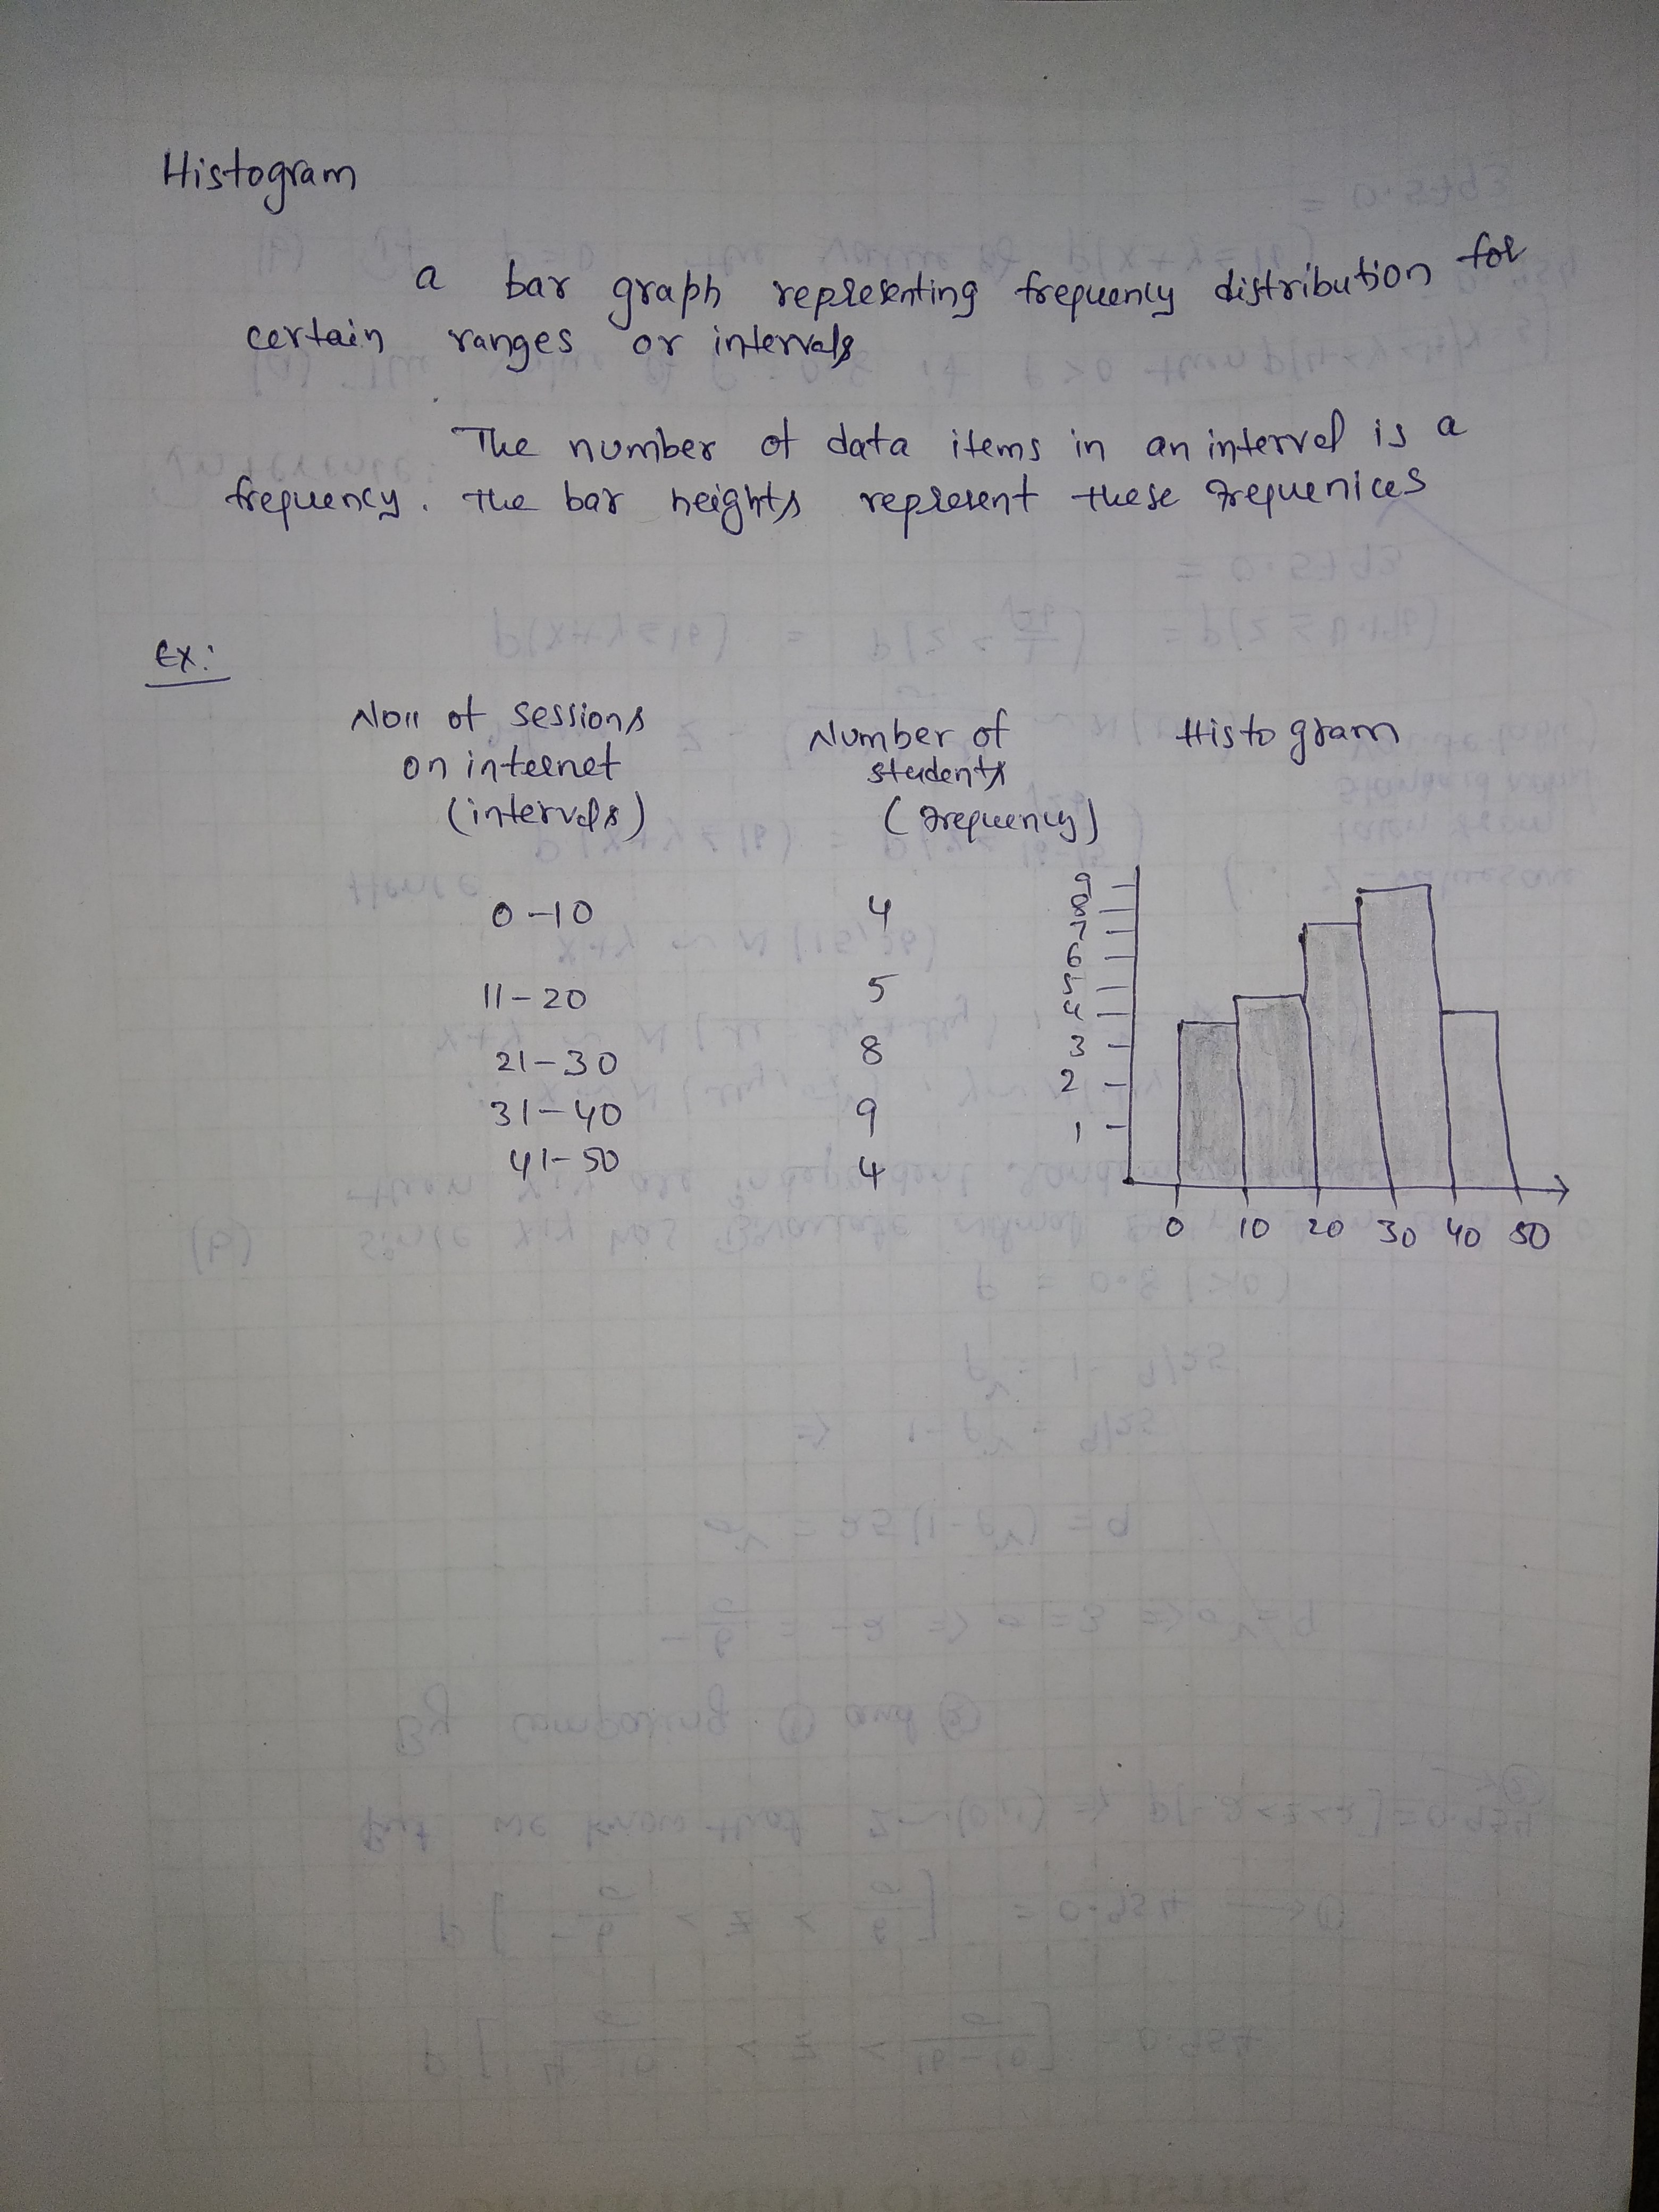
Define or explain the concepts:
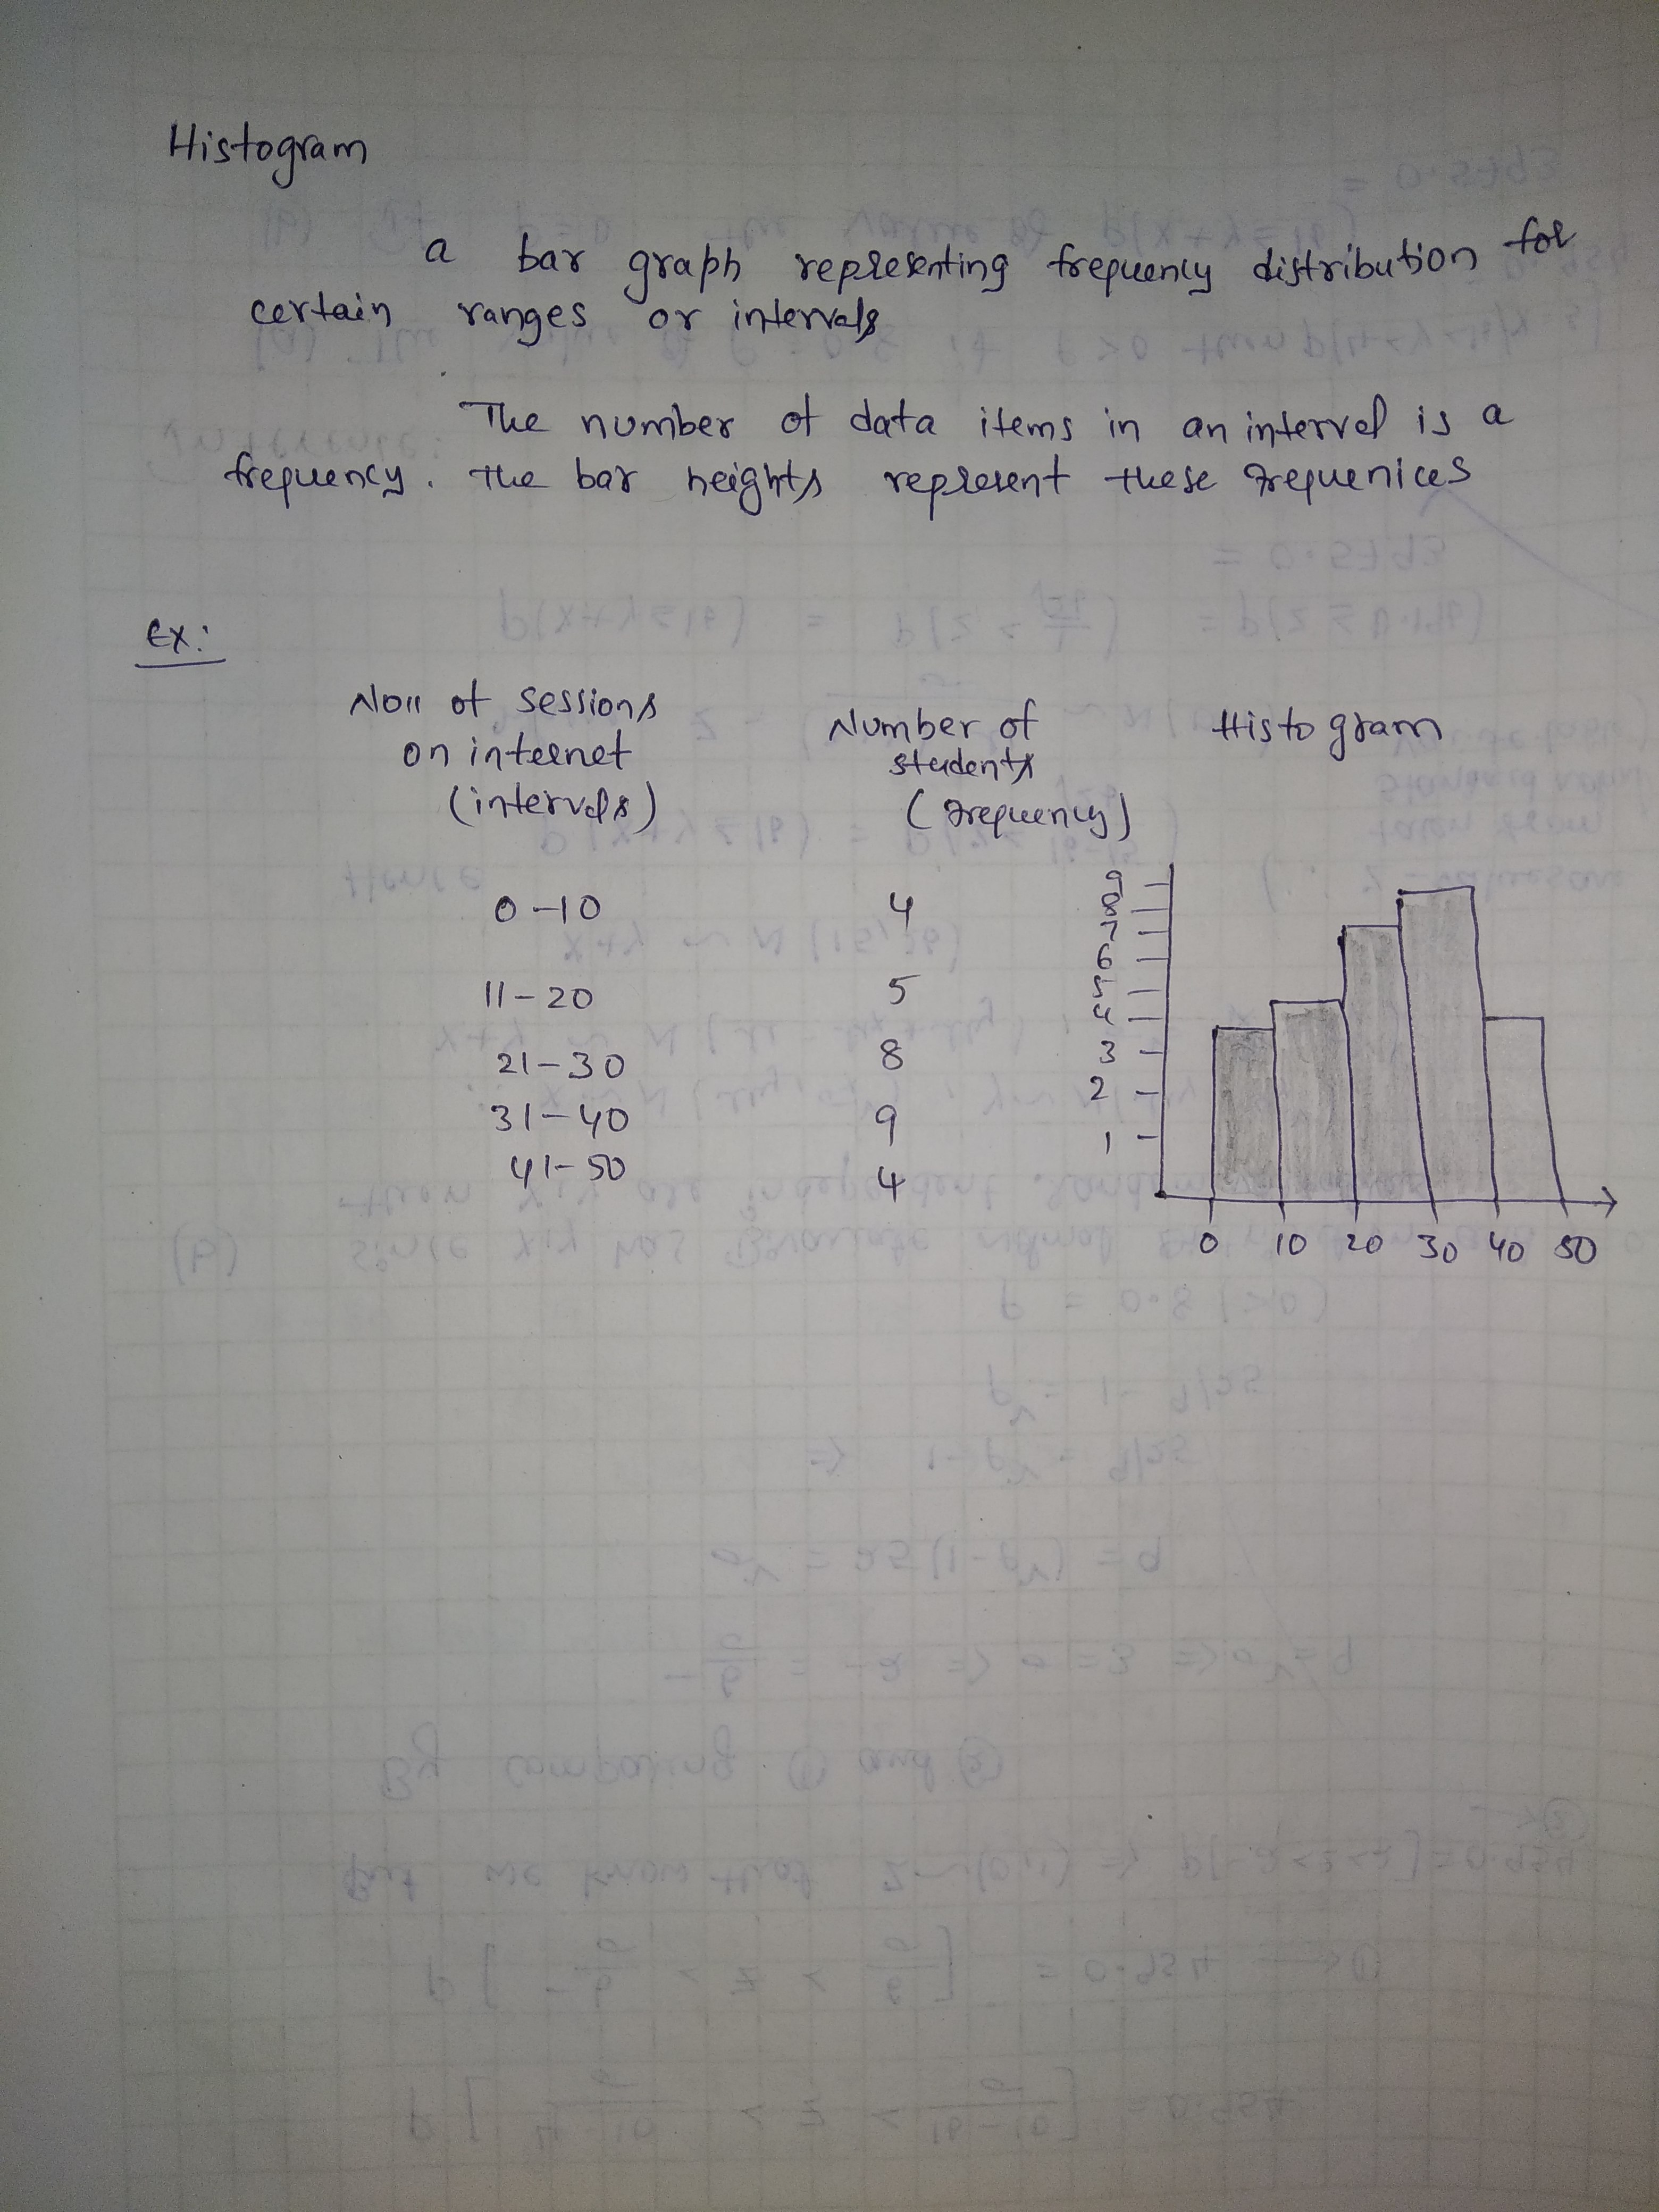
Histogram
Do you agree with the statement? Give reasons
There is a difference between Histogram and Frequency Polygon
Answer the Following :
What are the general principle of the construction of a diagram?
Define: Histogram
Give Reason :
A histogram is a two dimensional graph
Answer the Following :
Explain the techniques of drawing a Histogram.
- On the vertical axis, place frequencies. Label this axis "Frequency".
- On the horizontal axis, place the lower value of each interval. ...
- Draw a bar extending from the lower value of each interval to the lower value of the next interval.
Give Reason :
A histogram is not a diagram.
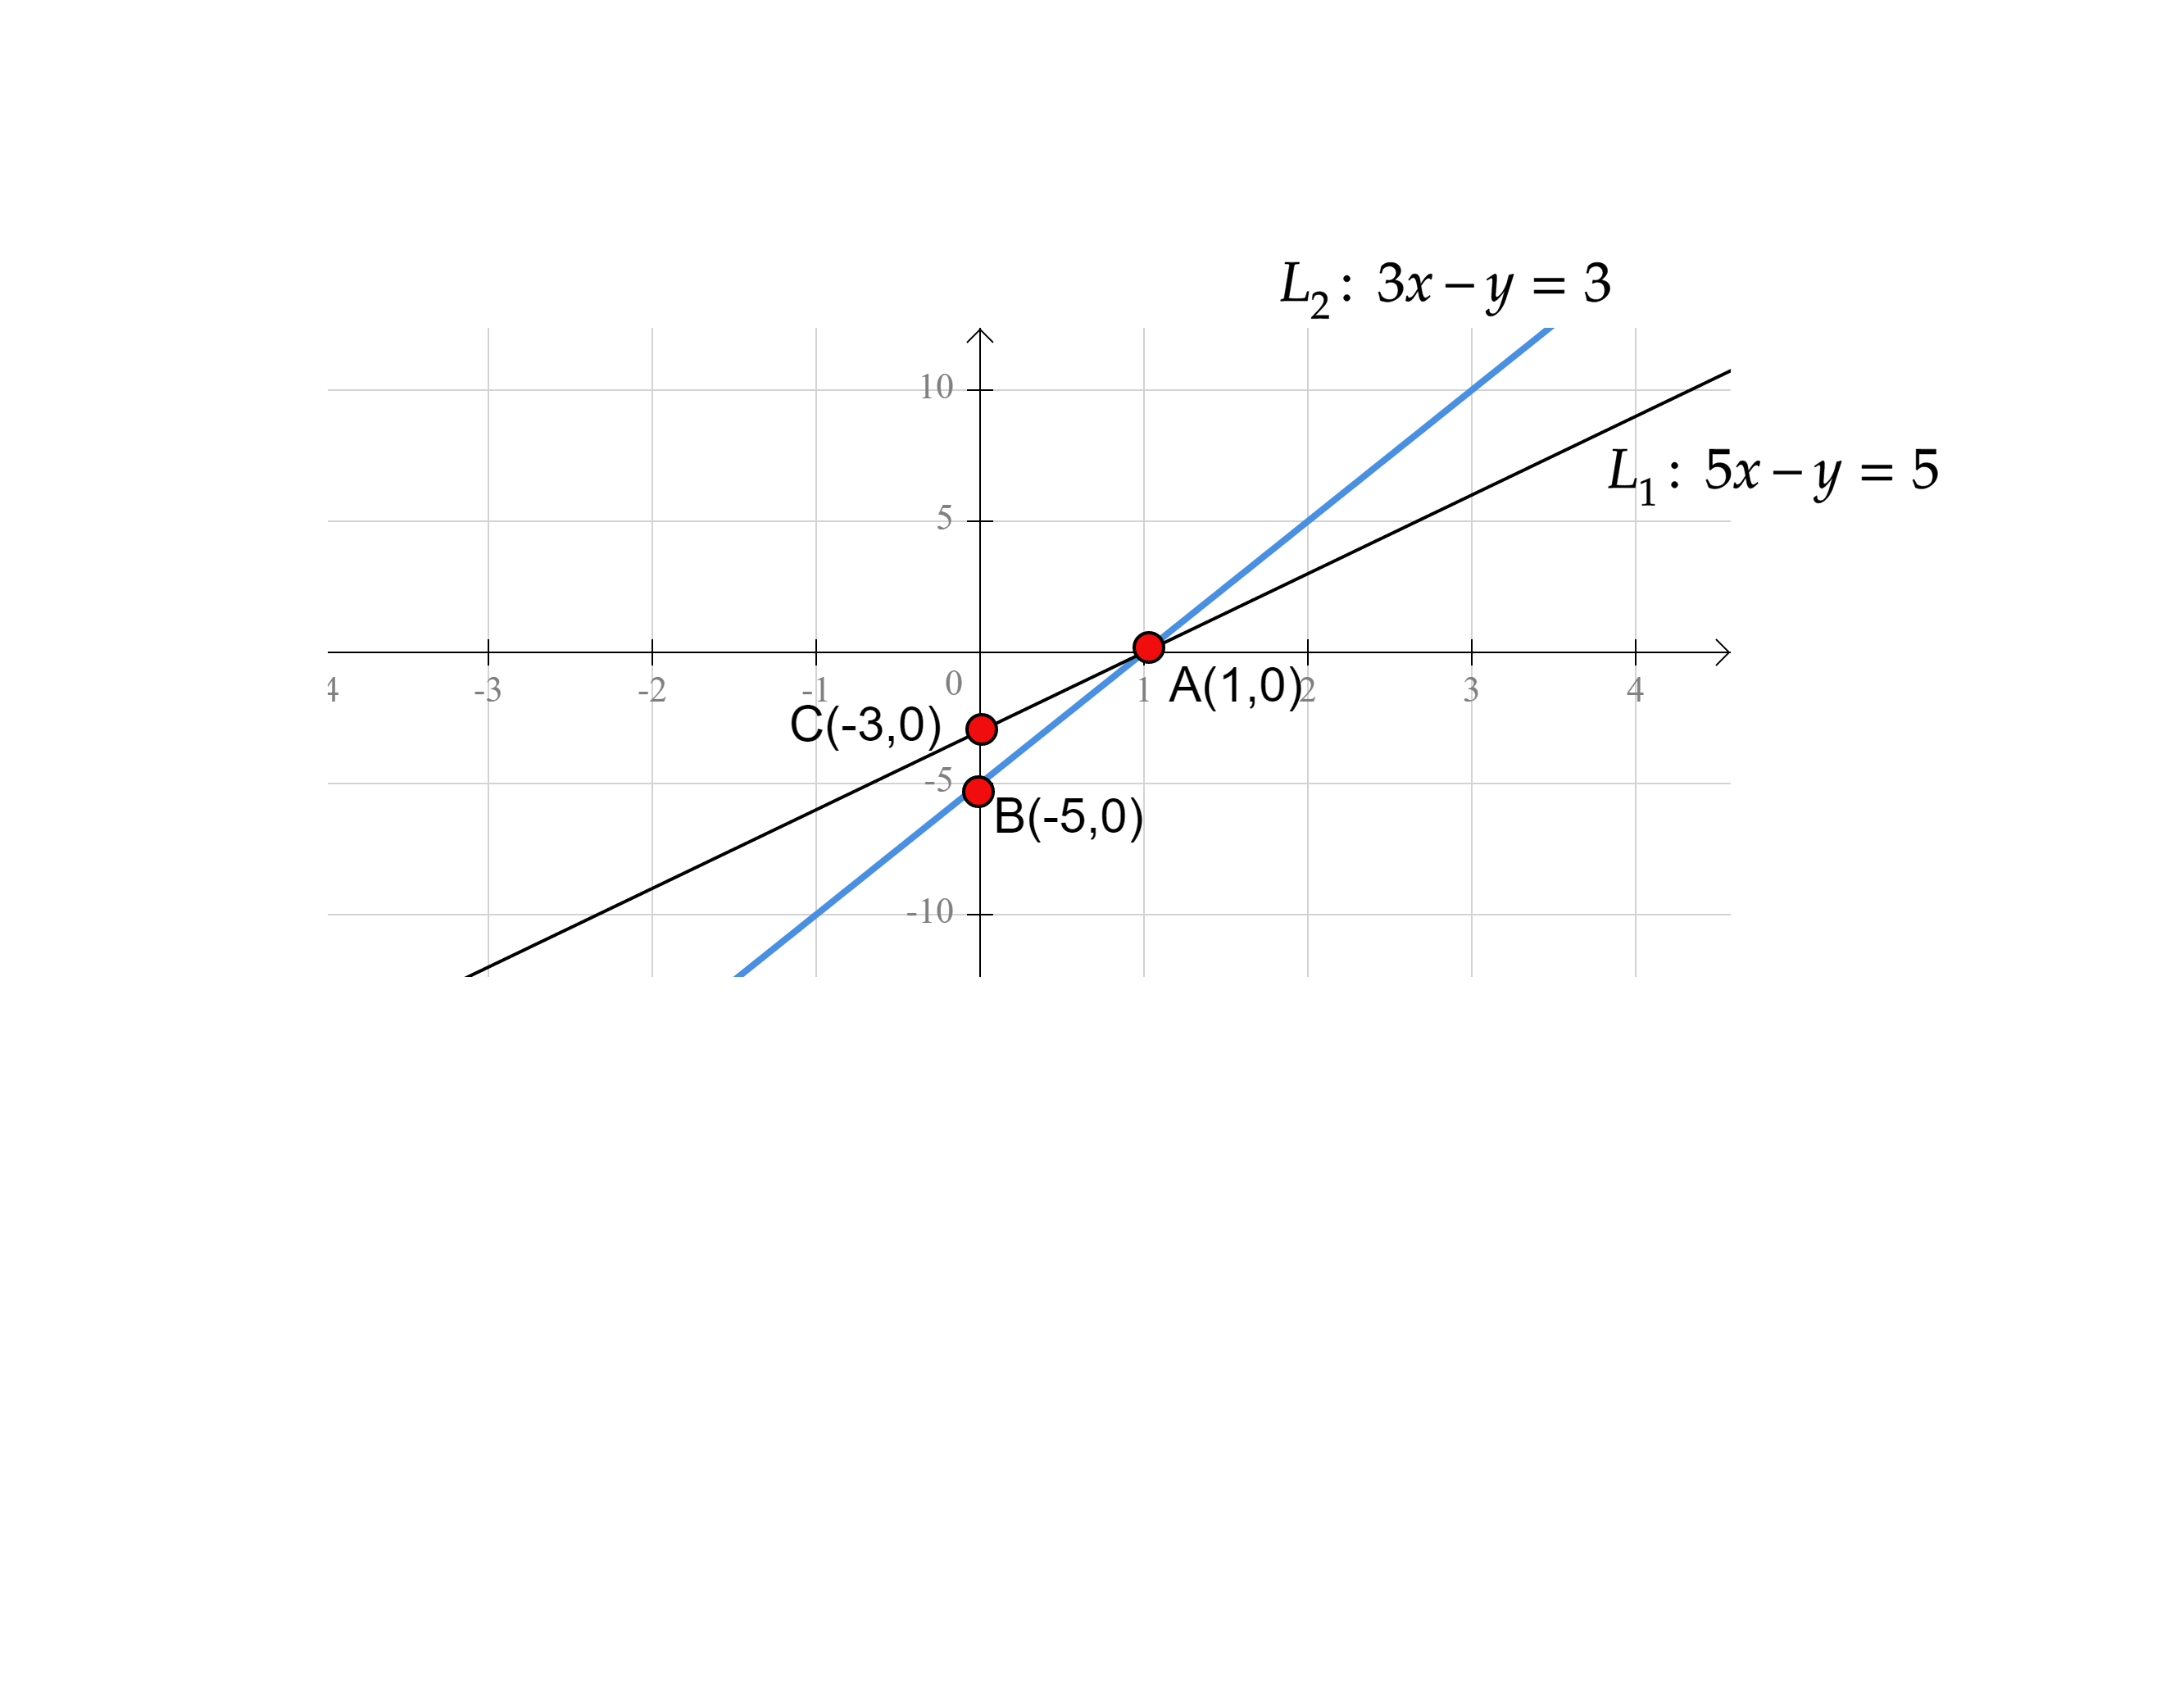
A Draw the graphs of the equations $$5x -y = 5$$ and $$3x - y =3$$. Determine the vertices of the triangle formed by these lines and the y-axis.
Find the value of p if the points$$(2, 1), (p, -1)$$ and $$ (-1, 3)$$ are collinear.
What is the ordinate of any point on $$x-$$axis?
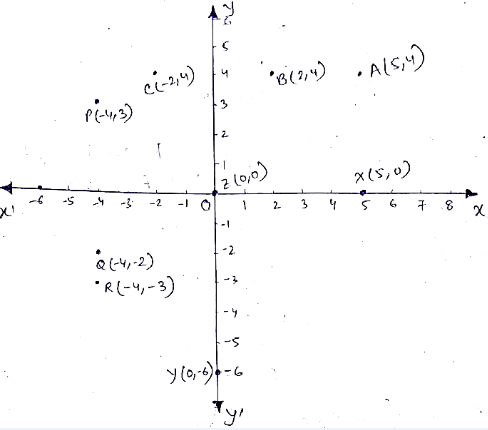
Plot following points on graph paper
$$A(5, 4)$$ $$B(2, 4)$$ $$C(-2, 4)$$ $$P(-4, 3)$$ $$Q(-4, -2)$$ $$R(-4, -3)$$ $$X(5, 0)$$ $$Y(0, -6)$$ $$Z(0, 0)$$
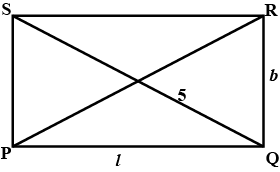
PQRS is a rectangle. If $$PQ + QR = 7$$ and $$ PR +QS = 10$$, then find the area of PQRS.
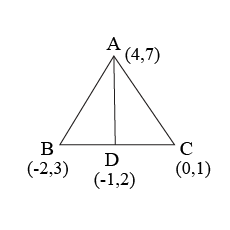
In a triangle $$ABC$$, the co-ordinates of vertices $$A,B$$ and $$C$$ are $$(4, 7)$$, $$(-2, 3)$$ and $$(0, 1)$$ respectively. find the equation of median through vertex $$A$$. Also, find the equation of the line through vertex $$B$$ and parallel to $$AC$$.
Give Reasons
A frequency polygon can be drawn with the help of a Histogram.
Answer the following:
Explain the technique of drawing a Histogram?
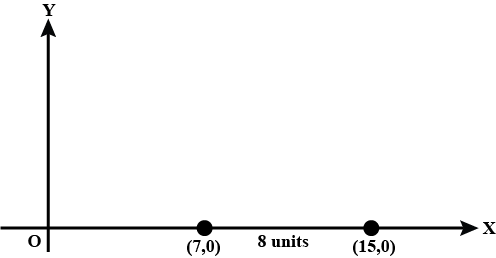
Co-ordinate of point P on a number line is Find the coordinate of point on the Number line which is at a distance of 8 units right to point P.
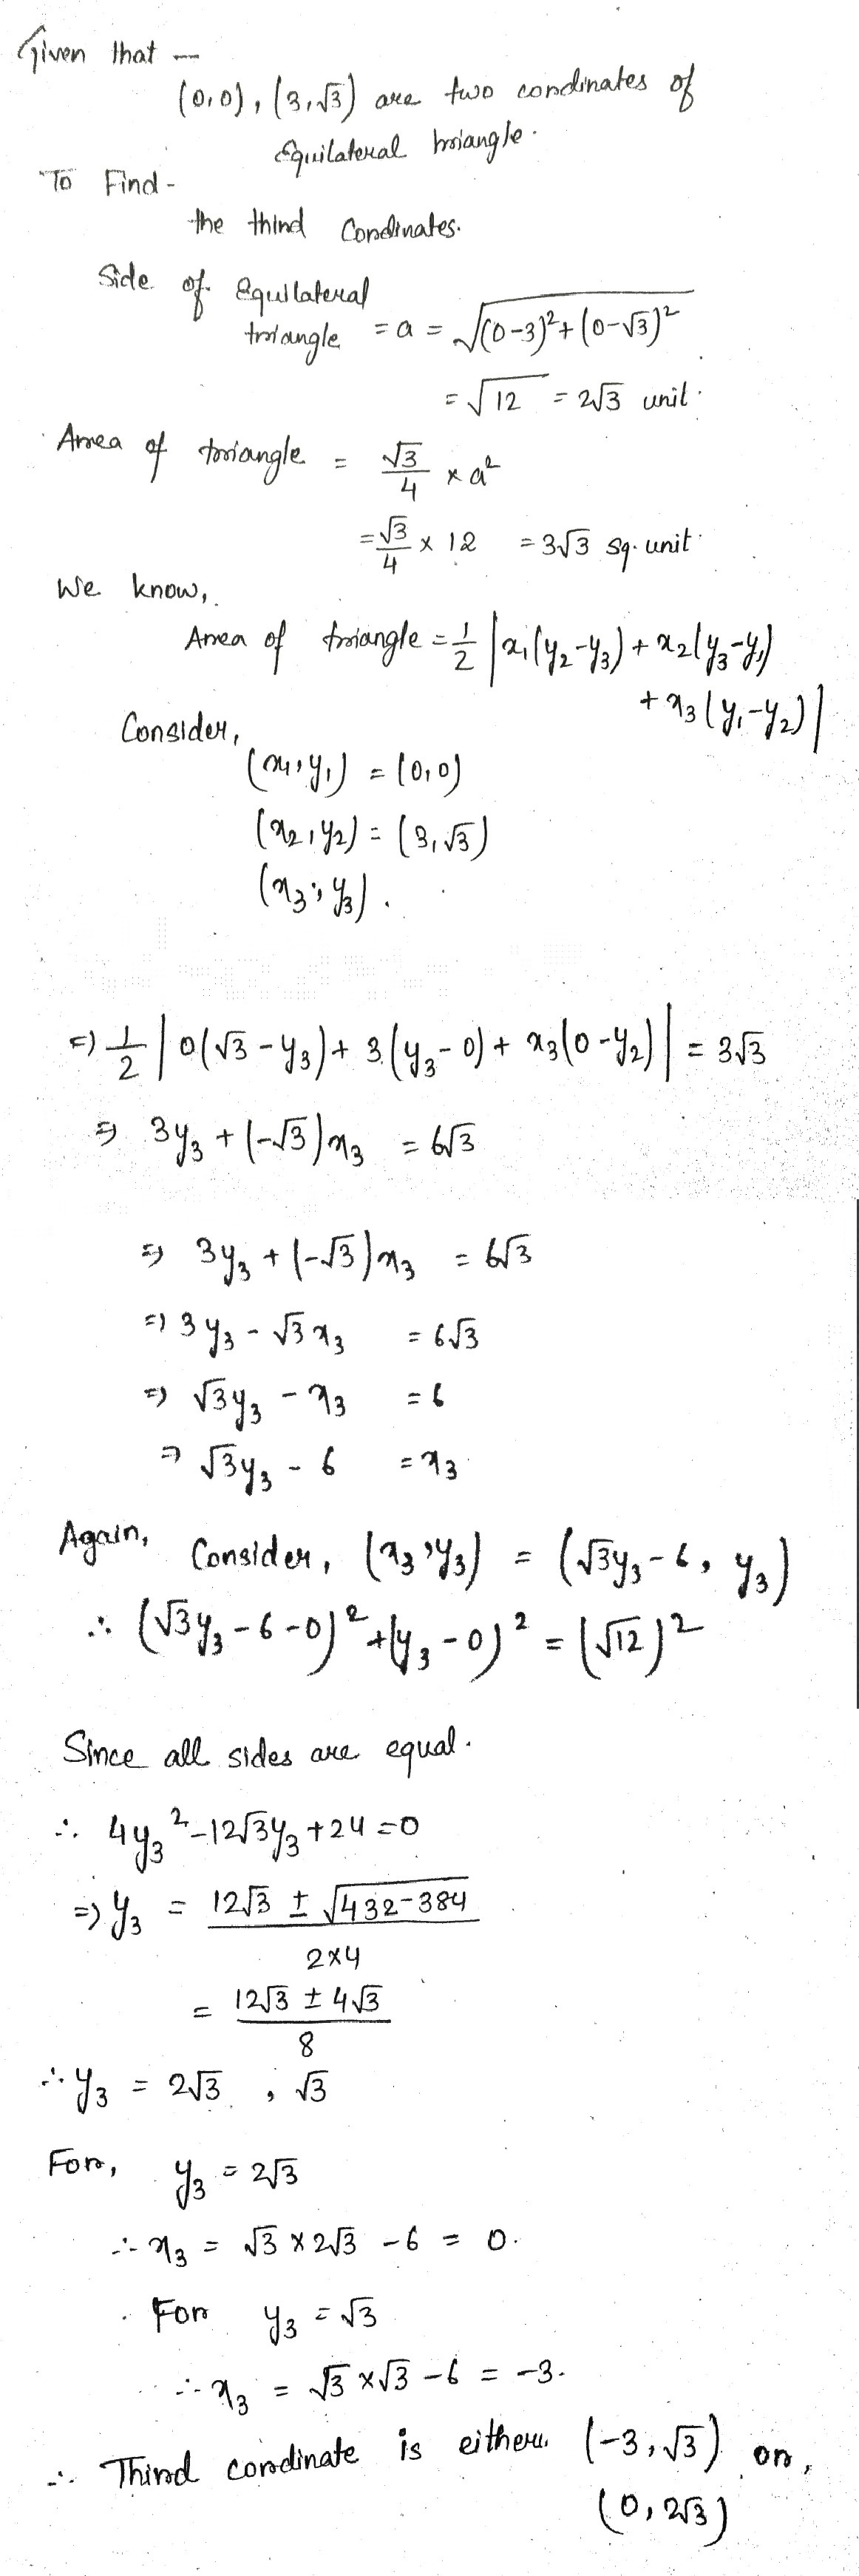
If the two vertices of an equilateral triangle be $$(0, 0)$$, $$(3, \sqrt{3})$$, find the third vertex.
Find the coordinates of the point on the X-axis which is at distant 5 units from A(4, 4).
The Cartesian system is named in the honour of which mathematician?
A circle $$S = 0$$ is drawn with its centre at $$(-1, 1)$$ so as to touch the circle $$x^2 + y^2 - 4x + 6y - 3 = 0$$ externally. Find the intercepts made by the circle $$S = 0$$ on the coordinate axes.
Find the co-ordinates of the point on the curve $$4y=x^{2}$$ which are nearest to the point $$(0,5)$$.
How many dimension does a surface has ?
Write the answer of each of the following questions:
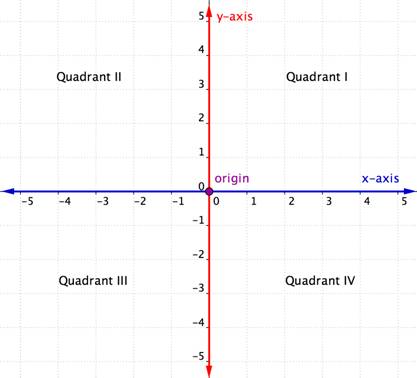
(i) What is the name of horizontal the vertical lines drawn to determine the position of any point in the Cartesian plane ?
(ii) What is the name of each part of the plane formed by these two lines.(iii) What is the point of intersection these lines called?
1.The horizontal line is known as $$x-axis$$ and the vertical line is known as $$y-axis.$$
2. These parts are known as: $$1st, 2nd, 3rd$$ and $$4th$$ quadrants.
3. When these two lines intersect, it is known as intersecting point and also this is the origin point i.e $$(x,y) = (0,0)$$
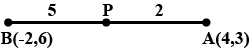
$$P$$ is a point on the line joining $$A(4,3)$$ and $$B(-2,6)$$ such that $$5AP=2BP$$. Find the coordinates of $$P$$.
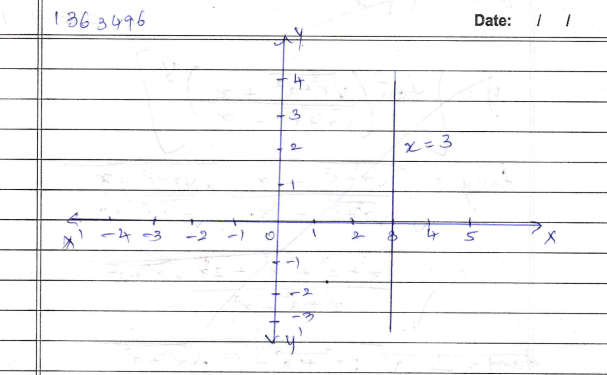
Constuct a graph of $$x=3$$
| $$x$$ | $$3$$ | $$3$$ | $$3$$ | $$3$$ | $$3$$ | $$3$$ | $$3$$ | $$3$$ | $$3$$ |
| $$y$$ | $$-4$$ | $$-3$$ | $$-2$$ | $$-1$$ | $$0$$ | $$1$$ | $$2$$ | $$3$$ | $$4$$ |
Find the coordinates of point $$P$$ if $$P$$ divides the lines segment joining the point $$A\left( -1,7 \right) $$ and $$B\left( 4,-3 \right) $$ in the ratio $$2 : 3$$
If the three vertices of a parallelogram are $$\left(-1,-3\right),\left(-2,-4\right)$$ and $$\left(3,5\right)$$,find the fourth vertex.
For which of these would you use a histogram to show the data.
The number of letters for different areas in a postman's bag.
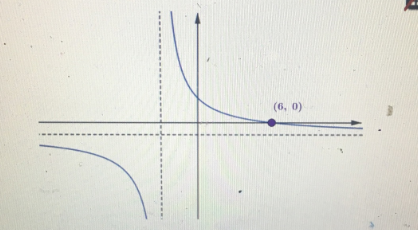
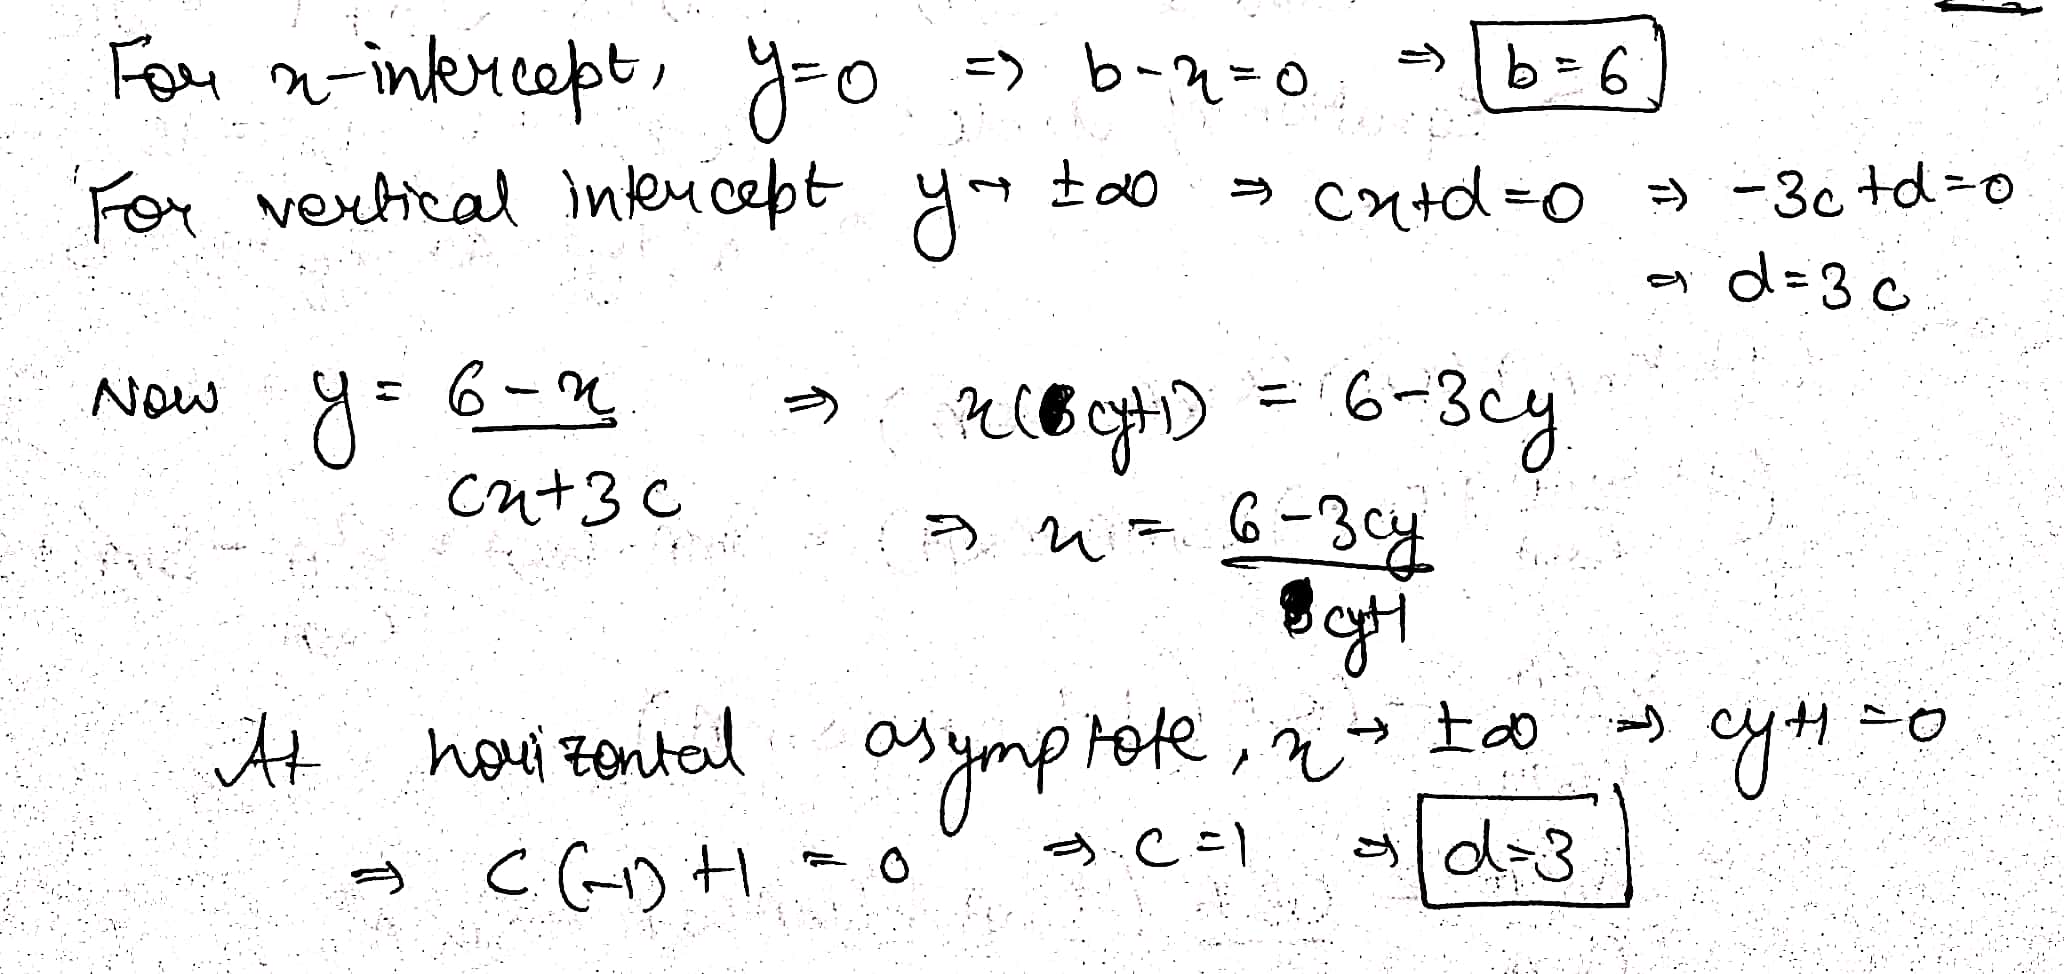
The diagram below shows part of the graph of $$y=\dfrac {b-x}{cx+d}$$
The $$x$$ intercept is $$(6,0)$$
The vertical asymptote is $$x=-3$$
The horizontal asymptote is $$y=-1$$
Find the value of $$d$$.
A Straight line through p(-15, -10), meets the straight line x - y -1 = 0, x + 2y = 5 and x + 3y = 7 respectively at A,B and C. If $$\dfrac { 12 }{ PA } +\dfrac { 40 }{ PB } =\dfrac { 52 }{ PC } ,$$ then prove that the straight line passes through origin.
Find the values of $$x$$ and $$y$$ if $$\left(x+4,\,3y-2\right)=\left(7,\,-5\right)$$
The centre of a circle is $$C\left(2,6\right)$$ and one end of a diameter is $$A\left(3,5\right)$$, find the coordinates of the other end.
If $$\left( x+\dfrac { 1 }{ 3 } ,\dfrac { y }{ 2 } -1 \right) =\left( \dfrac { 1 }{ 2 } ,\dfrac { 3 }{ 2 } \right)$$ find x and y.
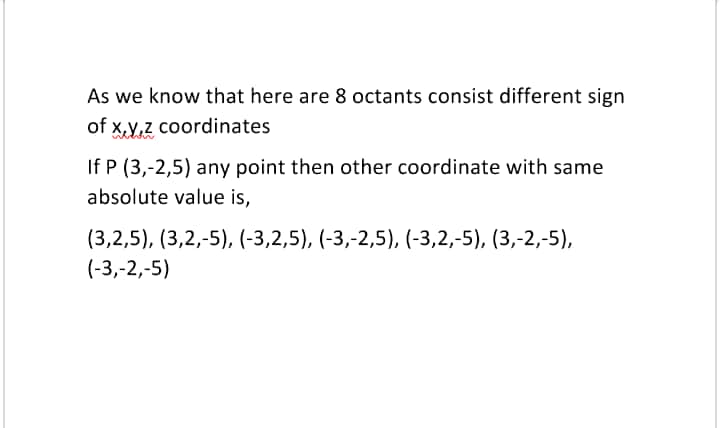
The coordinates of a point are $$(3,-2,5)$$. Write down the coordinates of seven points such that the absolute values of their coordinates are the same as those of the coordinates of the given point
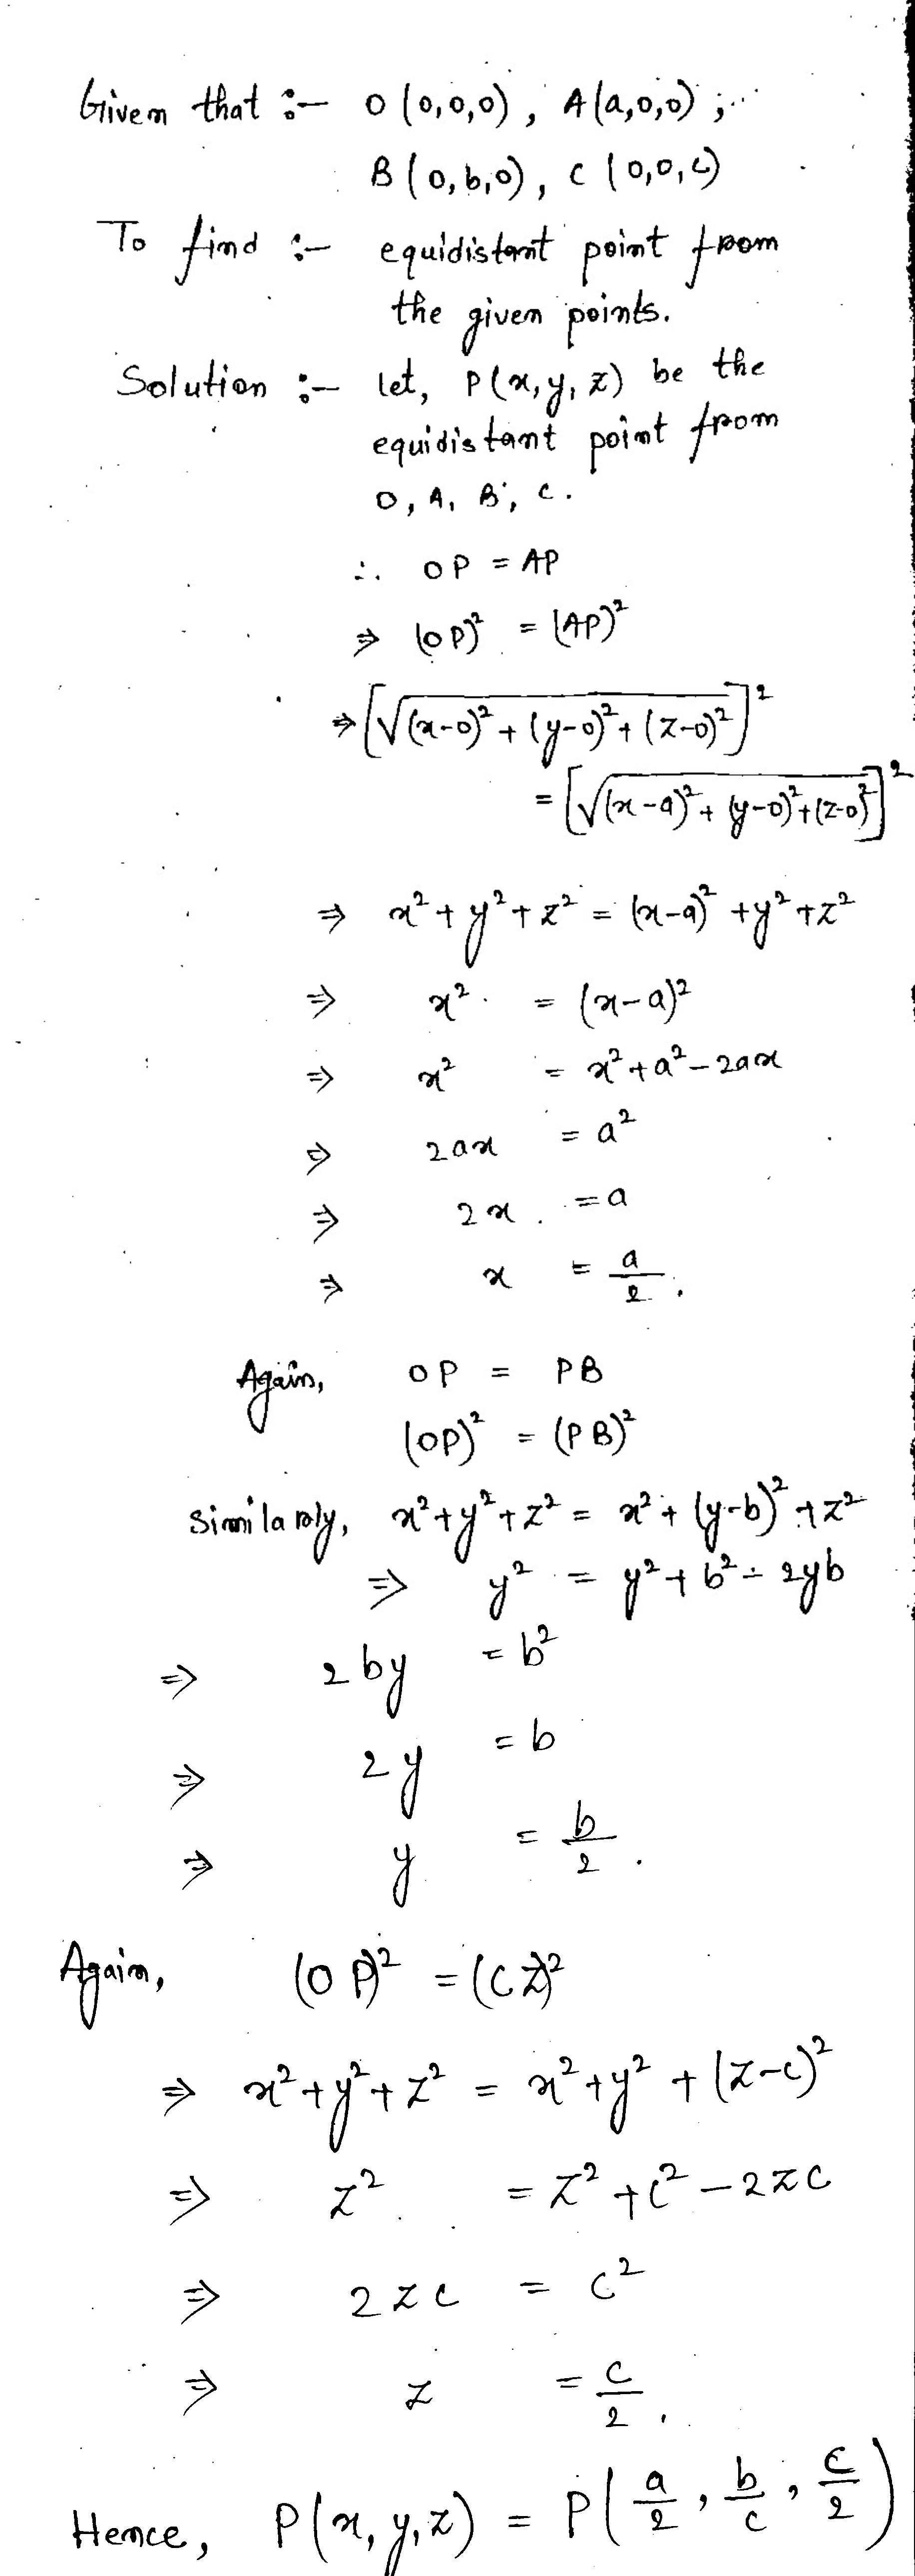
Find the coordinate of the point which is equidistant from the points $$O (0, 0, 0), A (a, 0, 0), B(0, b, 0)$$ and $$C(0, 0, c)$$.
Show that the points $$A(1,2,3),B(-1,-2,-1),C(2,3,2)$$ and $$D(4,7,6)$$ are the vertices of a parallelogram $$ABCD$$ but not a rectangle.
Distance between A(1, 2, 3) and B(-1, -2, -1) is AB,
![]()
![]()
![]()
![]() $$= 6$$
$$= 6$$
Distance between B(-1, -2, -1) and C(2, 3, 2) is BC,
![]()
![]()
![]()
![]()
Distance between C(2, 3, 2) and D(4, 7, 6) is CD,
![]()
![]()
![]()
![]() $$= 6$$
$$= 6$$
The distance between A(1, 2, 3) and D(4, 7, 6) is AD,
![]()
![]()
![]()
![]()
Clearly, $$AB=CD$$ and $$BC=AD$$
Opposite sides are equal
Now, we will find the length of diagonals
The distance between A(1, 2, 3) and C(2, 3, 2) is AC,
![]()
![]()
![]()
![]()
Distance between B(-1, -2, -1) and D(4, 7, 6) is BD,
![]()
![]()
![]()
![]()
Clearly, $$AC \neq BD$$
The diagonals are not equal, but opposite sides are equal
Thus, Quadrilateral formed by ABCD is a parallelogram but not a rectangle
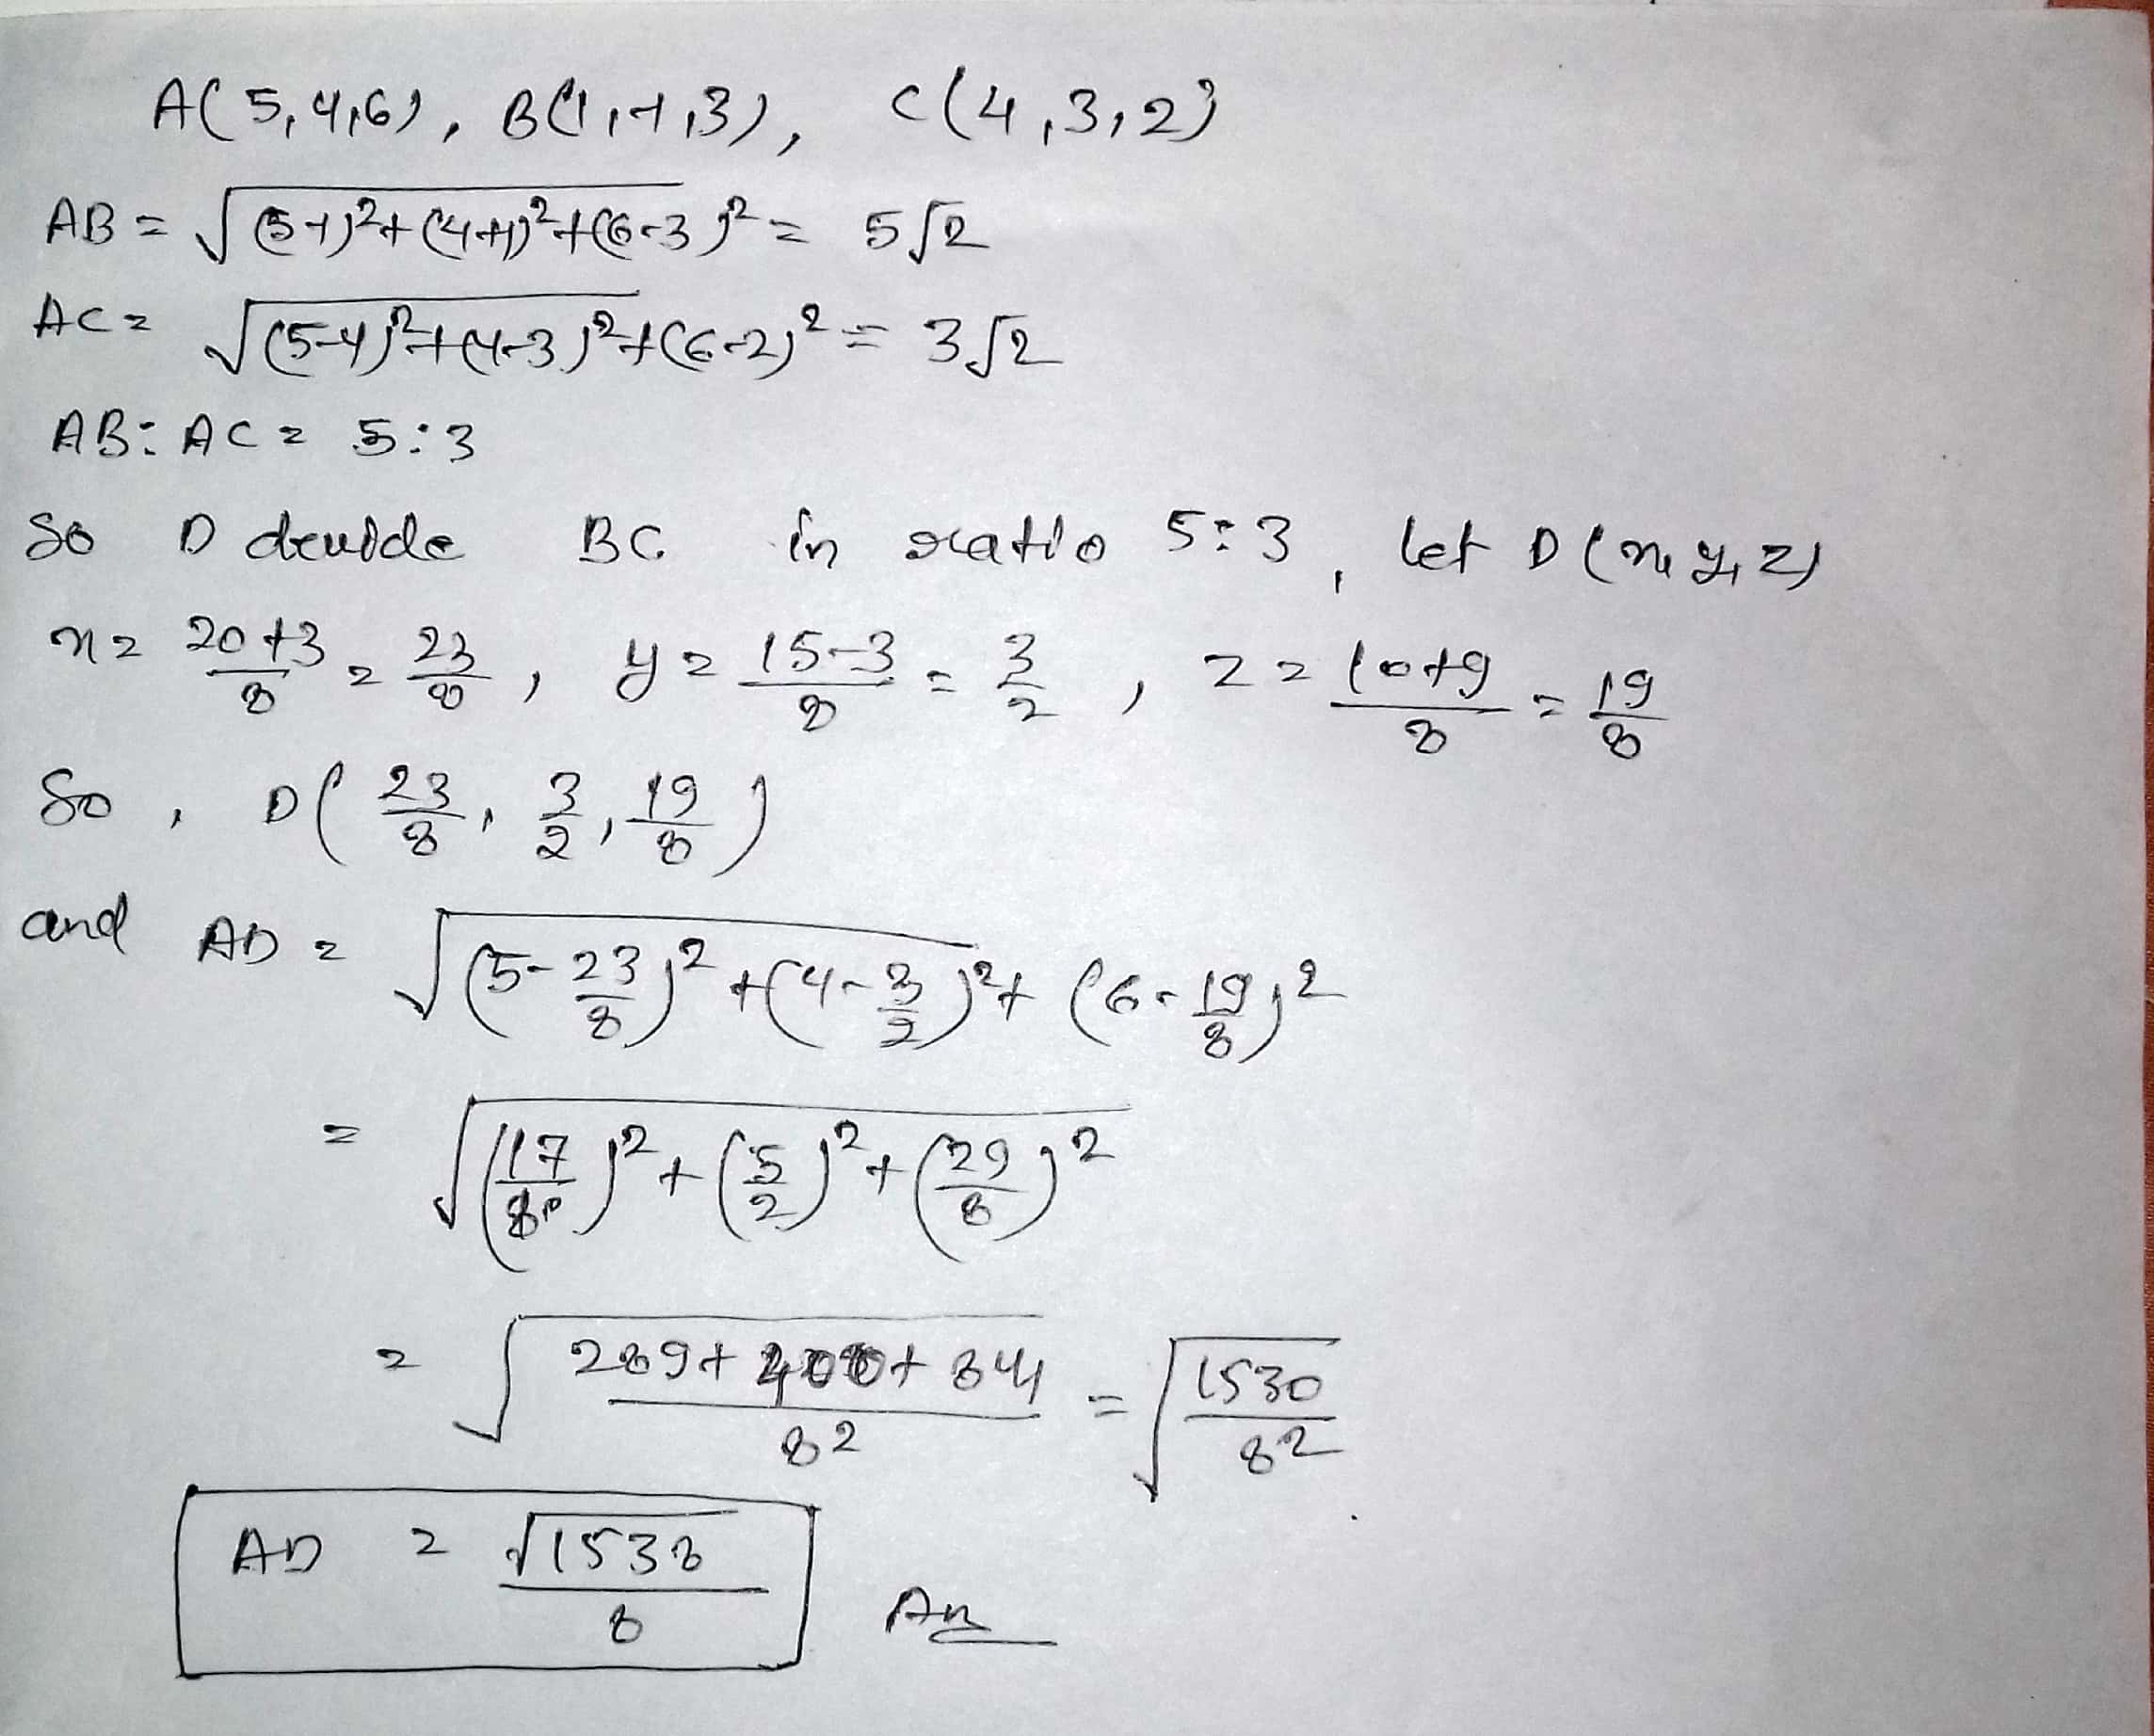
The vertices of the triangle are $$A(5,4,6),B(1,-1,3)$$ and $$C(4,3,2)$$. The internal bisector of angle $$A$$ meets $$BC$$ at $$D$$. Find the coordinates of $$D$$ and the length $$AD$$.
Prove that the tetrahedron with vertices at the points $$O(0,0,0),A(0,1,1),B(1,0,1)$$ and $$C(1,1,0)$$ is a regular one.
The distance between any two points $$(a, b, c)$$ and $$(m, n, o)$$ is given by,
![]()
Therefore,
Distance between O(0, 0, 0) and A(0, 1, 1) is
$$OA$$![]()
![]()
![]()
![]()
Distance between O(0, 0, 0) and B(1, 0, 1) is OB,
![]()
![]()
![]()
![]()
Distance between O(0, 0, 0) and C(1, 1, 0) is
$$OC$$ ![]()
![]()
![]()
![]()
Distance between A(0, 1, 1) and B(1, 0, 1) is
$$AB$$ ![]()
![]()
![]()
![]()
Distance between B(1, 0, 1) and C(1, 1, 0) is
$$BC$$![]()
![]()
![]()
![]()
Distance between A(0, 1, 1) and C(1, 1, 0) is
$$AC$$![]()
![]()
![]()
![]()
Clearly,
$$AB = BC = AC = OA = OB = OC$$
All edges are equal,
Hence Proved
Find the co-ordinate of the fourth vertex $$D$$ of the parallelogram $$ABCD$$, if three of its vertices are $$A(5, 6), B (1, -2)$$ and $$C(3, -2)$$.
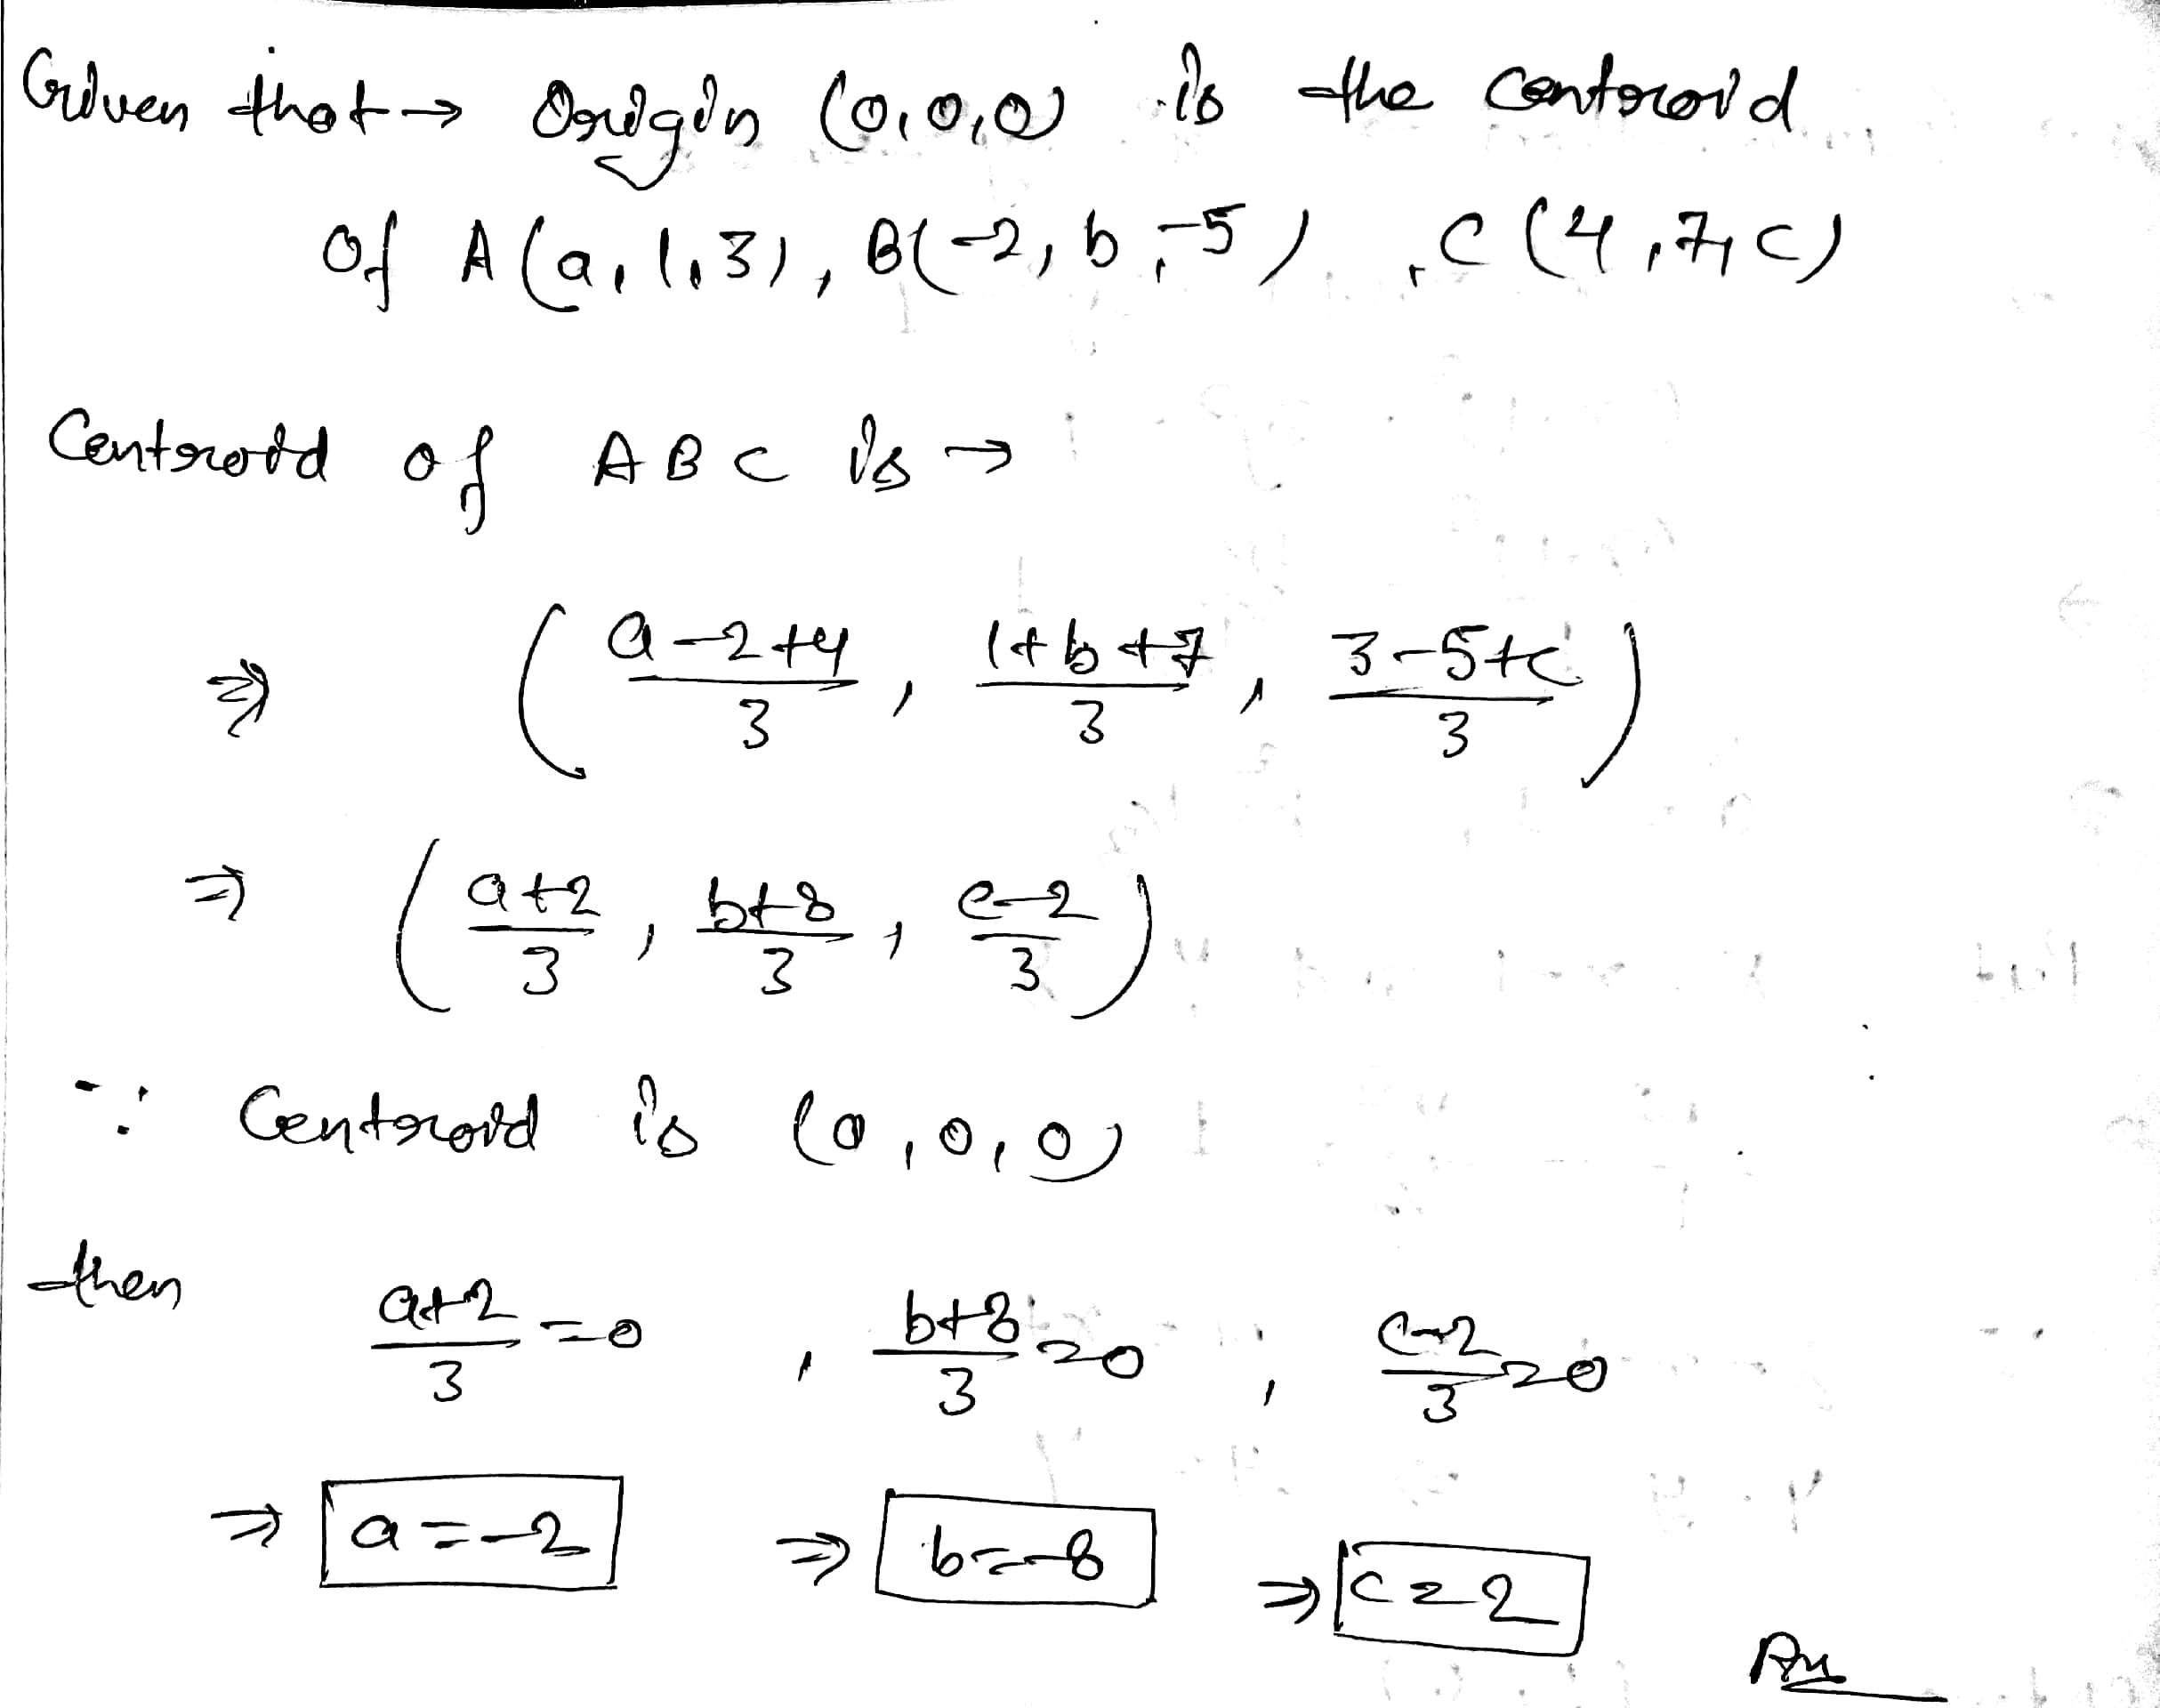
If the origin is the centroid of a triangle $$ABC$$ having vertices $$A(a,1,3),B(-2,b,-5)$$ and $$C(4,7,c)$$, find the values of $$a,b,c$$
Show that the points $$A(5,-1,1),(7,-4,7),C(1,-6,10)$$ and $$D(-1,-3,4)$$ are the vertices of a rhombus.
The distance between any two points (a, b, c) and (m, n, o) is given by,
![]()
Therefore,
Distance between A(5, -1, 1) and B(7, -4, 7) is AB,
![]()
![]()
![]()
![]() = 7
= 7
Distance between B(7, -4, 7) and C(1, -6, 10) is BC,
![]()
![]()
![]()
![]() = 7
= 7
Distance between C(1, -6, 10) and D(-1, -3, 4) is CD,
![]()
![]()
![]()
![]() = 7
= 7
Distance between A(5, -1, 1) and D(-1, -3, 4) is AD,
![]()
![]()
![]()
![]() = 7
= 7
Clearly,
$$AB = BC = CD = AD$$
Now, we will find length of diagonals
Distance between A(5, -1, 1) and C(1, -6, 10) is AC,
![]()
![]()
![]()
![]()
Distance between B(7, -4, 7) and D(-1, -3, 4) is BD,
![]()
![]()
![]()
![]()
Clearly, $$AC \neq BD$$
The diagonals are not equal, but all sides are equal
Thus, Quadrilateral formed by ABCD is a rhombus
Hence Proved
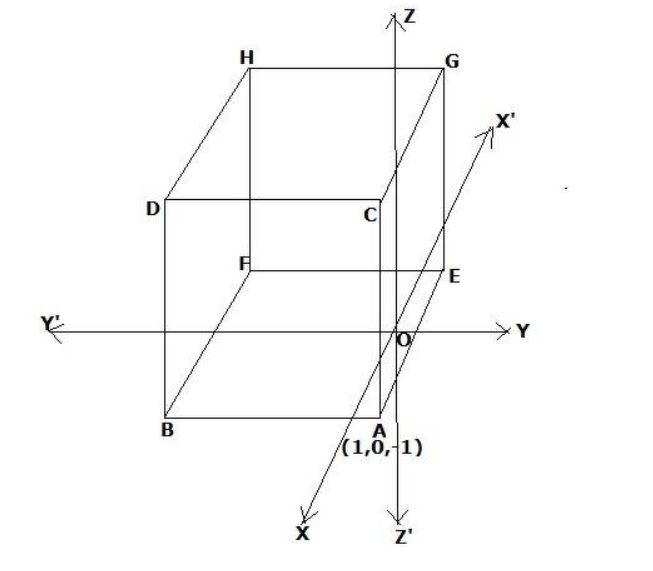
A cube of side $$5$$ has one vertex at the point $$(1,0,-1)$$ and the three edges from this vertex are, respectively, parallel to the negative $$x$$ and $$y$$ axes and positive z-axis. Find the coordinates of the other vertices of the cube.
We are given that the edges are parallel to neagtive $$X$$ and $$Y$$ axes, and the side of the cube is $$5$$ units.
Also, $$AB$$ is the line parallel to the $$Y-$$ axis, and hence the $$x$$ and $$z$$ coordinates of any point on the line $$AB$$ are constant.
The Coordinates of $$A:\ \ A(1,0,-1)$$
Therefore, the coordinates of $$B:\ \ B(1,5,-1)$$
$$AC$$ is the line parallel to $$Z$$ axis, and hence the $$x$$ and $$y$$ coordinates of any point on the line $$AC$$ are constant.
The Coordinates of $$A:\ \ A(1,0,-1)$$
Thus the coordinates of $$C:\ \ C(1,0,4)$$
$$AE$$ is the line parallel to $$X$$ axis, and hence the $$y$$ and $$z$$ coordinates of any point on the line $$AE$$ are constant.
The coordinates of $$A:\ \ A(1,0,-1)$$
Thus the coordinates of $$E:\ \ E(-4,0,-1)$$
$$GE$$ is the line parallel to $$Z$$ axis, and hence the $$x$$ and $$y$$ coordinates of any point on the line $$GE$$ are constant.
The coordinates of $$E:\ \ E(-4,0,-1)$$
Thus the coordinates of $$G:\ \ G(-4,0,4)$$
$$EF$$ is the line parallel to $$Y$$ axis, and hence the $$x$$ and $$z$$ coordinates of any point on the line $$EF$$ are constant.
The coordinates of $$E:\ \ E(-4,0,-1)$$
Thus the coordinates of $$F:\ \ F(-4,-5,-1)$$
$$GH$$ is the line parallel to $$Y$$ axis, and hence the $$x$$ and $$z$$ coordinates of any point on the line $$GH$$ are constant.
The coordinates of $$G:\ \ G(-4,0,4)$$
Thus the coordinates of $$H:\ \ H(-4,-5,4)$$
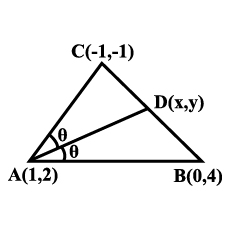
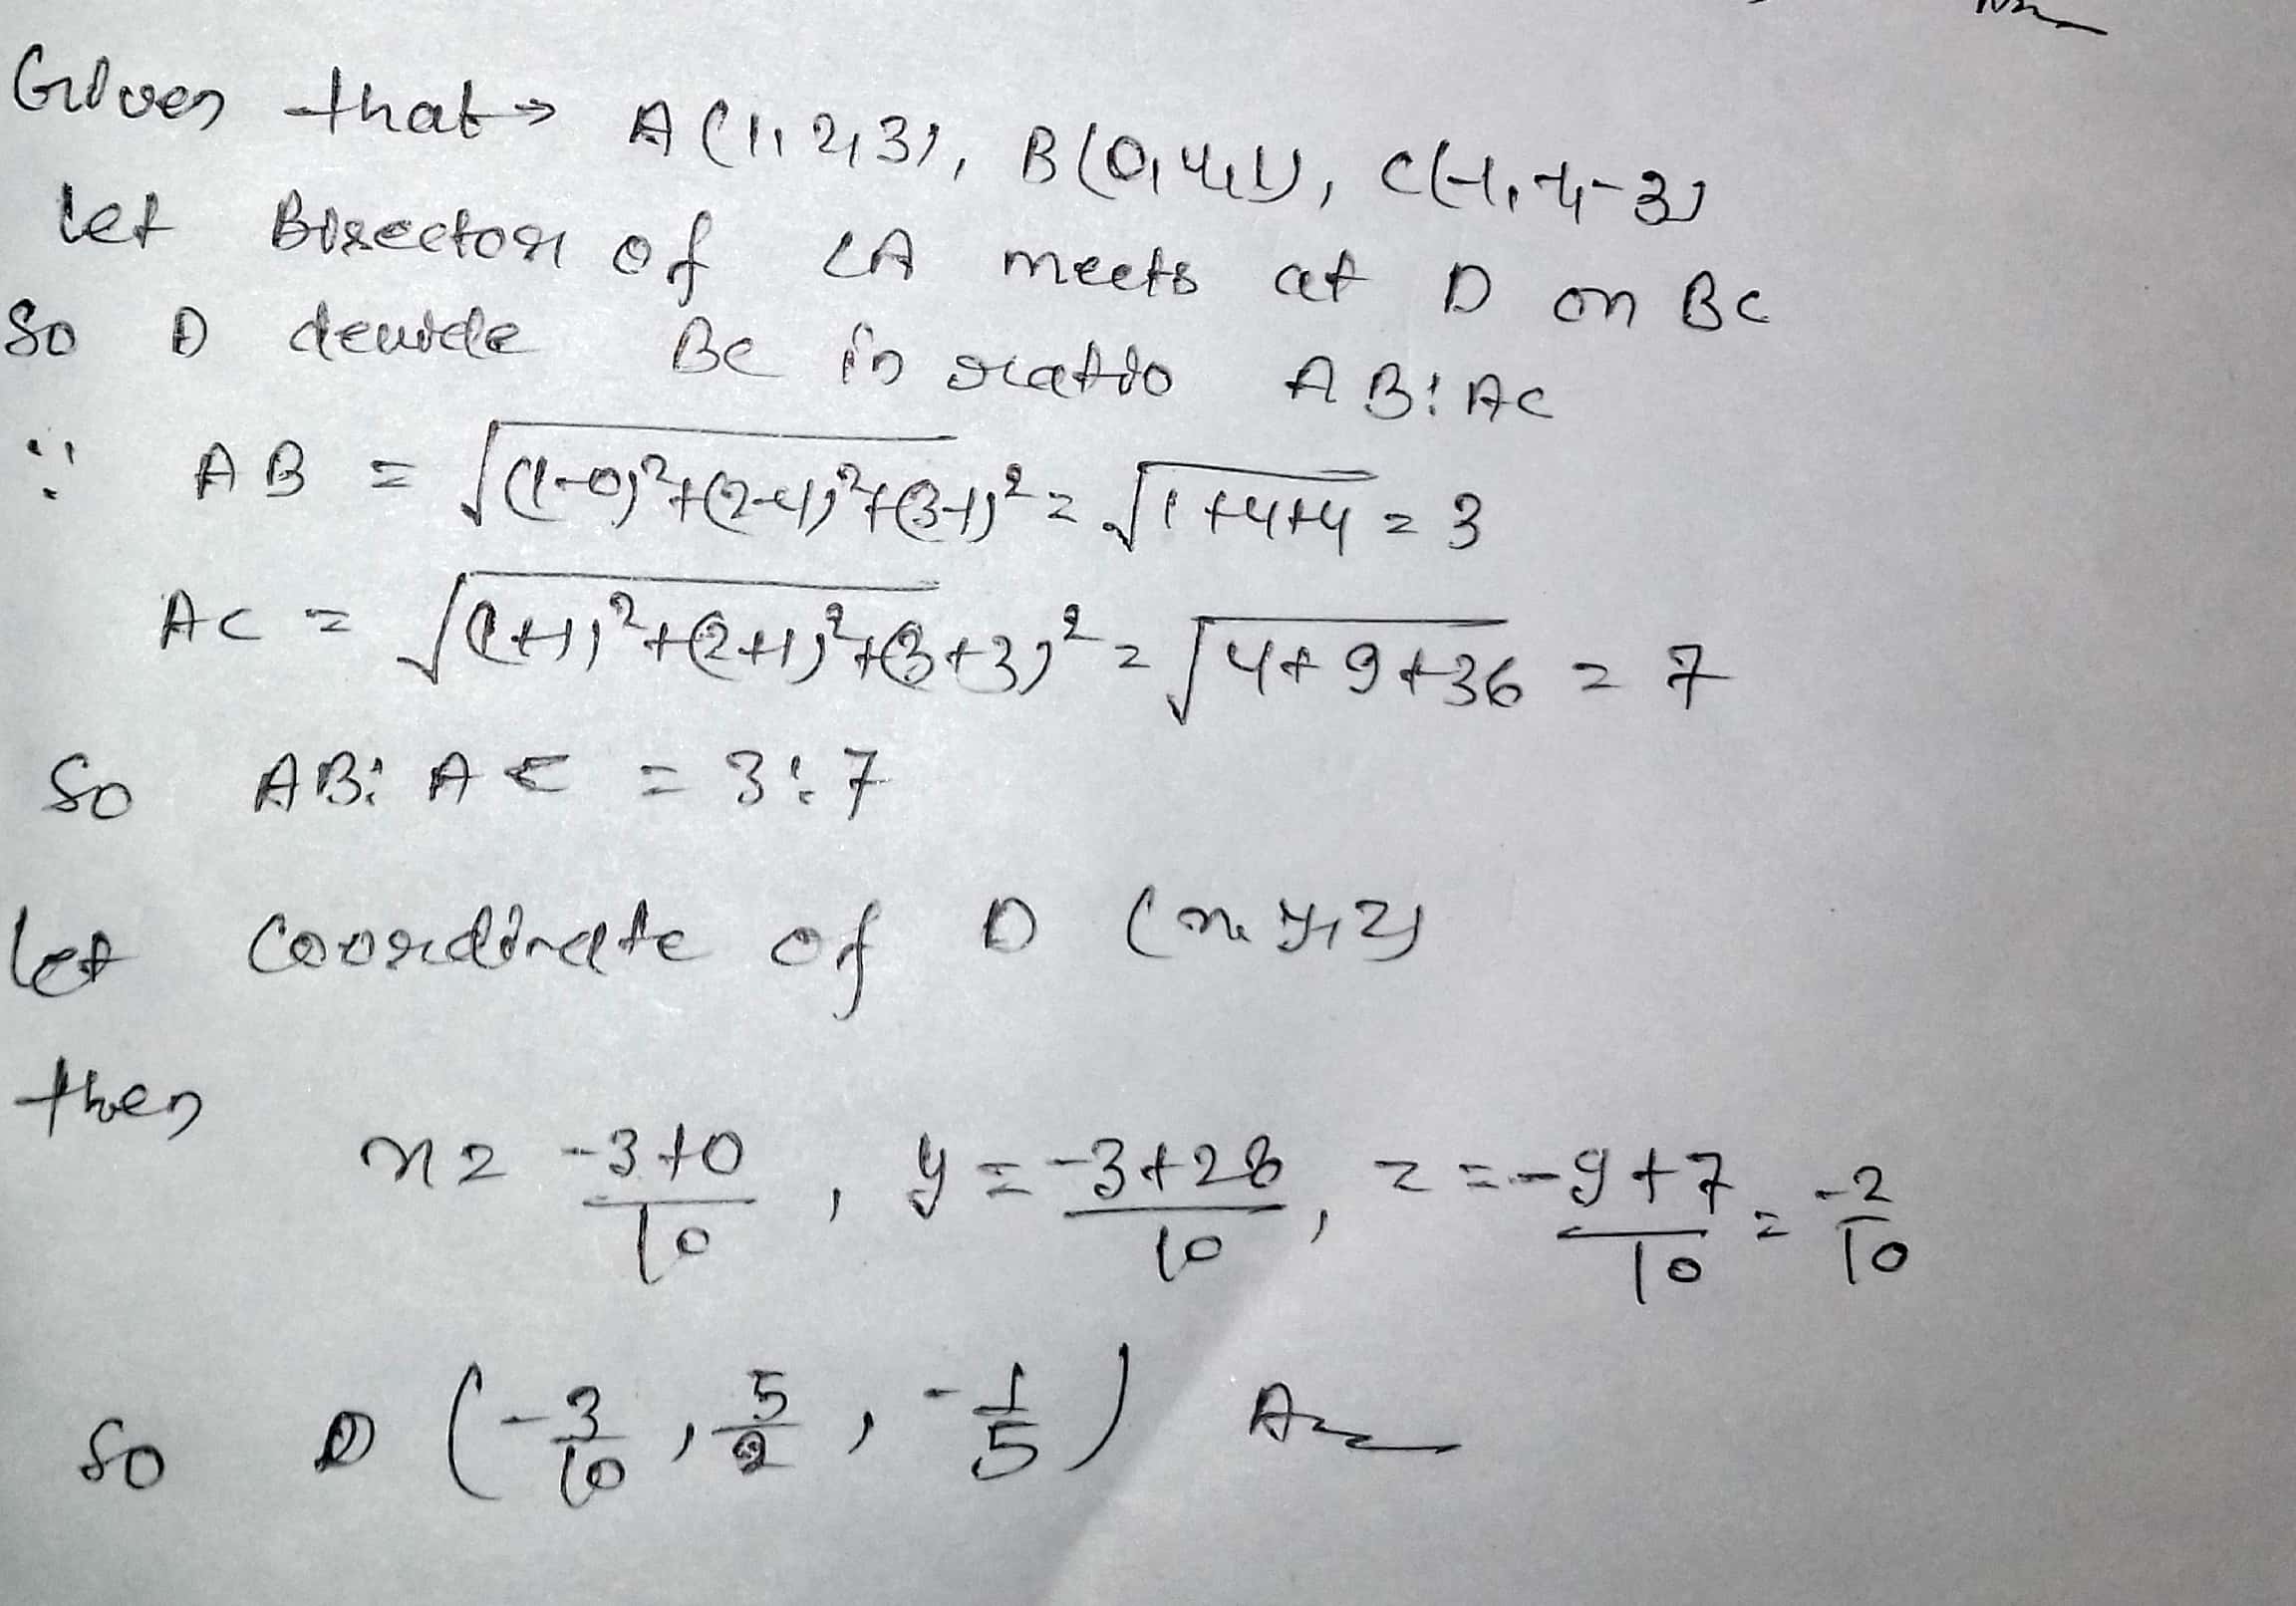
$$A(1,2,3),B(0,4,1),C(-1,-1,-3)$$ are the vertices of a triangle $$ABC$$. Find the point in which the bisector of the angle $$\angle BAC$$ meets $$BC$$.
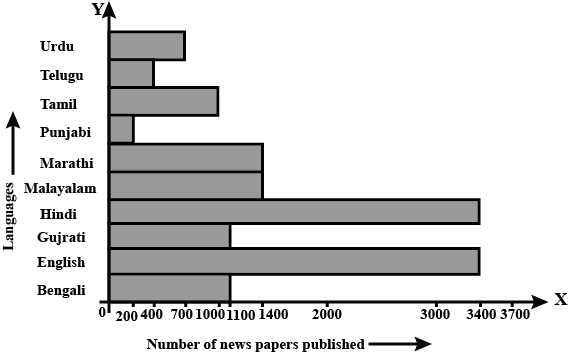
The bar graph as shown in above fig. represents the circulation of newspapers in 10 languages.
study the bar graph and answer the following question:
State the language other than english in which the largest number of newspapers are published.
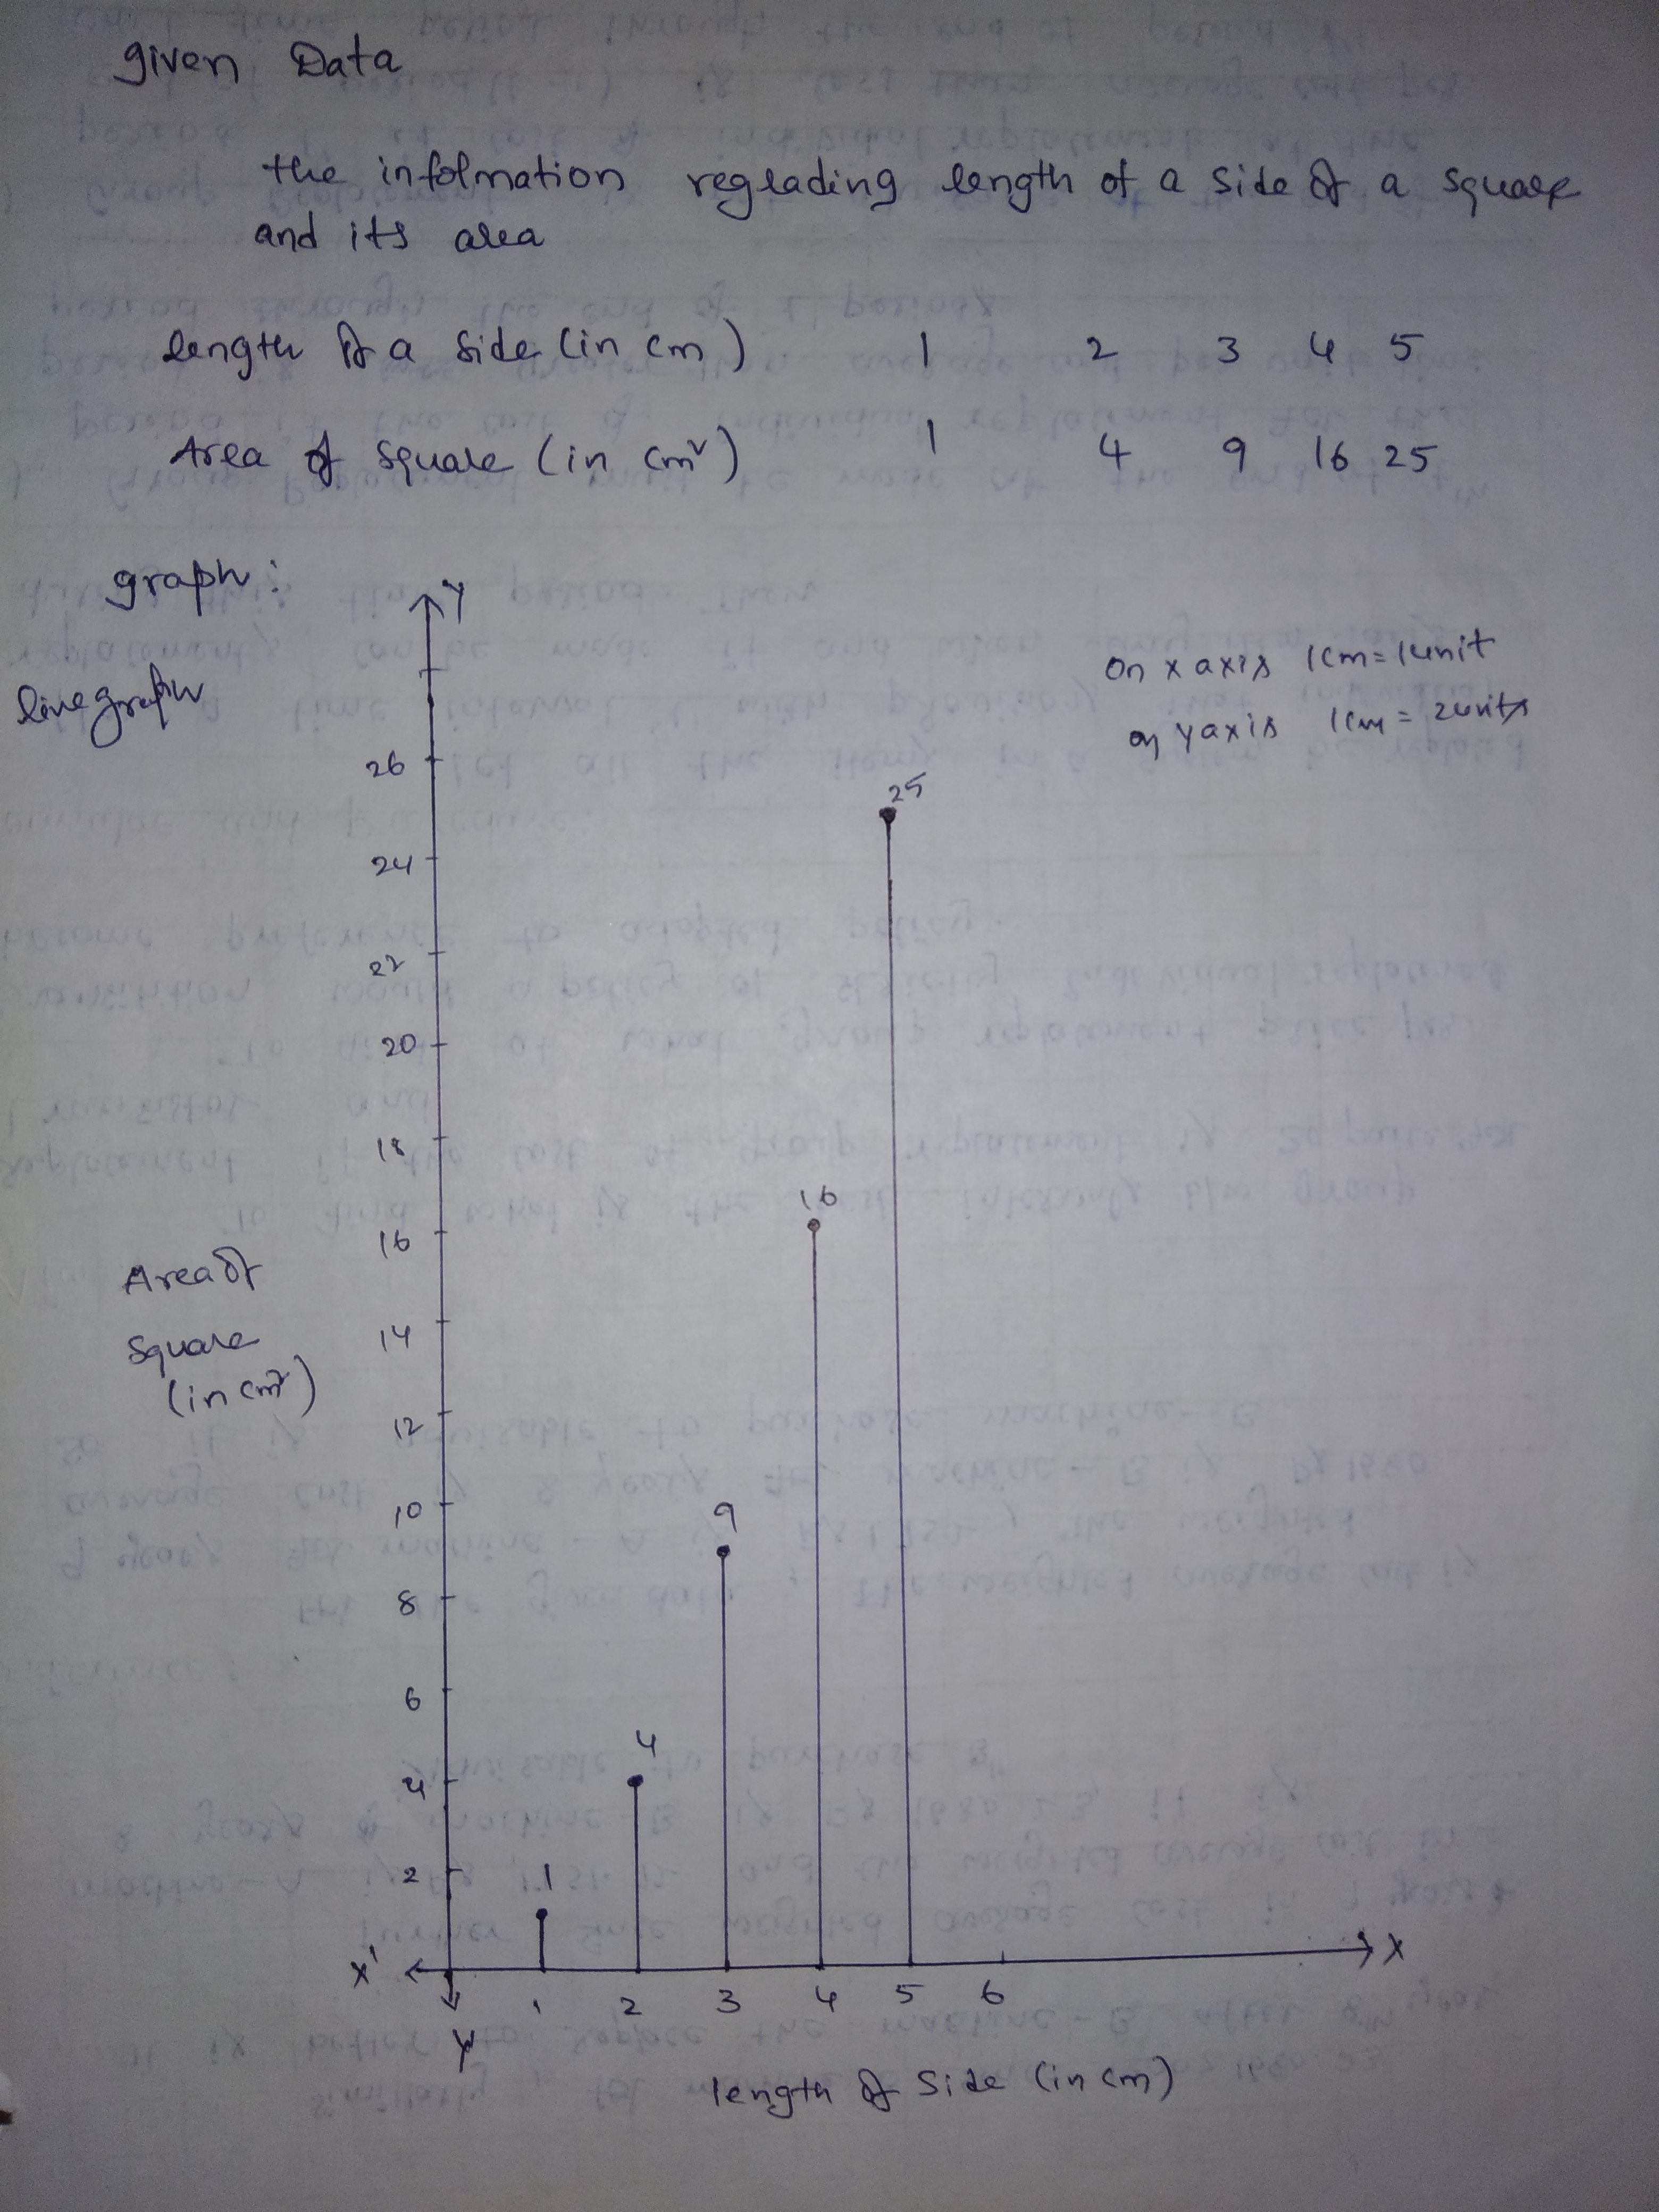
The following table gives the information regarding length of a side of a square and its area:
| Length of a side(in cm): | $$1$$ | $$2$$ | $$3$$ | $$4$$ | $$5$$ |
| Area of square(in $$cm^{2}$$) | $$1$$ | $$4$$ | $$9$$ | $$16$$ | $$25$$ |
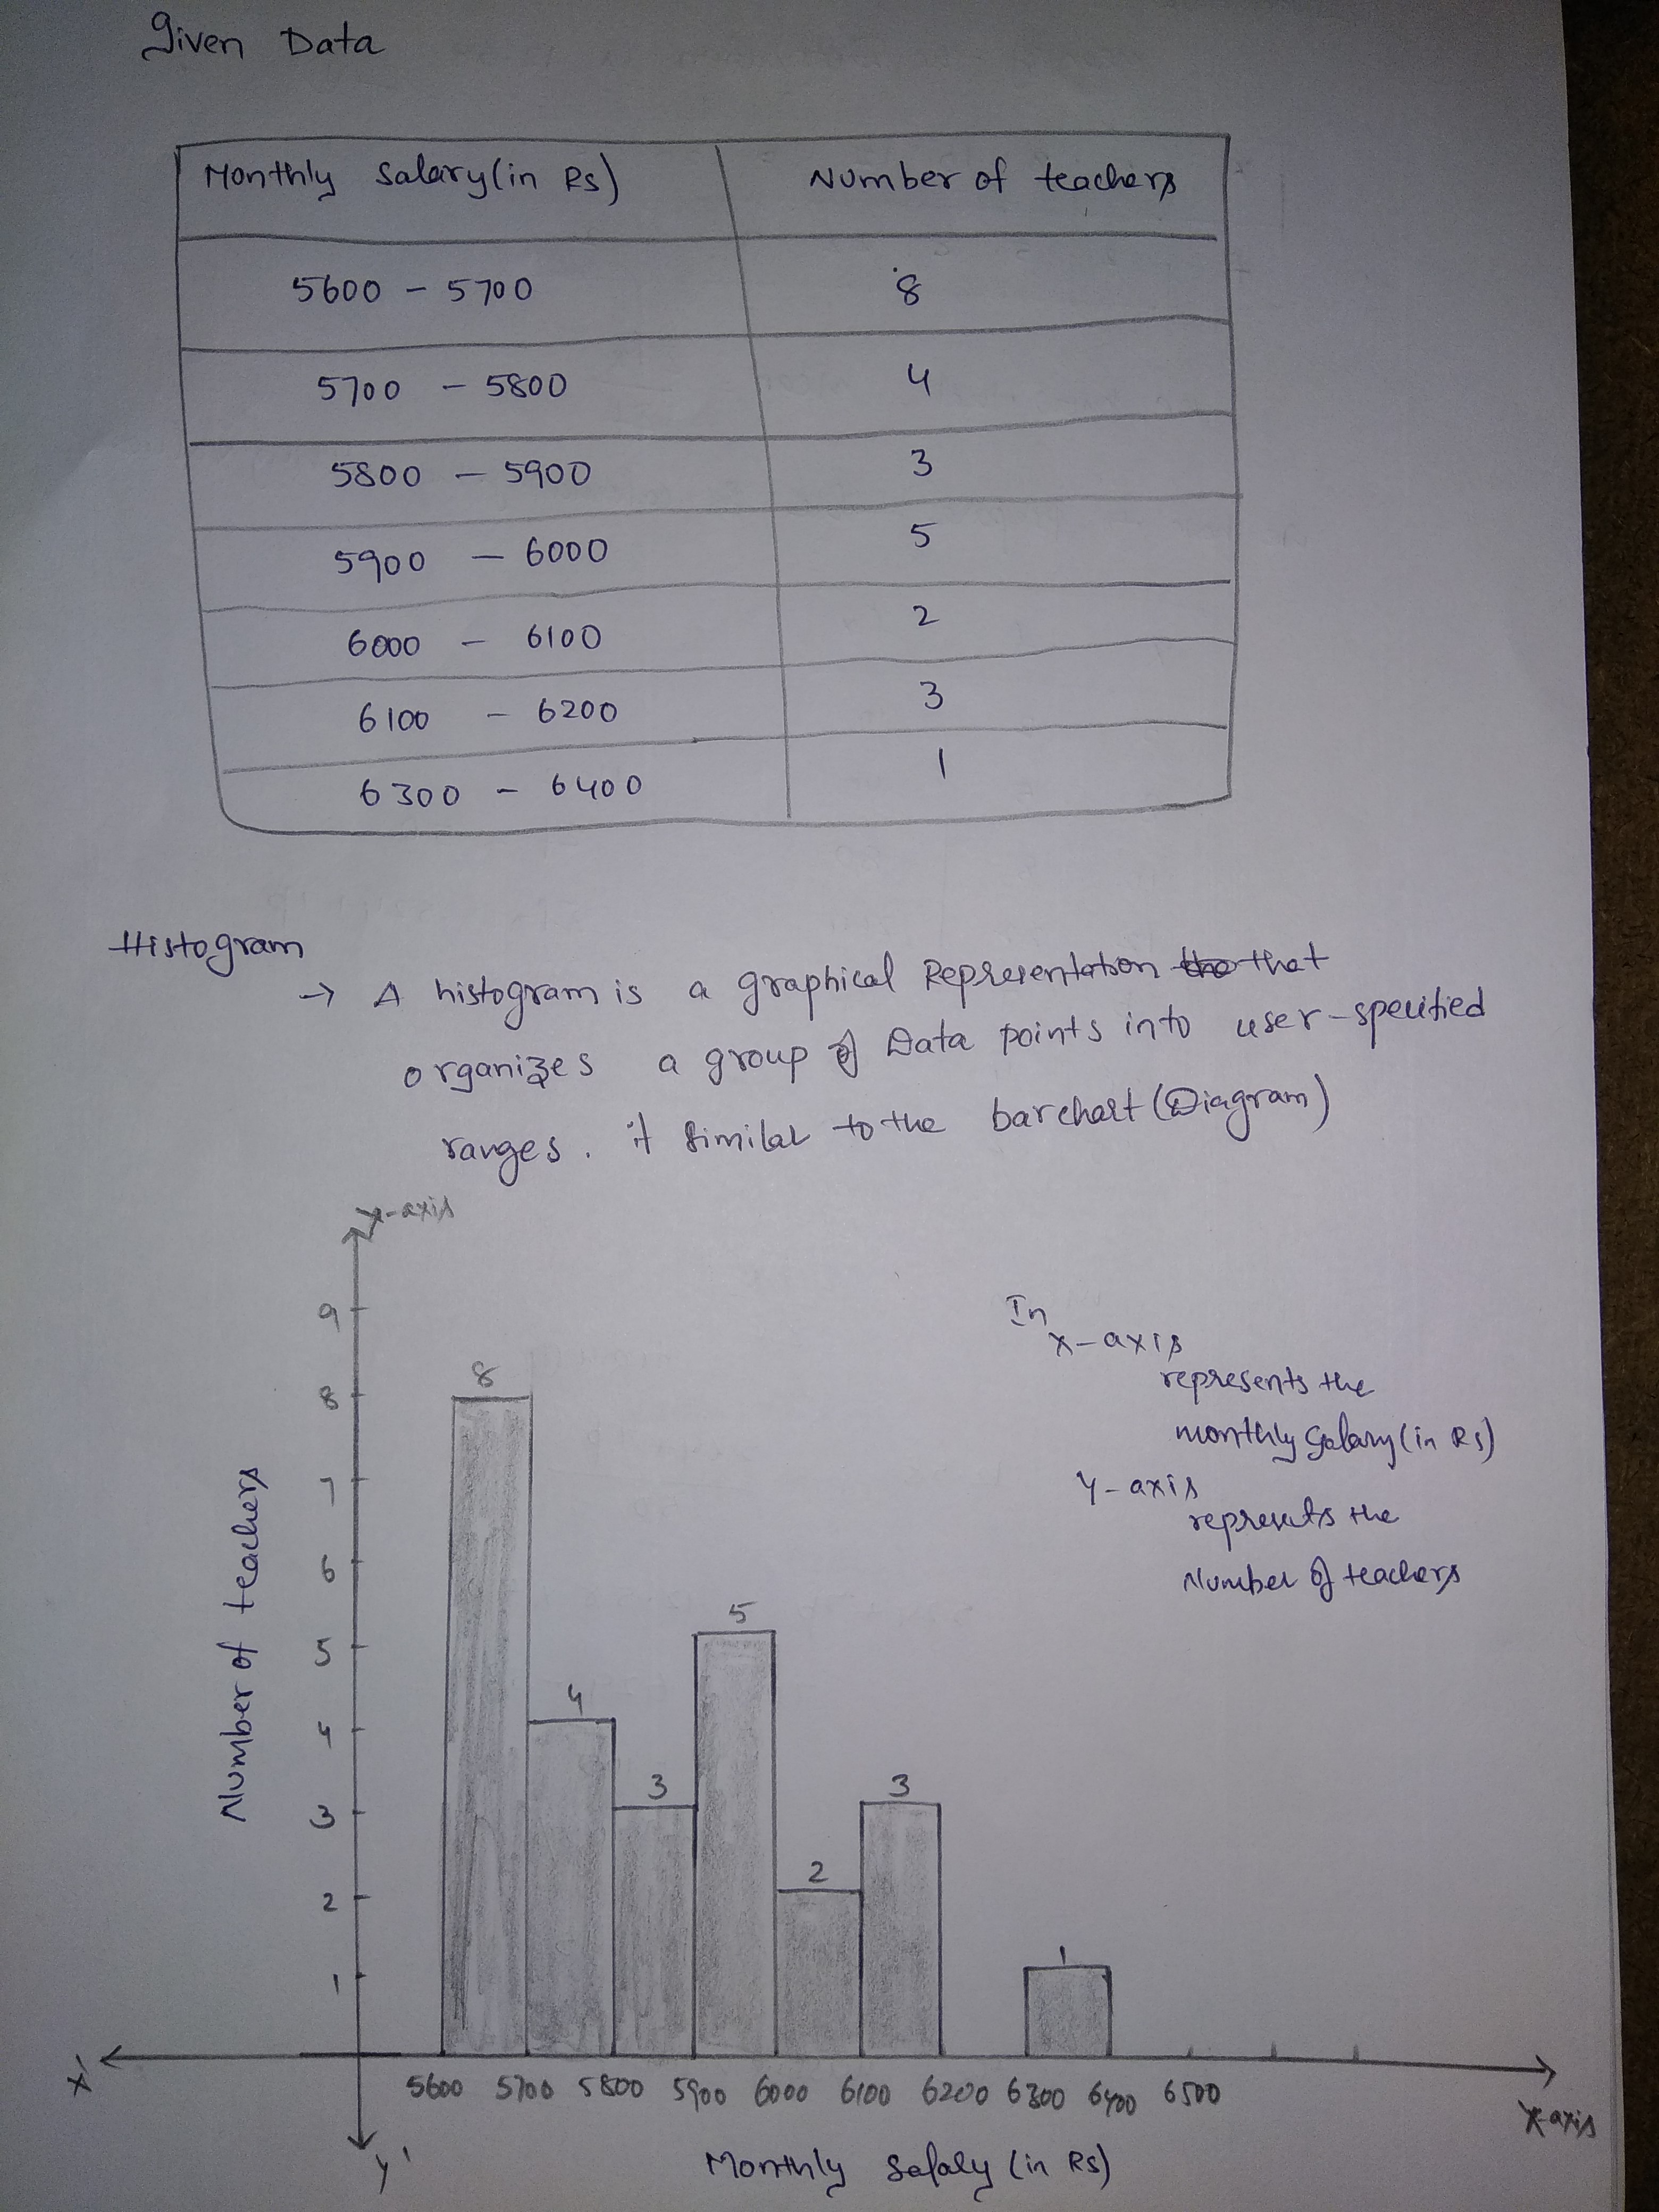
Draw a histogram to represent the following data:
| Monthly salary (in Rs) | Number of teachers |
| $$5600-5700$$ | $$8$$ |
| $$5700-5800$$ | $$4$$ |
| $$5800-5900$$ | $$3$$ |
| $$5900-6000$$ | $$5$$ |
| $$6000-6100$$ | $$2$$ |
| $$6100-6200$$ | $$3$$ |
| $$6300-6400$$ | $$1$$ |
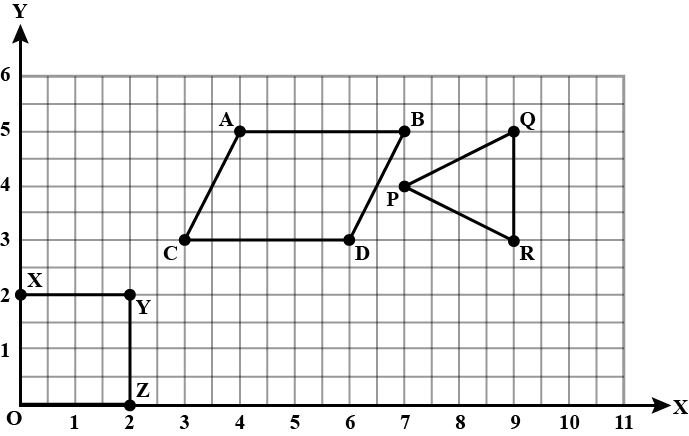
Write the coordinates of each of the vertices of each polygon in Fig $$27.9$$.
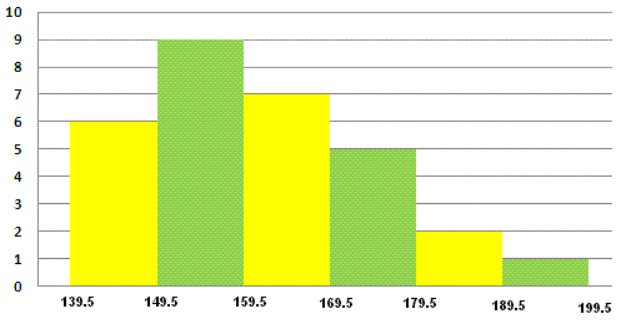
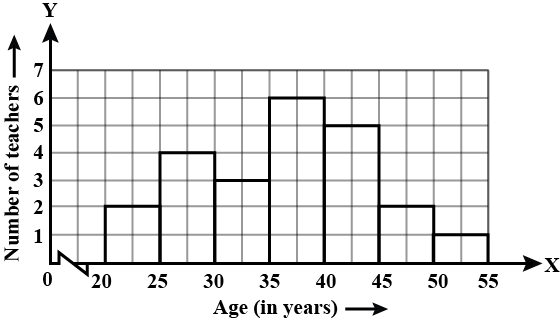
The following histogram shows the frequency distribution of the ages of $$22$$ teachers in a school :
What is the number of eldest and youngest teachers in the school ?
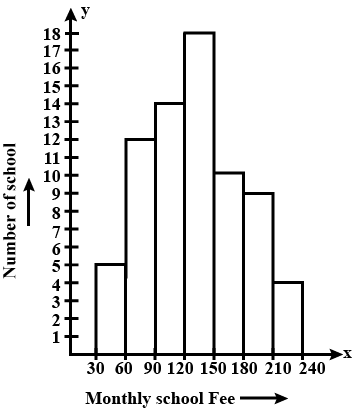
Construct a histogram for the following data:
| Monthly school fee (in Rs): | $$30-60$$ | $$60-90$$ | $$90-120$$ | $$120-150$$ | $$150-180$$ | $$180-210$$ | $$210-240$$ |
| Number of schools : | $$5$$ | $$12$$ | $$14$$ | $$18$$ | $$10$$ | $$9$$ | $$4$$ |
| Monthly School Fee | 30-60 | 60-90 | 90-120 | 120-150 | 150-180 | 180-210 | 210-240 |
| Number of schools | 5 | 12 | 14 | 18 | 10 | 9 | 4 |
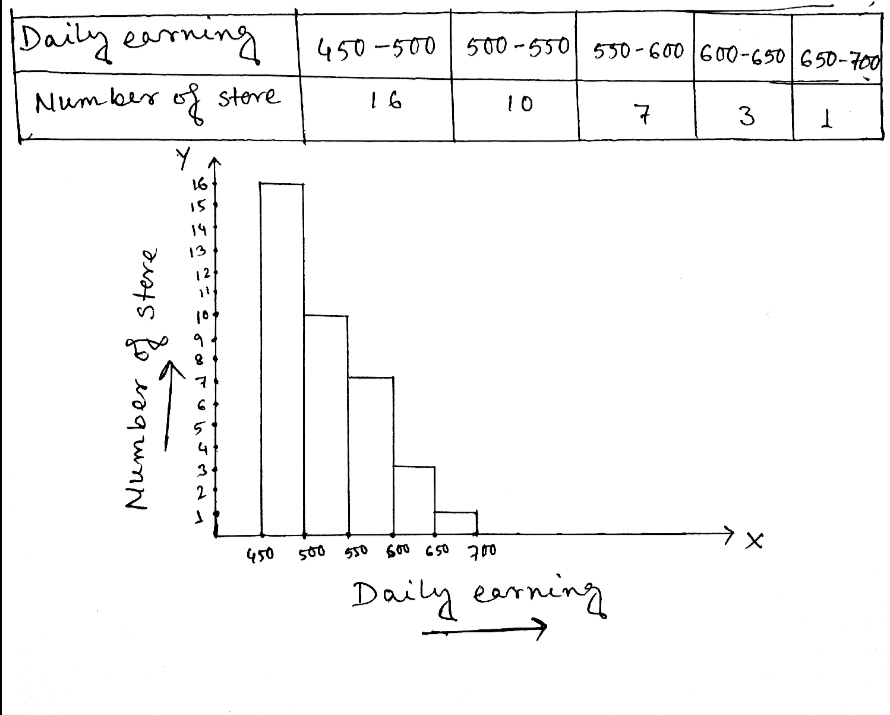
Draw a histogram for the daily earnings of $$30$$ drug stores in the following table:
| Daily earning (in Rs): | $$450-500$$ | $$500-550$$ | $$550-600$$ | $$600-650$$ | $$650-700$$ |
| Number of stores | $$16$$ | $$10$$ | $$7$$ | $$3$$ | $$1$$ |
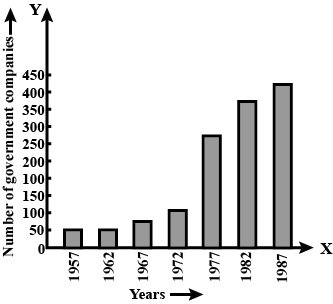
Read the following bar graph (Fig.) and answer the following question:
State each of the following whether true or false.
The number of government companies in 1957 is that of 1982 is 1:9.
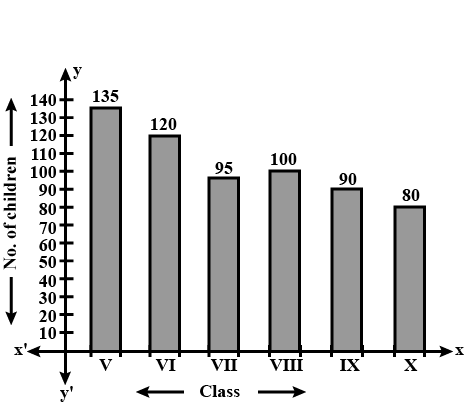
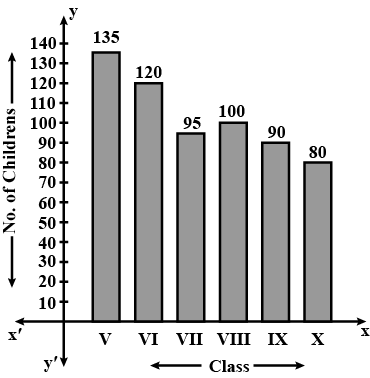
Number of children in six different classes are given below. Represent the data on a bar graph.
| Class: | V | VI | VII | VIII | IX | X |
| Number of children: | 135 | 120 | 95 | 100 | 90 | 80 |
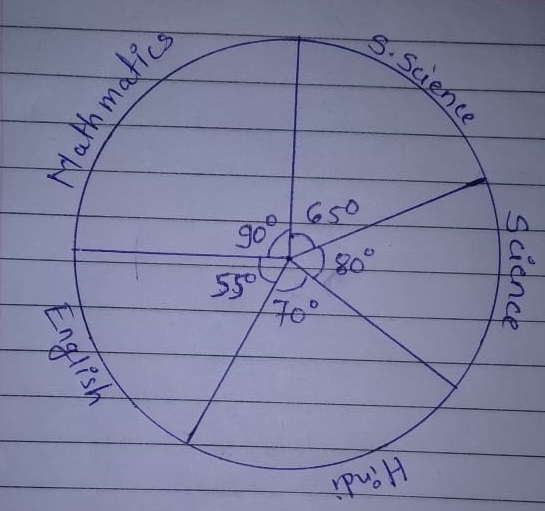
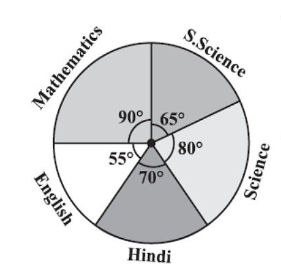
The following pie chat gives the marks second in an examination by a student in Hindi, English, Mathematics, Social Science and Science. If the total marks obtained by the student were $$540$$ answer the following questions. All values are shown in degrees.
How many more marks were obtained by the student in Mathematics than in Hindi?

Total marks obtained by students $$=540$$
| $$Subject$$ | $$Angle$$ | $$Fraction=\dfrac{Angle}{360^o}$$ | $$Marks\,obtained$$ $$=Fraction\times 540$$ |
| $$Mathematics$$ | $$90^o$$ | $$\dfrac{90^o}{360^o}=\dfrac{1}{4}$$ | $$\dfrac{1}{4}\times 540=135$$ |
| $$English$$ | $$55^o$$ | $$\dfrac{55^o}{360^o}=\dfrac{11}{72}$$ | $$\dfrac{11}{72}\times 540=82.5$$ |
| $$Hindi$$ | $$70^o$$ | $$\dfrac{70^o}{360^o}=\dfrac{7}{36}$$ | $$\dfrac{7}{36}\times 540=105$$ |
| $$Science$$ | $$80^o$$ | $$\dfrac{80^o}{360^o}=\dfrac{2}{9}$$ | $$\dfrac{2}{9}\times 540=120$$ |
| $$Social\,science$$ | $$65^o$$ | $$\dfrac{65^o}{360^o}=\dfrac{13}{72}$$ | $$\dfrac{13}{72}\times 540=97.50$$ |

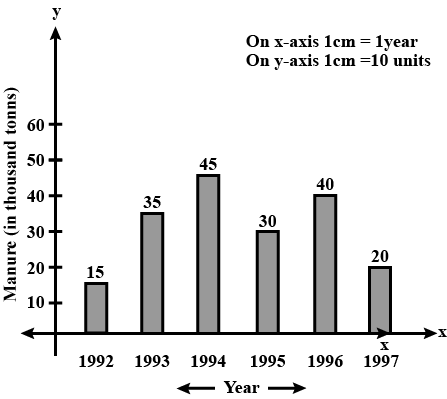
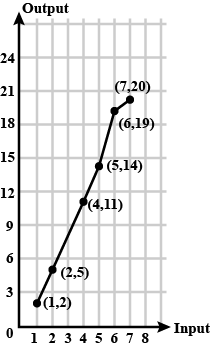
Study the given graph and complete the corresponding table.
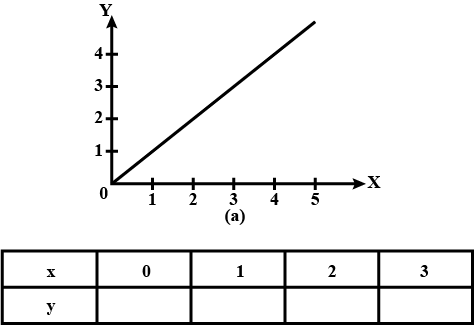
The point where the two axes intersect is called the ________ .
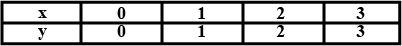
The following data gives the amount of manure (in thousand tonnes) manufactured by a company during some years:
| Year | 1992 | 1993 | 1994 | 1995 | 1996 | 1997 |
| Manure (in thousand tonnes) | 15 | 35 | 45 | 30 | 40 | 20 |
Consider the following data gathered from a survey of a colony:
| Favourate Sport: | Cricket | Basket-Ball | Swimming | Hockey | Athletics |
| Watching | 1240 | 470 | 510 | 423 | 250 |
| Participating | 620 | 320 | 320 | 250 | 105 |
Which sport is most popular?
The following pie chart gives the marks second in an examination by a student in Hindi, English, Mathematics, Social Science and Science. If the total marks obtained by the student were $$540$$ answer the following questions. All values are shown in degrees.
In which subject did the student score $$105$$ marks?

Total marks obtained by students $$=540$$
| $$Subject$$ | $$Angle$$ | $$Fraction=\dfrac{Angle}{360^o}$$ | $$Marks\,obtained$$ $$=Fraction\times 540$$ |
| $$Mathematics$$ | $$90^o$$ | $$\dfrac{90^o}{360^o}=\dfrac{1}{4}$$ | $$\dfrac{1}{4}\times 540=135$$ |
| $$English$$ | $$55^o$$ | $$\dfrac{55^o}{360^o}=\dfrac{11}{72}$$ | $$\dfrac{11}{72}\times 540=82.5$$ |
| $$Hindi$$ | $$70^o$$ | $$\dfrac{70^o}{360^o}=\dfrac{7}{36}$$ | $$\dfrac{7}{36}\times 540=105$$ |
| $$Science$$ | $$80^o$$ | $$\dfrac{80^o}{360^o}=\dfrac{2}{9}$$ | $$\dfrac{2}{9}\times 540=120$$ |
| $$Social\,science$$ | $$65^o$$ | $$\dfrac{65^o}{360^o}=\dfrac{13}{72}$$ | $$\dfrac{13}{72}\times 540=97.50$$ |
The following pie chat gives the marks second in an examination by a student in Hindi, English, Mathematics, Social Science and Science. If the total marks obtained by the student were $$540$$ answer the following questions. All values are shown in degrees.
Examine whether the sum of the marks obtained in Social Science and Mathematics is more than that in Science and Hindi.
Total marks obtained by students $$=540$$
| $$Subject$$ | $$Angle$$ | $$Fraction=\dfrac{Angle}{360^o}$$ | $$Marks\,obtained$$ $$=Fraction\times 540$$ |
| $$Mathematics$$ | $$90^o$$ | $$\dfrac{90^o}{360^o}=\dfrac{1}{4}$$ | $$\dfrac{1}{4}\times 540=135$$ |
| $$English$$ | $$55^o$$ | $$\dfrac{55^o}{360^o}=\dfrac{11}{72}$$ | $$\dfrac{11}{72}\times 540=82.5$$ |
| $$Hindi$$ | $$70^o$$ | $$\dfrac{70^o}{360^o}=\dfrac{7}{36}$$ | $$\dfrac{7}{36}\times 540=105$$ |
| $$Science$$ | $$80^o$$ | $$\dfrac{80^o}{360^o}=\dfrac{2}{9}$$ | $$\dfrac{2}{9}\times 540=120$$ |
| $$Social\,science$$ | $$65^o$$ | $$\dfrac{65^o}{360^o}=\dfrac{13}{72}$$ | $$\dfrac{13}{72}\times 540=97.50$$ |

Number of children in six different classes are given below. Represent the data on a bar graph.
| Class: | V | VI | VII | VIII | IX | X |
| Number of children: | 135 | 120 | 95 | 100 | 90 | 80 |
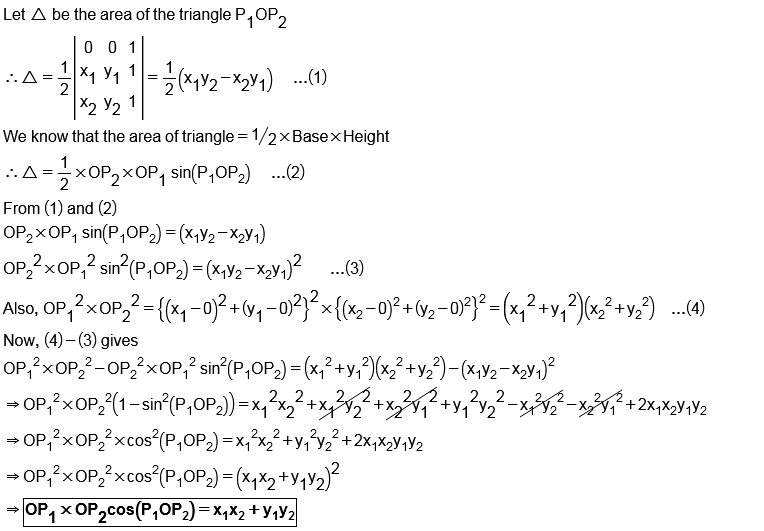
If $$O$$ is the origin, and if the coordinates of any two points $$P_1$$ and $$P_2$$ be respectively $$(x_1 , y_1)$$ and $$(x_2 , y_2)$$ , prove that
$$OP_1 . OP_2 . \cos \, \angle P_1OP_2 = x_1x_2 + y_1y_2.$$
On the scale of $$1$$ unit length $$= 10$$ crores, the bar
of length, $$6$$ units will represent ________ crore and of ________units will represent $$75$$ crores.
The $$x$$-coordinate of any point lying on the $$y$$-axis will be _________ .
All points with y-coordinate as zero lie on the _________ .
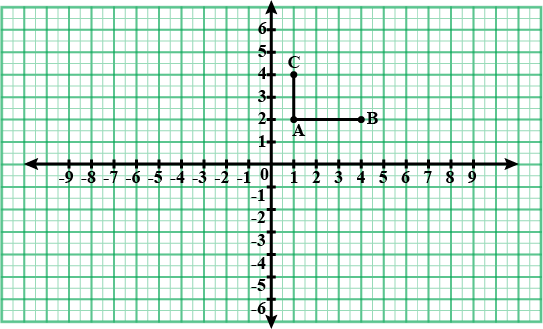
Locate the points A $$(1, 2),$$ B $$(4, 2)$$ and C$$ (1, 4)$$ on a graph sheet taking suitable axes. Write the coordinates of the fourth point D to complete the rectangle ABCD.
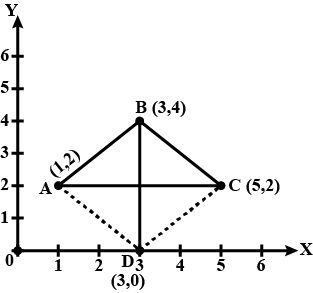
Locate the points A$$(1, 2) $$, B $$(3, 4)$$ and C $$(5, 2)$$ on a graph sheet taking suitable axes. Write the coordinates of the fourth point D to complete the rhombus ABCD. And measure the diagonals of this rhombus and find whether they are equal or not.
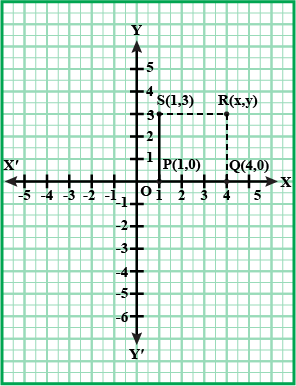
Plot the points $$P \left(1,0\right), Q \left(4,0\right) \,and \, S \left(1,3\right)$$. Find the coordinates of the point R such that PQRS is a square.
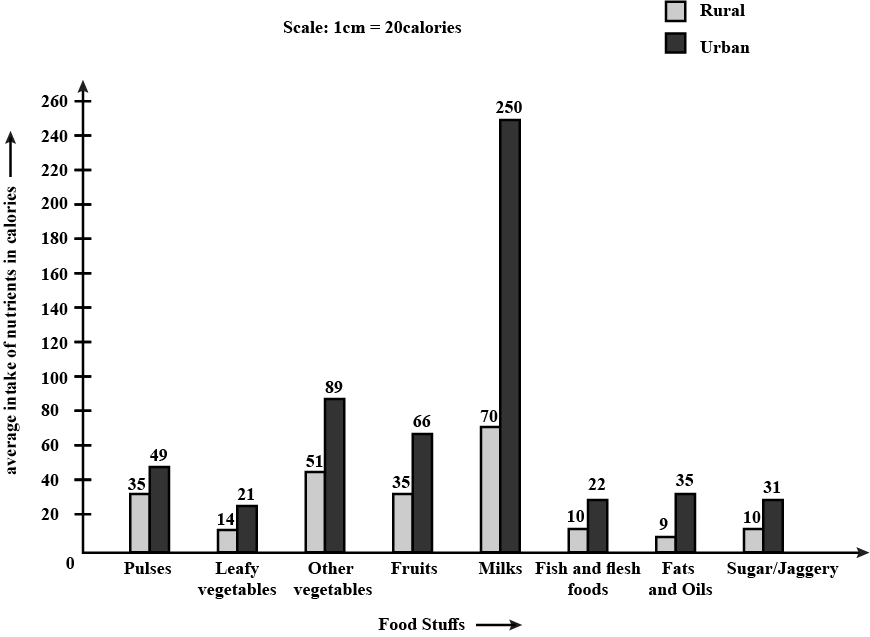
The following table shows the average intake of nutrients in calories by rural and urban groups in a particular year. Using a suitable scale for the given data, draw a double bar graph to compare the data.
| Foodstuff | Rural | Urban |
| Pulses | 35 | 49 |
| Leafy vegetables | 14 | 21 |
| Other vegetables | 51 | 89 |
| Fruits | 35 | 66 |
| Milk | 70 | 250 |
| Fish and flesh foods | 10 | 22 |
| Fats and Oils | 9 | 35 |
| Sugar/Jaggery | 19 | 31 |
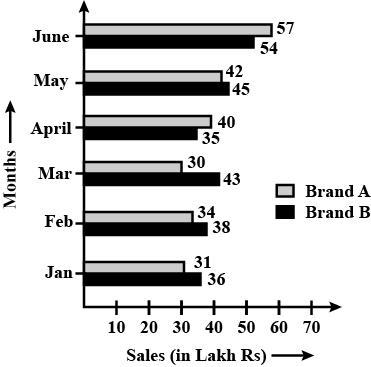
Study the double bar graph shown below and answer the questions that follow:
(a) What information is represented by the above double bar graph?
(b) In which month sales of brand $$A$$ decreased as compared to the previous month?
(c) What is the difference in sales of both the brands for the month of June?
(d) Find the average sales of brand $$B$$ for the six months.
(e) List all months for which the sales of brand $$B$$ was less than that of brand $$A.$$
(f) Find the ratio of sales of brand $$A$$ as compared to brand $$B$$ for the month of January.
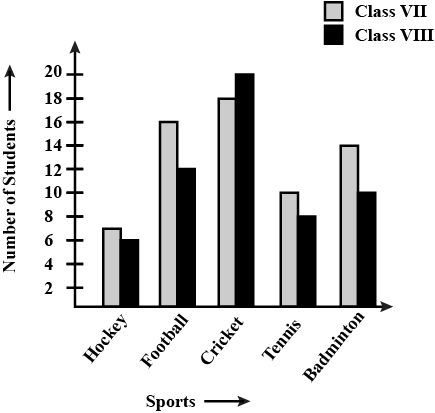
Study the double bar graphs given below and answer the following questions:
(a) Which sport is liked the most by Class VIII students?
(b) How many students of Class VII like Hockey and Tennis in all?
(c) How many students are there in Class VII?
(d) For which sport is the number of students of Class VII less than that of Class VIII?
(e) For how many sports students of Class VIII are less than Class VII?
(f) Find the ratio of students who like badminton in Class VII to students who like Tennis in Class VIII.
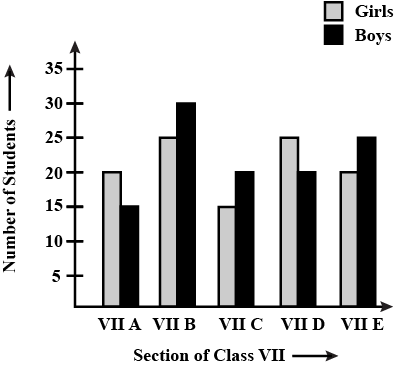
Study the double bar graph and answer the questions that follow:
(a) What information does the double bar graph represent?
(b) Find the total number of boys in all sections of Class VII.
(c) In which sections, the number of girls is greater than the number of boys?
(d) In which section, the number of boys is the maximum?
(e) In which section, the number of girls is the least?
| Input | 1 | 2 | 4 | 5 | 7 |
| Output | 2 | 5 | 11 | 14 | 20 |
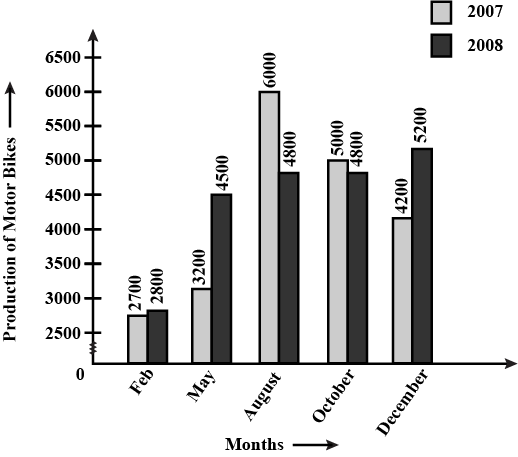
The data given below shows the production of motor bikes in a factory for some months of two consecutive years.
| Months | Feb | May | Aug | Oct | Dec |
| 2008 | 2700 | 3200 | 6000 | 5000 | 4200 |
| 2007 | 2800 | 4500 | 4800 | 4800 | 5200 |
(a) Draw a double bar graph using appropriate scale to depict the above information and compare them.
(b) In which year was the total output the maximum?
(c) Find the mean production for the year 2007.
(d) For which month was the difference between the productions for the two years the maximum?
(e) In which month for the year 2008,the production was the maximum?
(f) In which month for the year 2007, the production was the least?
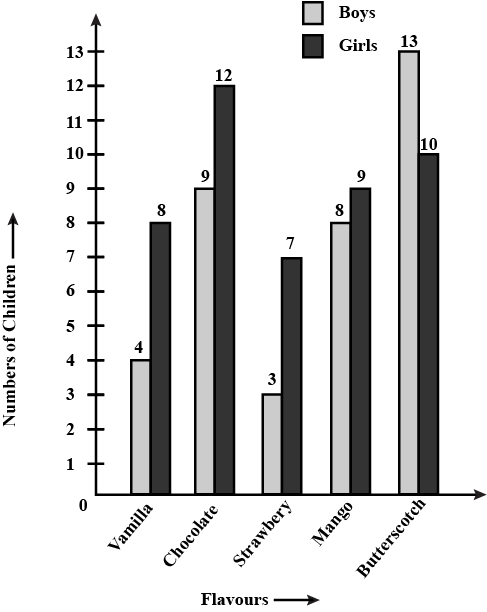
The table below gives the flavors of ice cream liked by children (boys and girls) of a society.
| Flavors | Vanilla | Chocolates | Strawberry | Mango | Butterscotch |
| Boys | 4 | 9 | 3 | 8 | 13 |
| Girls | 8 | 12 | 7 | 9 | 10 |
(a) Draw a double bar graph using appropriate scale to represent the above information.
(b) Which flavor is liked the most by boys?
(c) How many girls are there in all?
(d) How many children like chocolate flavor of ice cream?
(e) Find the ratio of children who like strawberry flavor to vanilla flavor of ice cream.
Three vertices of a parallelogram ABCD are $$A(3, -1, 2), B(1, 2, -4)$$ and $$C(-1, 1, 2)$$. Find the coordinates of the fourth vertex.
We know that the diagonals of a parallelogram bisect each other.
Therefore, in parallelogram ABCD, AC and BD bisect each other.
$$\therefore$$ Mid - point of AC = Mid-point of BD
$$\Rightarrow \left ( \dfrac{3 - 1}{2}, \dfrac{-1 + 1}{2}, \dfrac {2 + 2}{2} \right ) = \left ( \dfrac{x + 1}{2}, \dfrac{y + 2}{2}, \dfrac{z - 4}{2} \right )$$
$$\Rightarrow (10, 2) = \left ( \dfrac{x + 1}{2}, \dfrac{y + 2}{2}, \dfrac{z - 4}{2} \right )$$
$$\Rightarrow \dfrac{x + 1}{2} = 1, \dfrac{y + 2}{2} = 0,$$ and $$\dfrac{z - 4}{2} = 2$$
$$\Rightarrow x = 1, y = 2$$ and $$z = 8$$
Thus, the coordinates of the fourth vertex are $$(1, -2, 8).$$
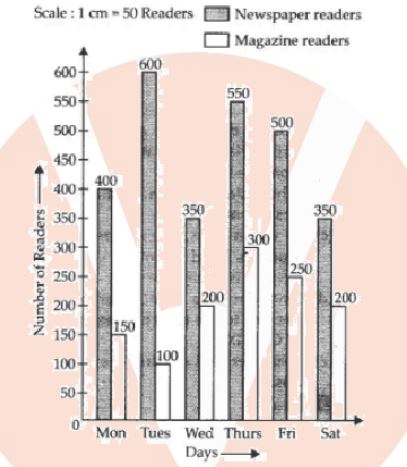
In a public library, the following observations were recorded by the librarian in a particular week:
| Days | Mon | Tues | Wed | Thurs | Fri | Sat |
| Newspaper Readers | 400 | 600 | 350 | 550 | 500 | 350 |
| Magazine Readers | 150 | 100 | 200 | 300 | 250 | 200 |
(b) On which day, the number of readers in the library was maximum?
(c) What is the mean number of magazine readers?
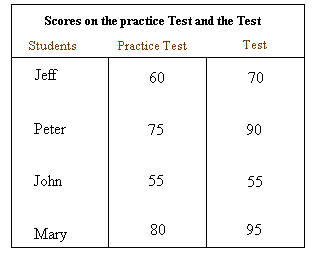
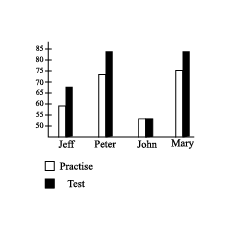
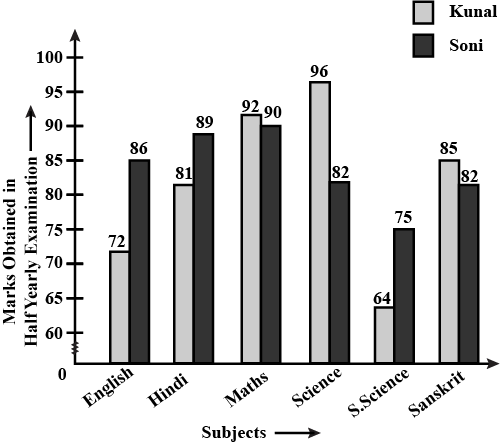
The marks out of 100 obtained by Kunal and Soni in the half yearly examination are given below:
| Subjects | English | Hindi | Maths | Science | S.Science | Sanskrit |
| Kunal | 72 | 81 | 92 | 96 | 64 | 85 |
| Soni | 86 | 89 | 90 | 82 | 75 | 82 |
(b) Calculate the total percentage of marks obtained by Soni.
(c) Calculate the total percentage of marks obtained by Kunal.
(d) Compare the percentages of marks obtained by Kunal and Soni.
(e) In how many subjects did Soni get more marks than Kunal?
Which are those subjects?
(f) Who got more marks in S.Science and what was the difference of marks?
(g) In which subjects the difference of marks was maximum and by how much?
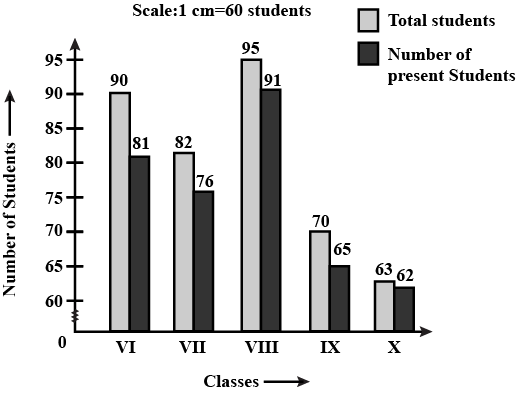
Observe the following data: Class Total Students Numbers of Students
Present on that Day VI 90 81 VII
VIII
IX
X 82
95
70
63 76
91
65
62
Goverment School, Chnadpur
Daily AttendenceDate 15/4/2020(a) Draw a double bar graph choosing an appropriate scale.What do you infer from the bar graph?
(b) Which class has the maximum number of students?
(c) In which class, the difference of the total students and number of students present is minimum?
(d) Find the ratio of number of students present to the total number of students of Class IX.
(e) What per cent of Class VI students were absent?
| Class | Total Students | Numbers of Students Present on that Day |
| VI | 90 | 81 |
| VII VIII IX X | 82 95 70 63 | 76 91 65 62 |
Daily Attendence
(b) Which class has the maximum number of students?
(c) In which class, the difference of the total students and number of students present is minimum?
(d) Find the ratio of number of students present to the total number of students of Class IX.
(e) What per cent of Class VI students were absent?
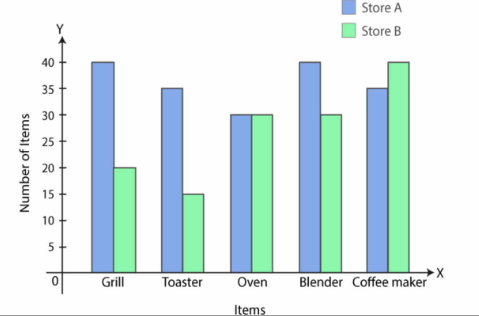
Mr Khurana has two kitchen appliance stores. He compares the sales of two stories during a month and recovered as given below
| Item | Name of items sold store $$A$$ | Name of items sold store $$B$$ |
| Grill | $$40$$ | $$20$$ |
| Toaster | $$35$$ | $$15$$ |
| Oven | $$30$$ | $$30$$ |
| Blender | $$40$$ | $$30$$ |
| Coffee maker | $$35$$ | $$40$$ |
| Item | Name of items sold store $$A$$ | Name of items sold store $$B$$ |
| Grill | $$40$$ | $$20$$ |
| Toaster | $$35$$ | $$15$$ |
| Oven | $$30$$ | $$30$$ |
| Blender | $$40$$ | $$30$$ |
| Coffee maker | $$35$$ | $$40$$ |
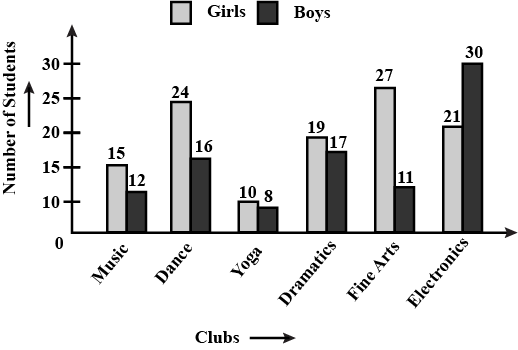
The students of Class VII have to choose one club from music, Dance, Yoga, Dramatics, Fine arts and Electronic clubs. The data given below shows the choices made by girls and boys of the class. Study the table and answer the questions that follow:
| Clubs | Music | Dance | Yoga | Dramatics | Fine Arts | Electronics |
| Girls | 15 | 24 | 10 | 19 | 27 | 21 |
| Boys | 12 | 16 | 8 | 17 | 11 | 30 |
(b) How many students are there in Class VII?
(c) Which is the most preferred club by boys?
(d) Which is the least preferred club by girls?
(e) For which club the difference between boys and girls is the least?
(f) For which club is the difference between boys and girls the maximum?
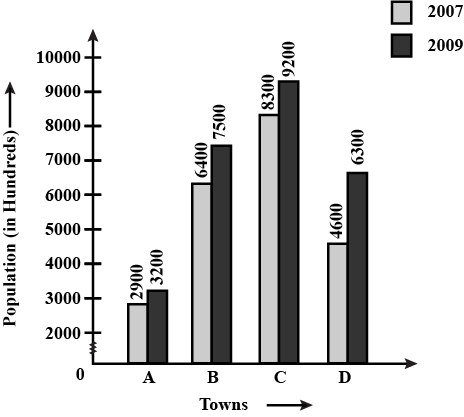
The table below compares the population (in hundreds) of $$4$$ towns over two years:
| Towns | A | B | C | D |
| 2007 | 2900 | 6400 | 8300 | 4600 |
| 2009 | 3200 | 7500 | 9200 | 6300 |
(a) Draw a double bar graph using an appropriate scale to depict the above information.
(b) In which town was the population growth maximum?
(c) In which town was the population growth least?
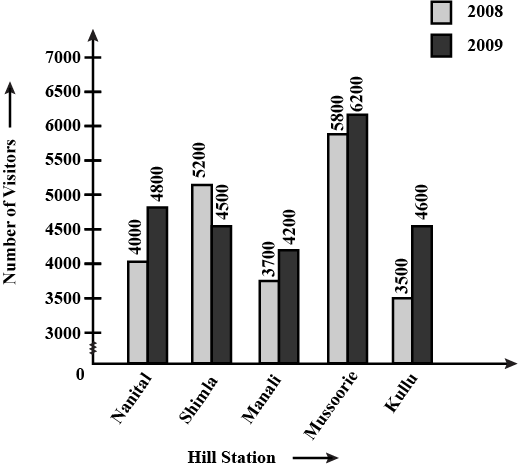
The table below gives the data of tourists visiting 5 hill stations over two consecutive years. Study the table and answer the questions that follow:
| Hill Station | Nainital | Shimla | Manali | Mussoorie | Kullu |
| 2008 | 4000 | 5200 | 3700 | 5800 | 3500 |
| 2009 | 4800 | 4500 | 4200 | 6200 | 4600 |
(b) Which hill station was visited by the maximum number of tourists in 2008?
(c) Which hill station was visited by the least number of tourists in 2009?
(d) In which hill stations was there increase in number of tourists in the year 2009?
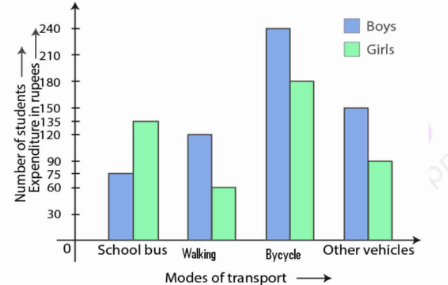
Given below a double bar graph:
Read the double bar graph carefully and answer the following question:
What is the information given by the double bar graph?
Present the following data in the form of a Pie-diagram:
| Items | Expenditure in (Rs.) |
| Cement | 1800 |
| Bricks | 2000 |
| Iron | 4200 |
| Labour | 2000 |
| Items | Expenditure in (Rs.) | Central Angle = (Item/Total) x 360 |
| Cement | 1800 | (1800/10000) x 360 = 64.8 |
| Bricks | 2000 | (2000/10000) x 360 = 72 |
| Iron | 4200 | (4200/10000) x 360 = 151.2 |
| Labour | 2000 | (2000/10000) x 360 = 72 |
| Total | 10000 | 360 |

If co-ordinate of point $$ \mathrm{A}, \mathrm{B}, \mathrm{C} $$ are (6,-1),(1,3) and $$ (\mathrm{x}, 8) $$ respectively, then find the value of $$ x $$ where $$ A B=B C $$.
Given below a double bar graph:
Read the double bar graph carefully and answer the following question:
Which mode of transport boys using the most?

Given below a double bar graph:
Read the double bar graph carefully and answer the following question:
Which mode of transport girl using more than the boys?

$$A (8, -6), B (-4, 2)$$ and $$C (0, -10)$$ are vertices of a triangle ABC. If P is the mid-point of AB and Q is the mid-point of AC, use co-ordinate geometry to show that PQ is parallel to BC. Give a special name of quadrilateral PBCQ.
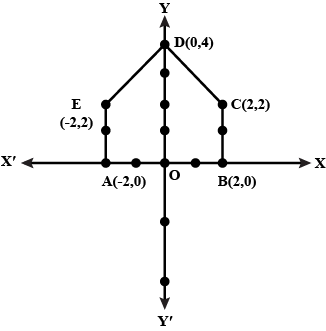
which shape will be formed on joining (-2,0),(2,0),(2,2),(0,4),(-2,2) in the given order?
Solve :
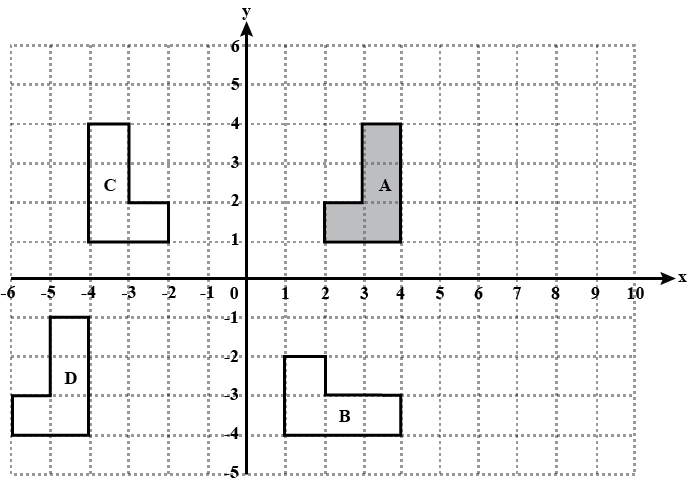
The diagram shows four shapes, A , B , C and D.
Describe fully the single transformation that map shape A onto shape B

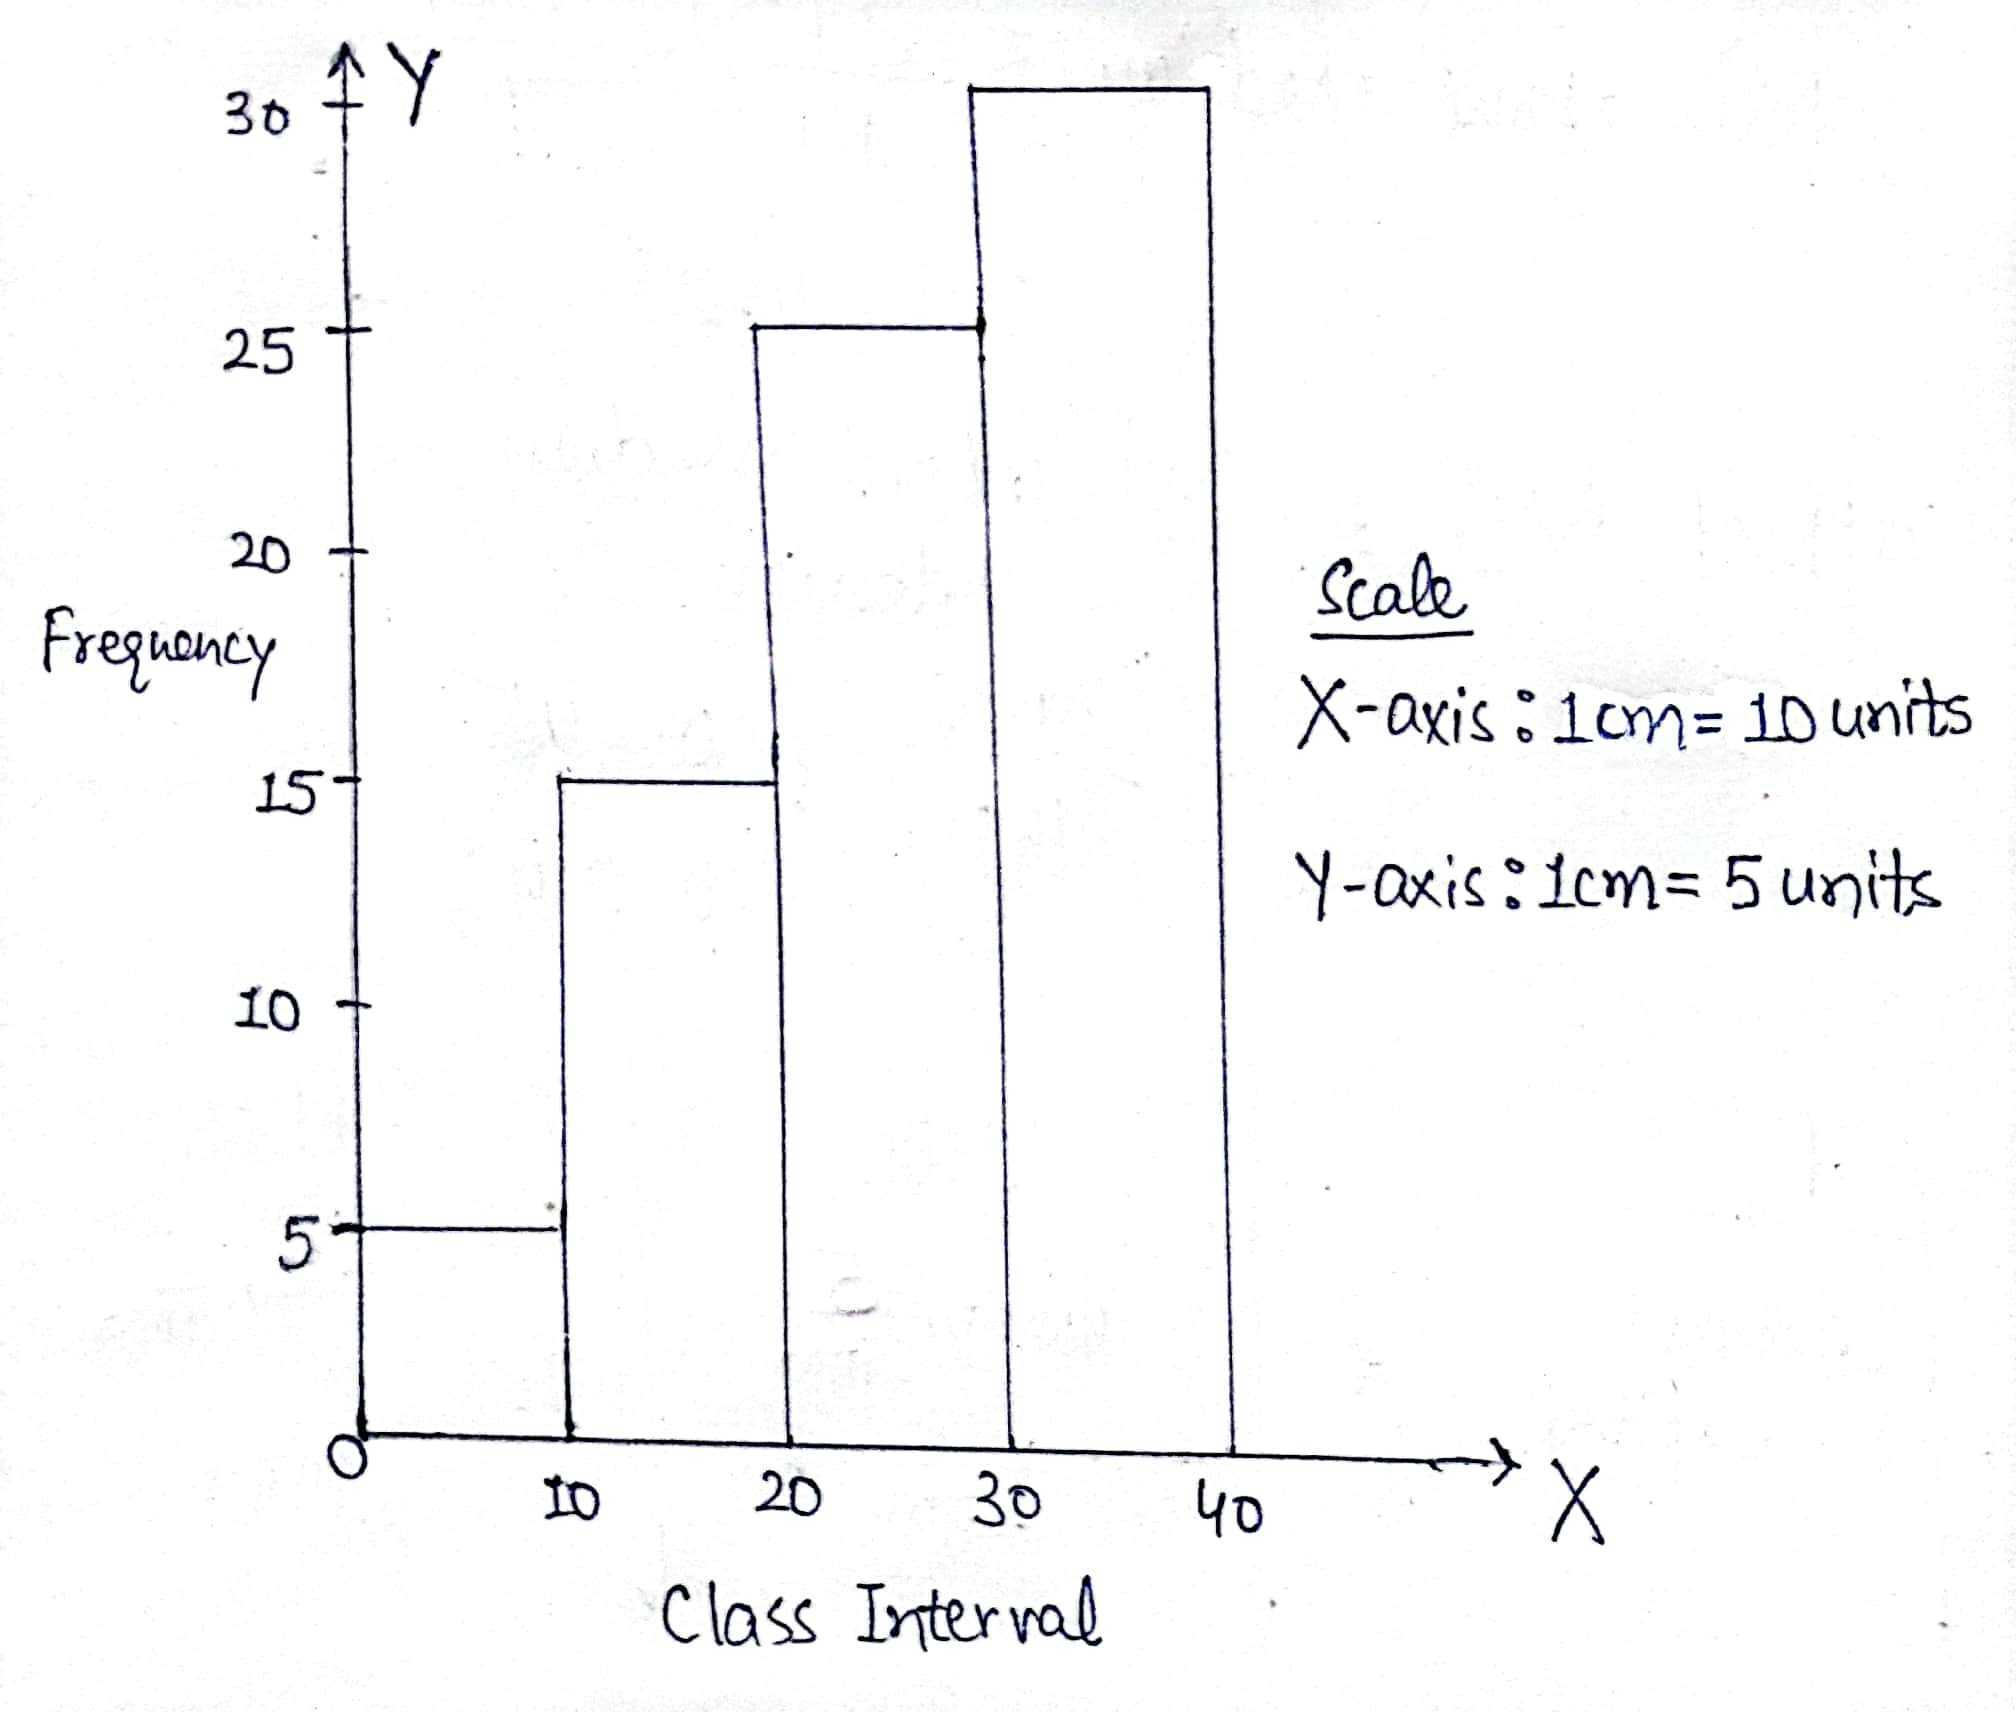
Prepare a histogram from the following data:
| Class | 0-10 | 10-20 | 20-30 | 30-40 |
| Frequency | 5 | 15 | 25 | 30 |
Draw a histogram for the following data on a graph paper.
| Class Interval | Frequency |
| 20-40 | 5 |
| 40-60 | 8 |
| 60-80 | 12 |
| 80-100 | 15 |
| 100-120 | 14 |
| 120-140 | 7 |
| 140-160 | 4 |

Construct a pie diagram from the following data:
| Items | Expenditure (%) |
| Labour | 20 |
| Bricks | 15 |
| Cement | 25 |
| Steel | 10 |
| Timber | 20 |
| Supervision | 10 |
| Items | Expenditure (%) | Central Angle = (Expenditure/Total x 100) |
| Labour | 20 | 72⁰ |
| Bricks | 15 | 54⁰ |
| Cement | 25 | 90⁰ |
| Steel | 10 | 36⁰ |
| Timber | 20 | 72⁰ |
| Supervision | 10 | 36⁰ |
| Total | 100 | 360⁰ |

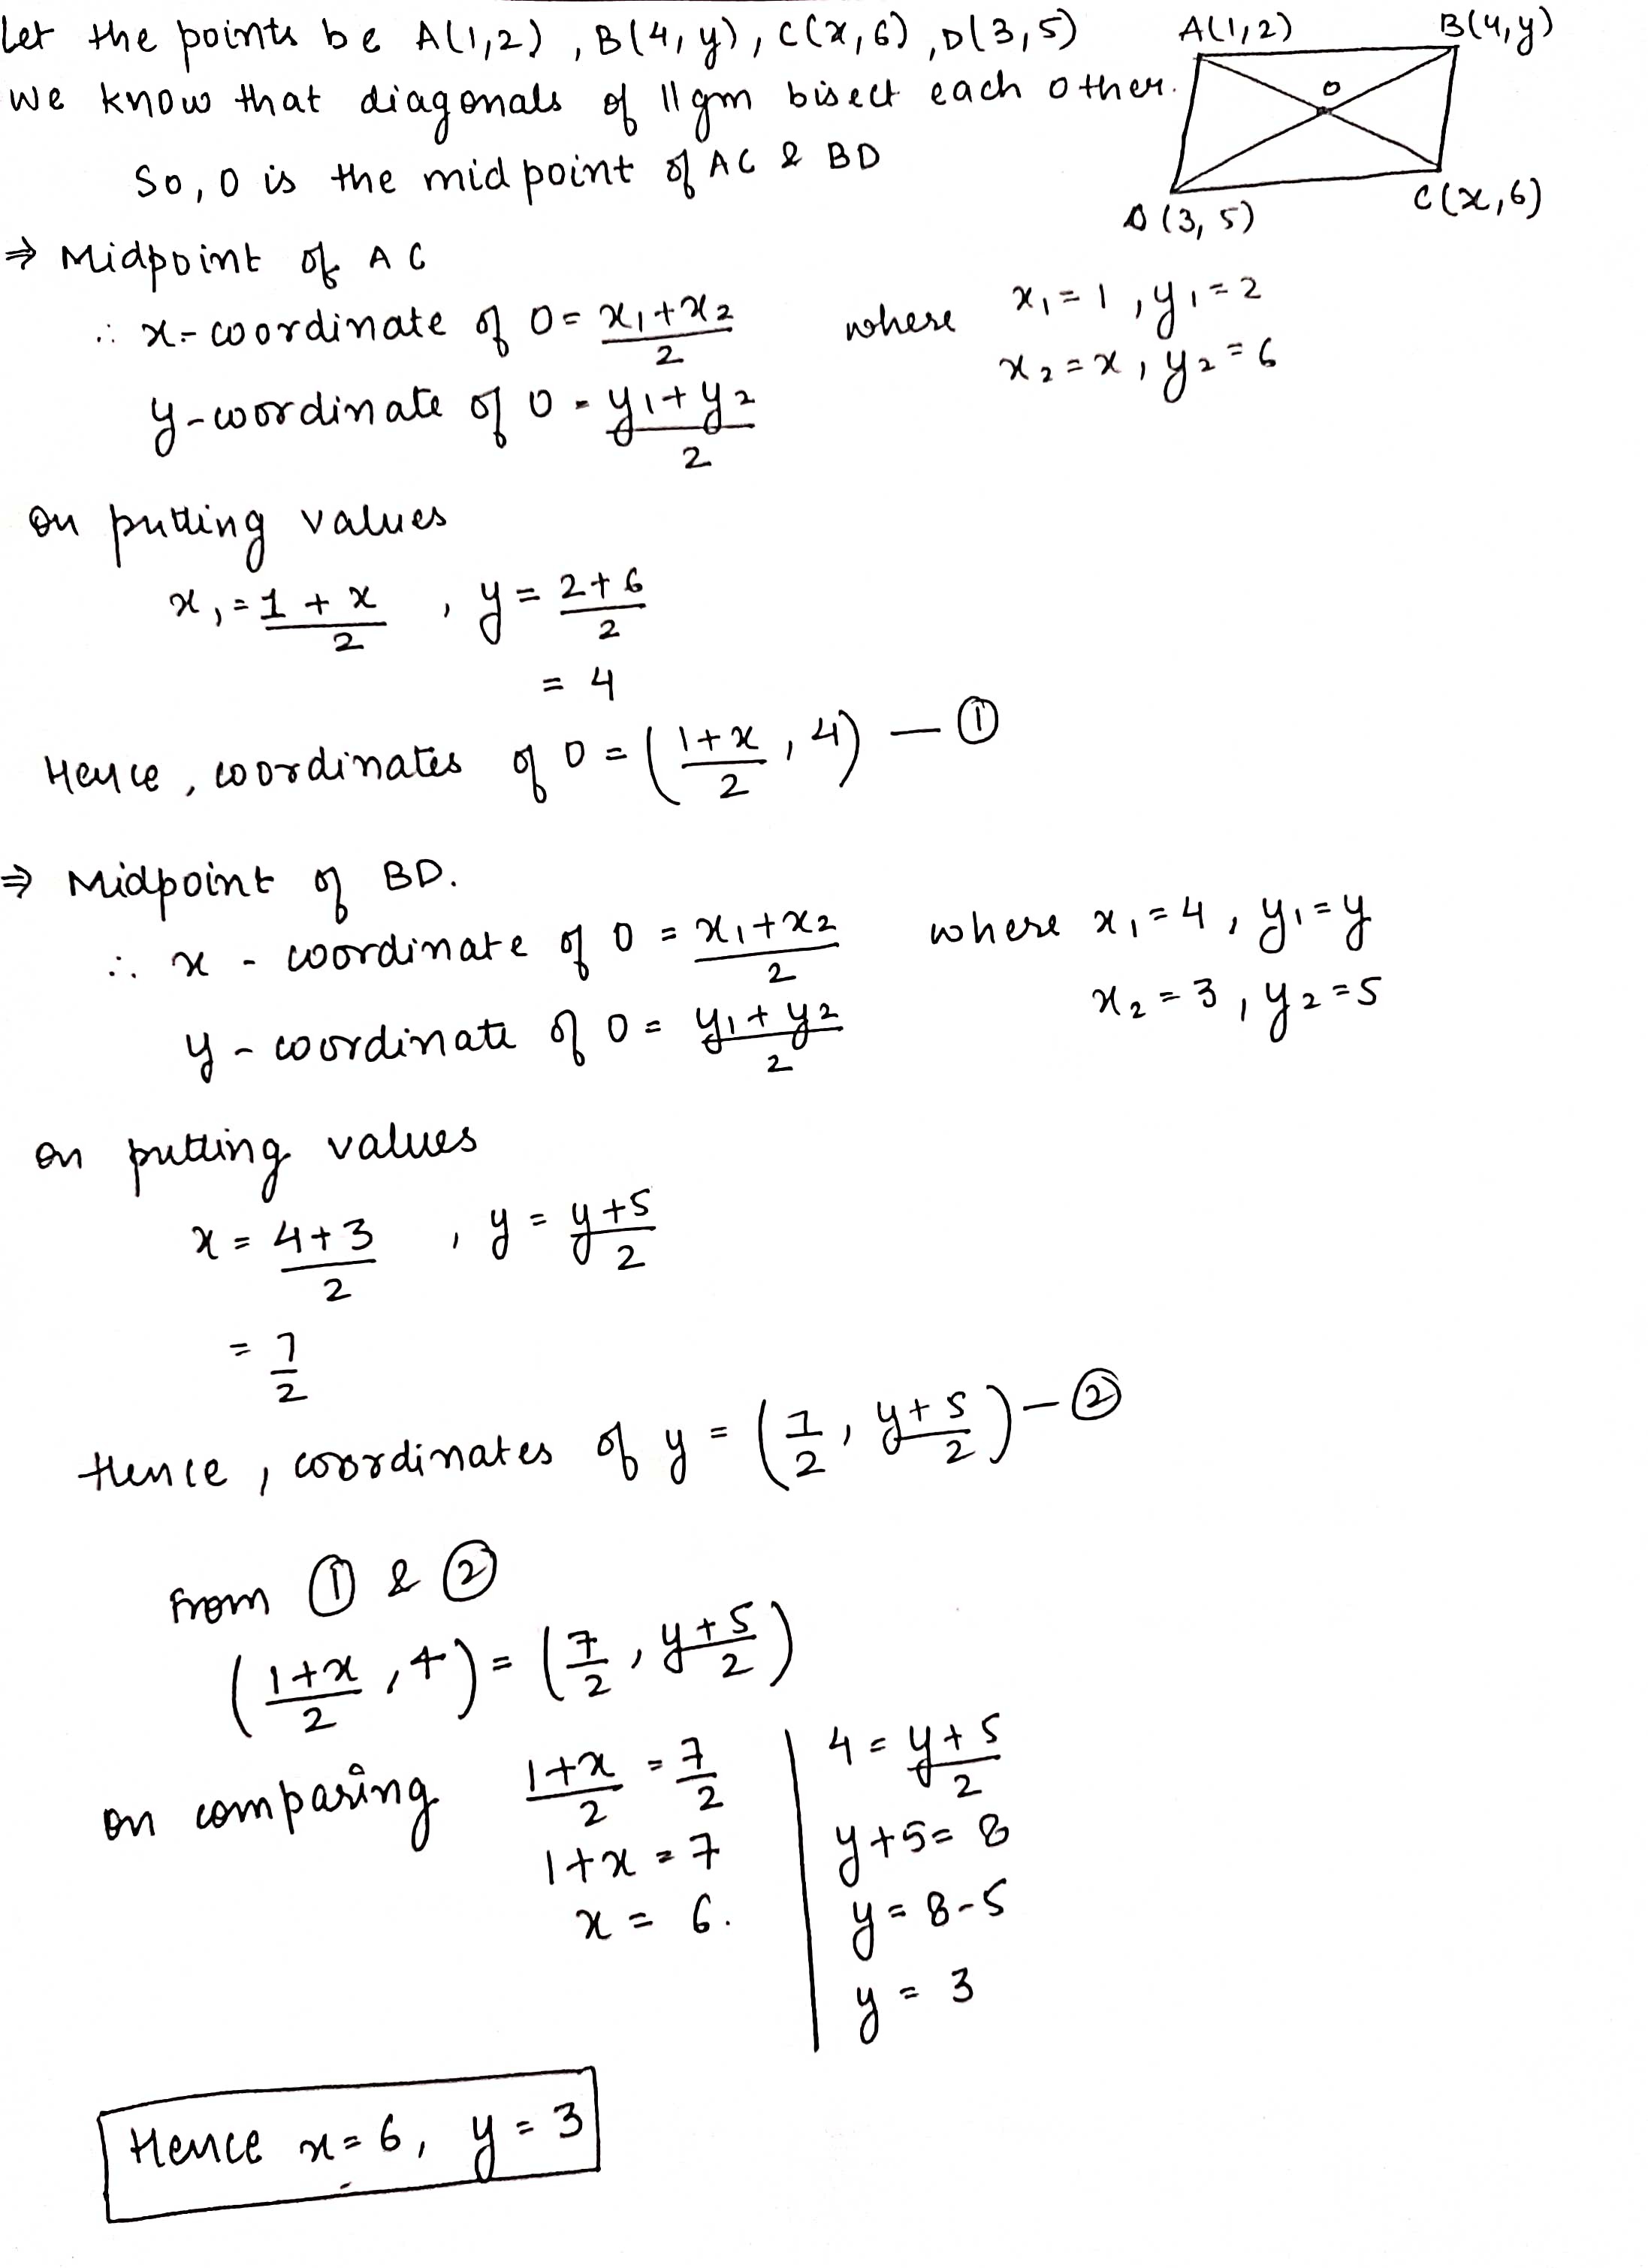
if (1,2),(4,y),(x,6) and(3,5) are the vertices of parallelogram taken in order , find x and y.
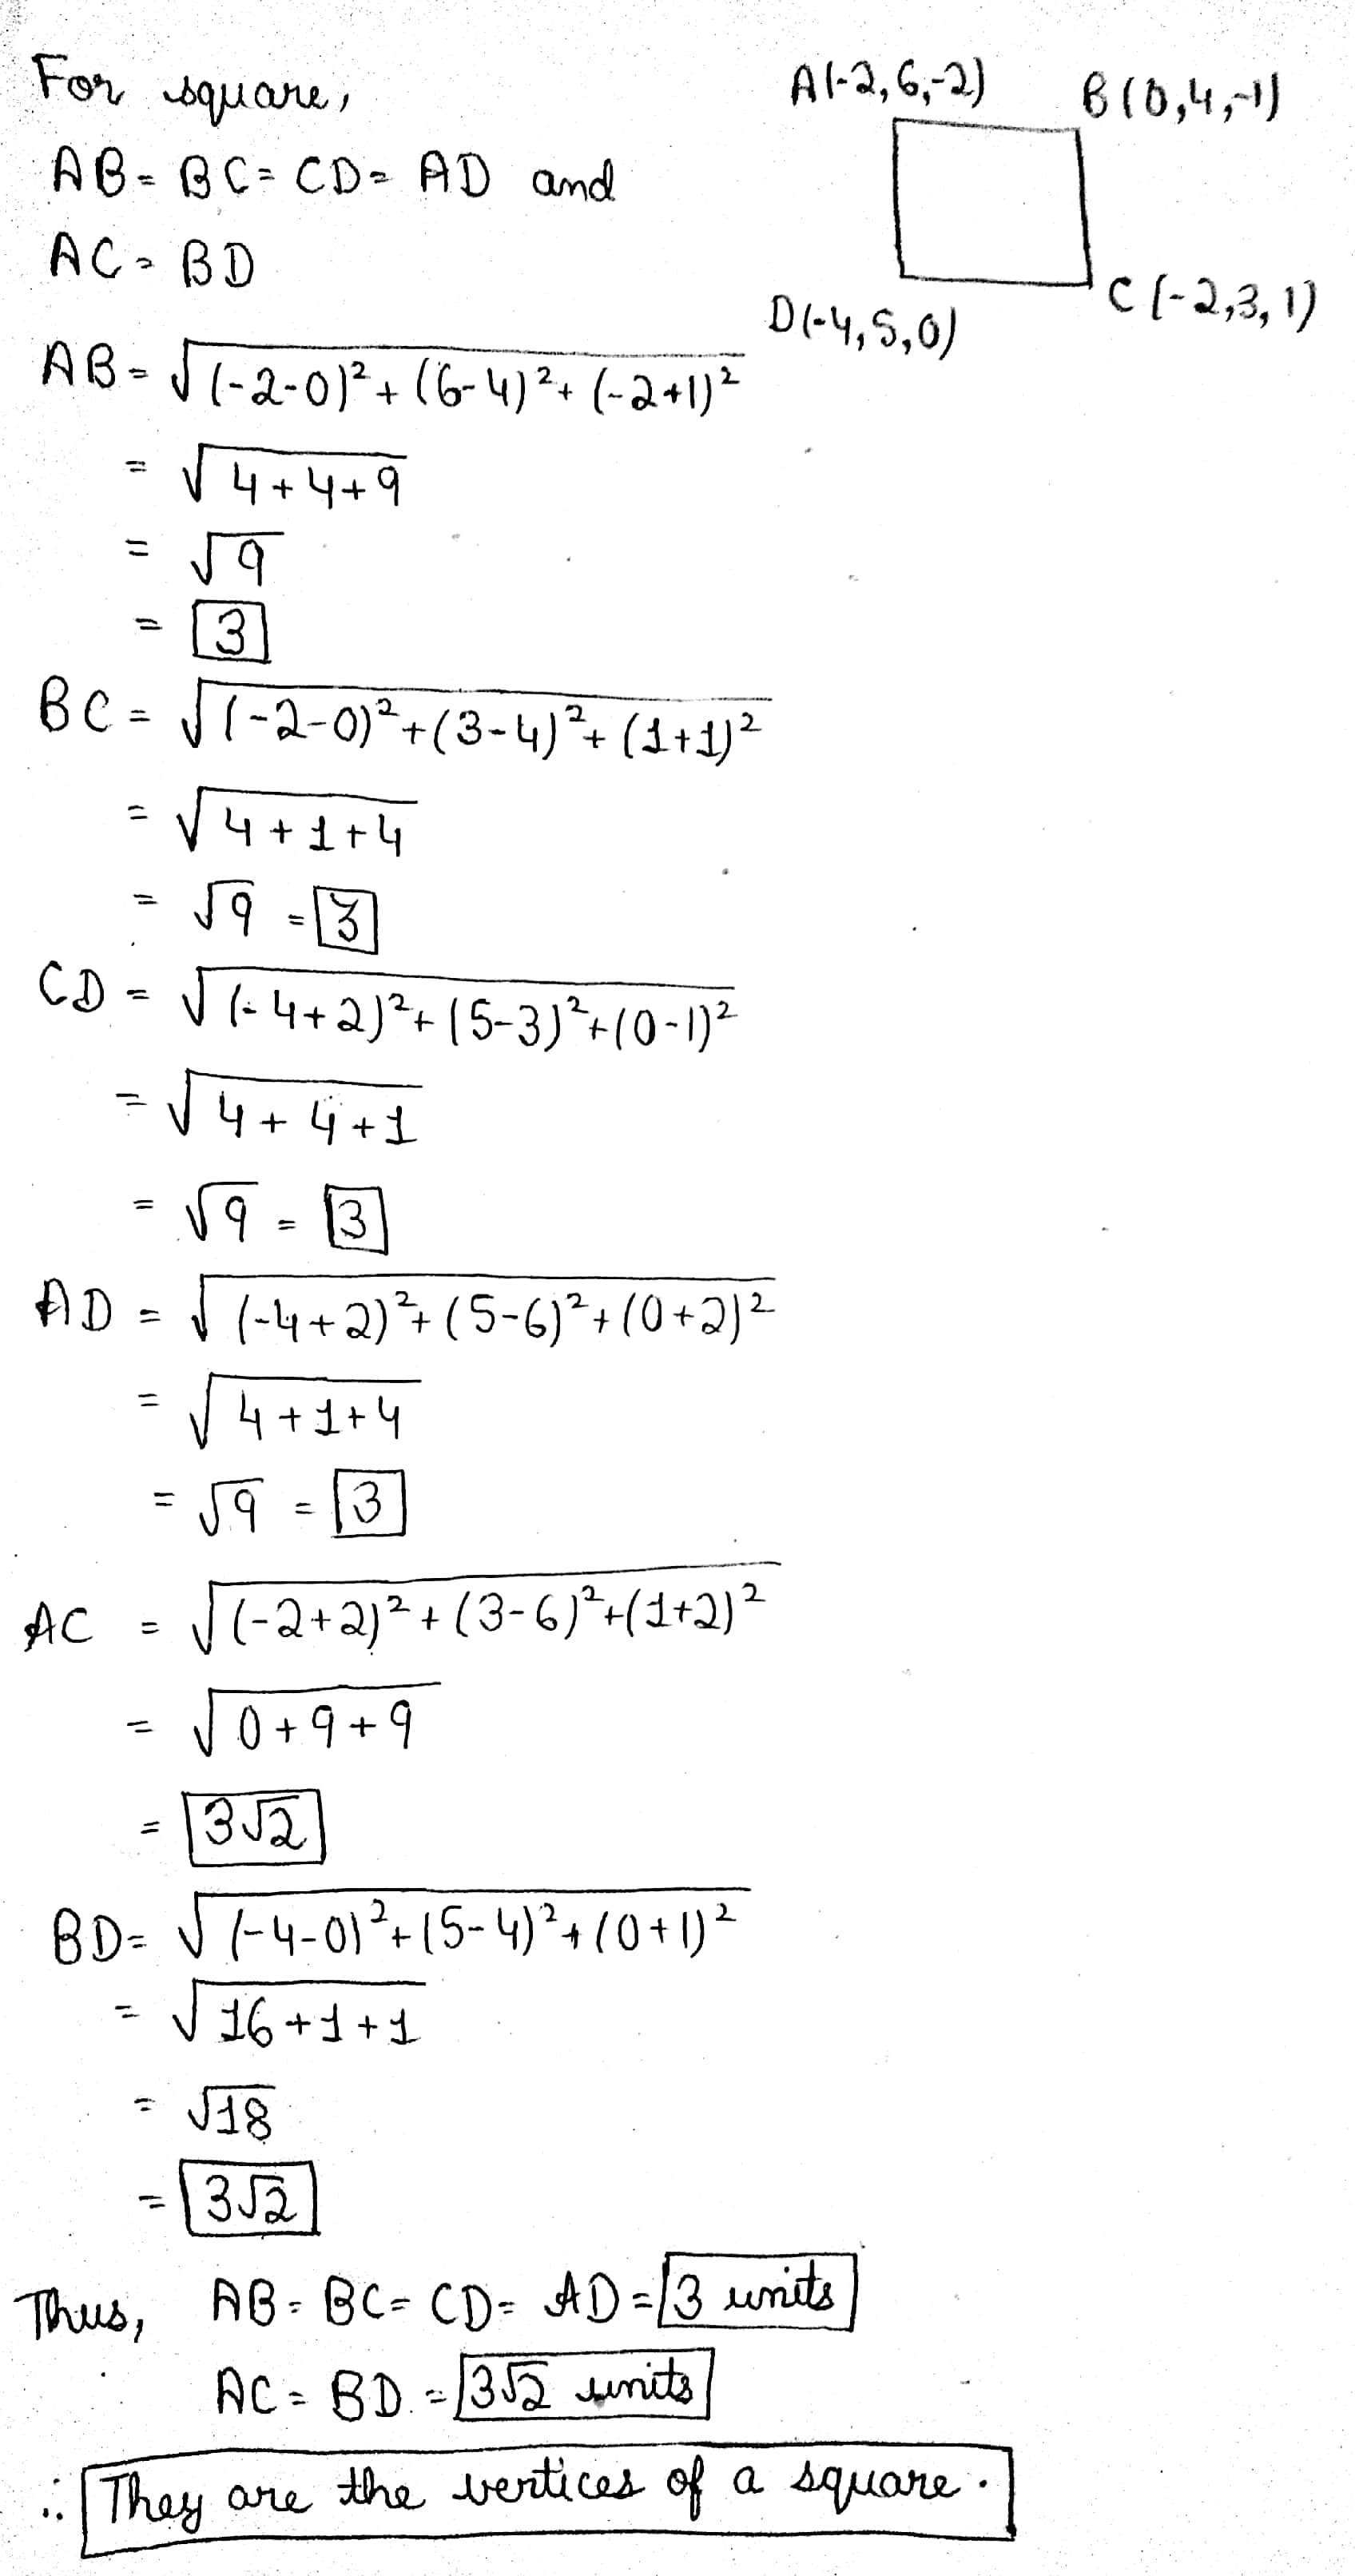
Show that the points $$(-2, 6, -2), (0, 4, -1), (-2, 3, 1)$$ and $$(-4, 5, 0)$$ are the vertices of a square.
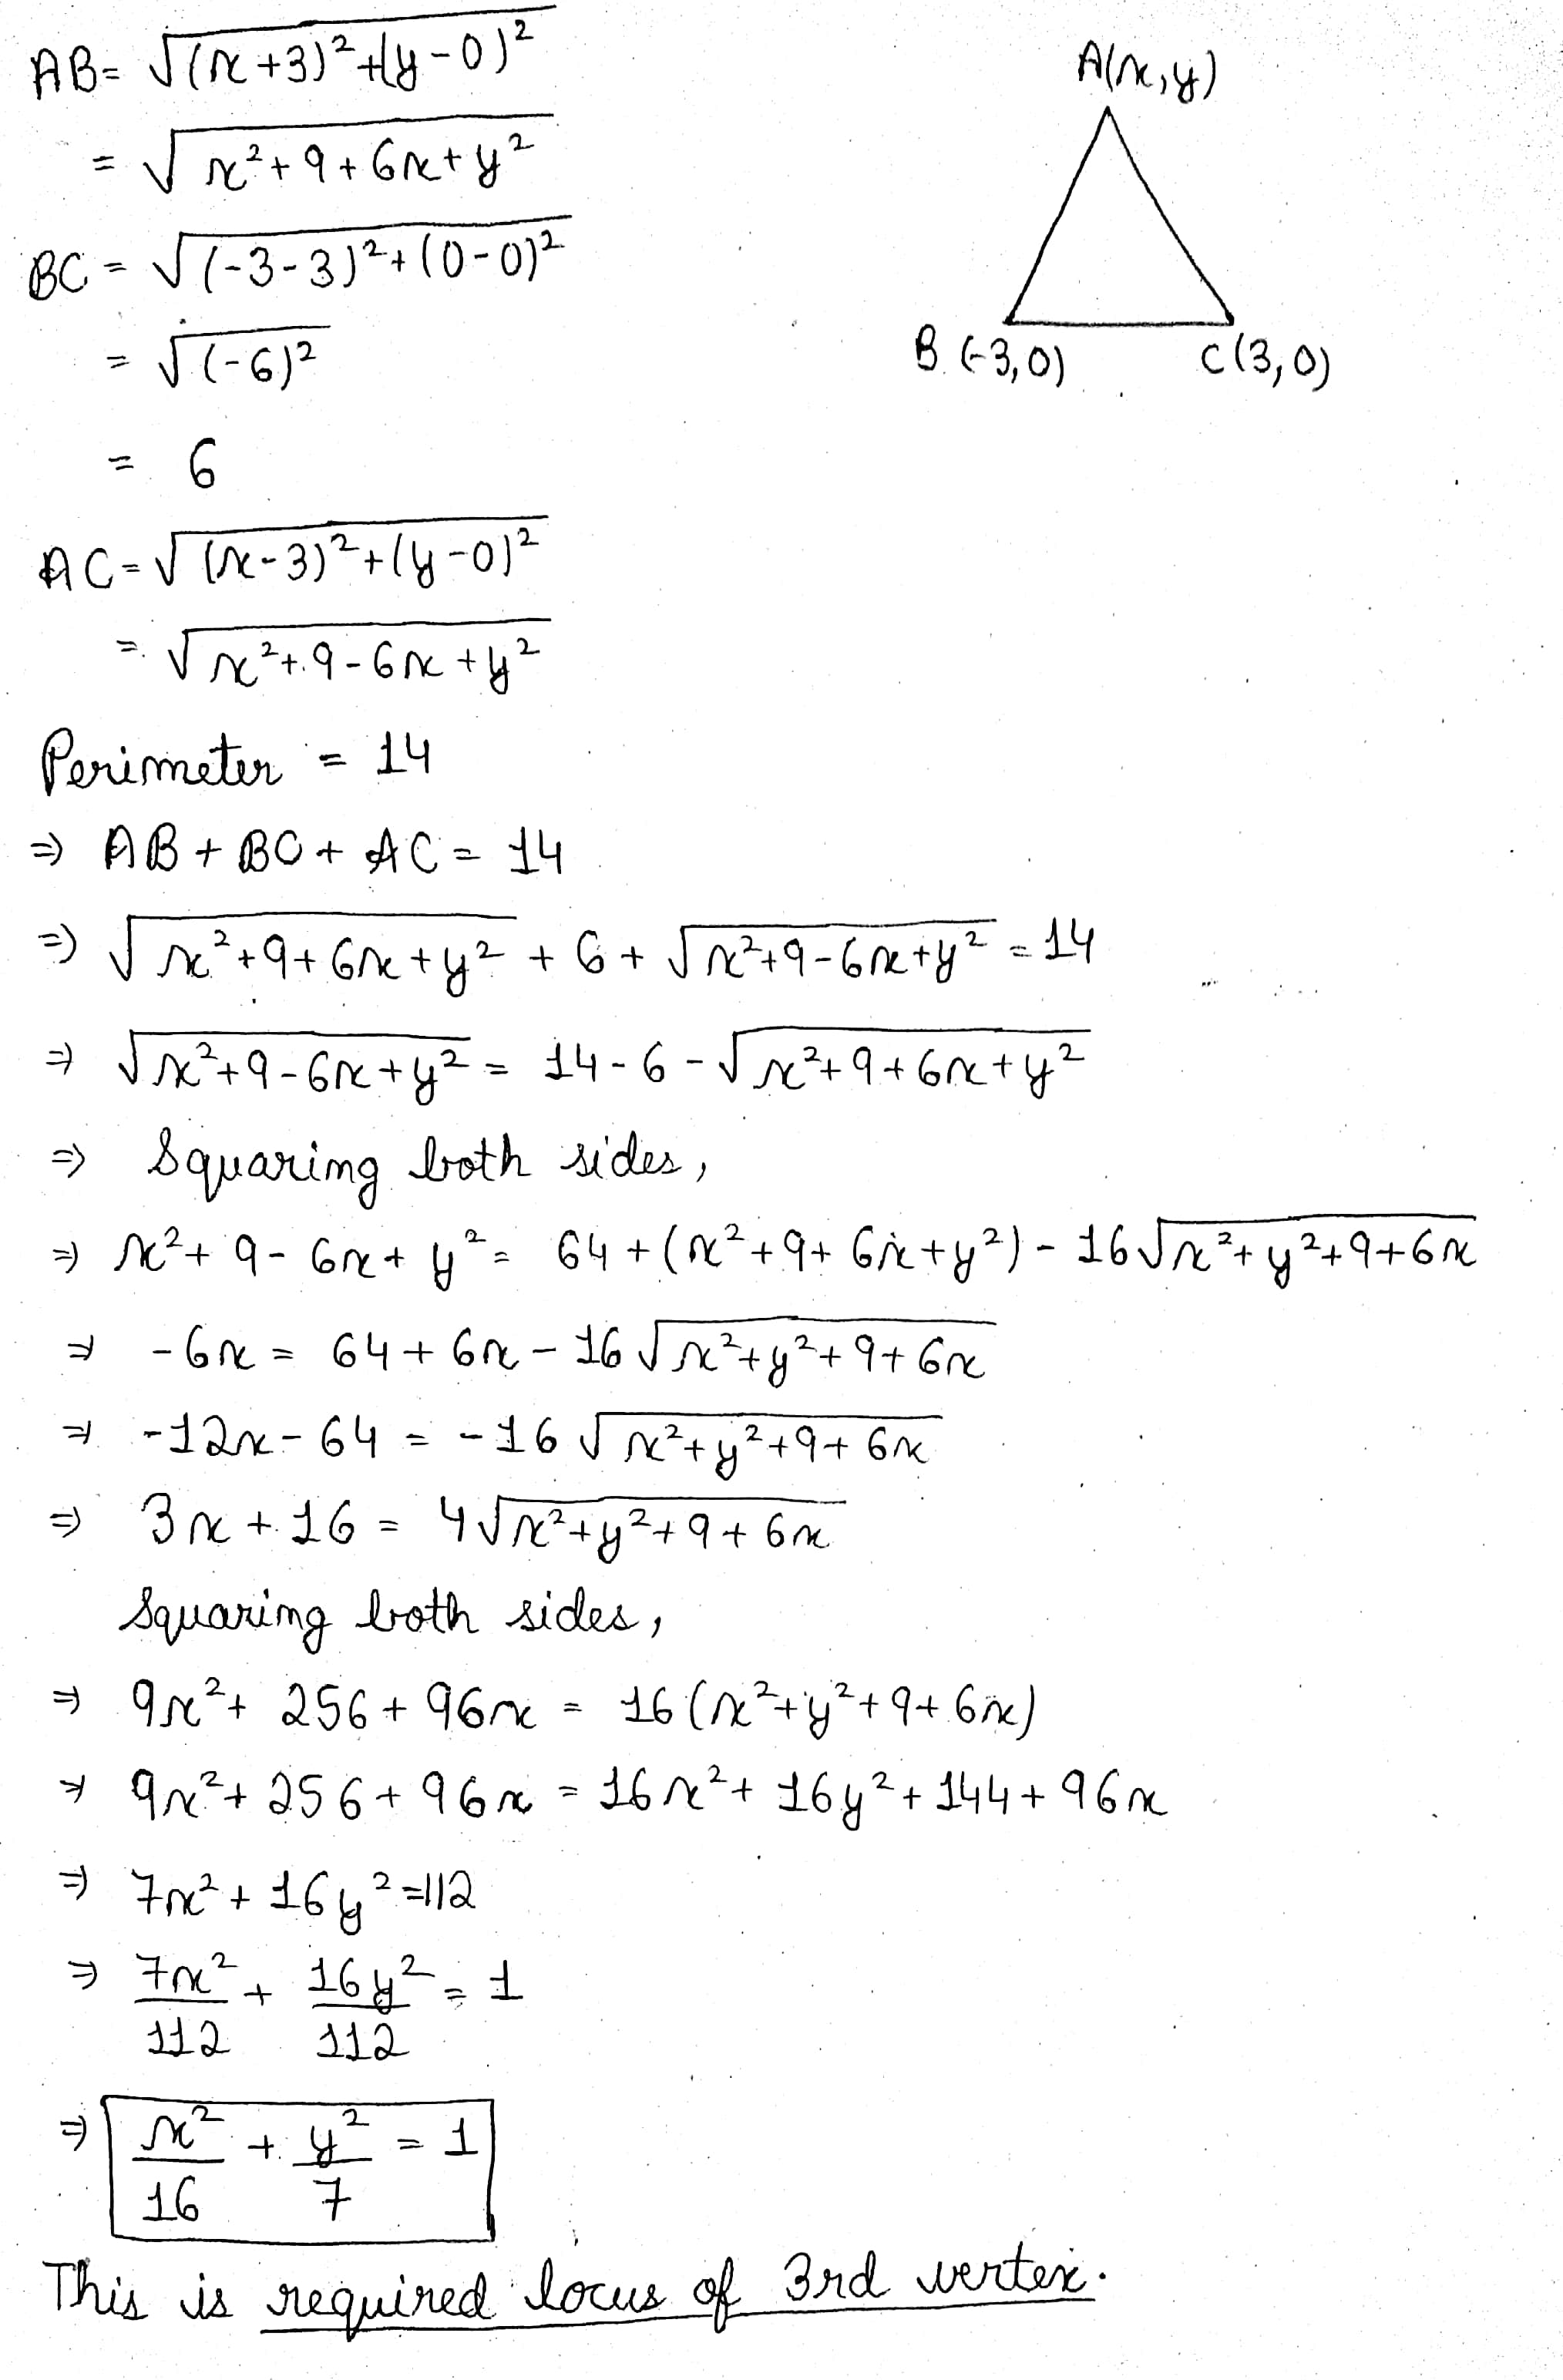
the perimeter of triangle is 14 and two of its vertices are$$(-3,0) (3,0)$$ then the locus of the 3rd vertex is
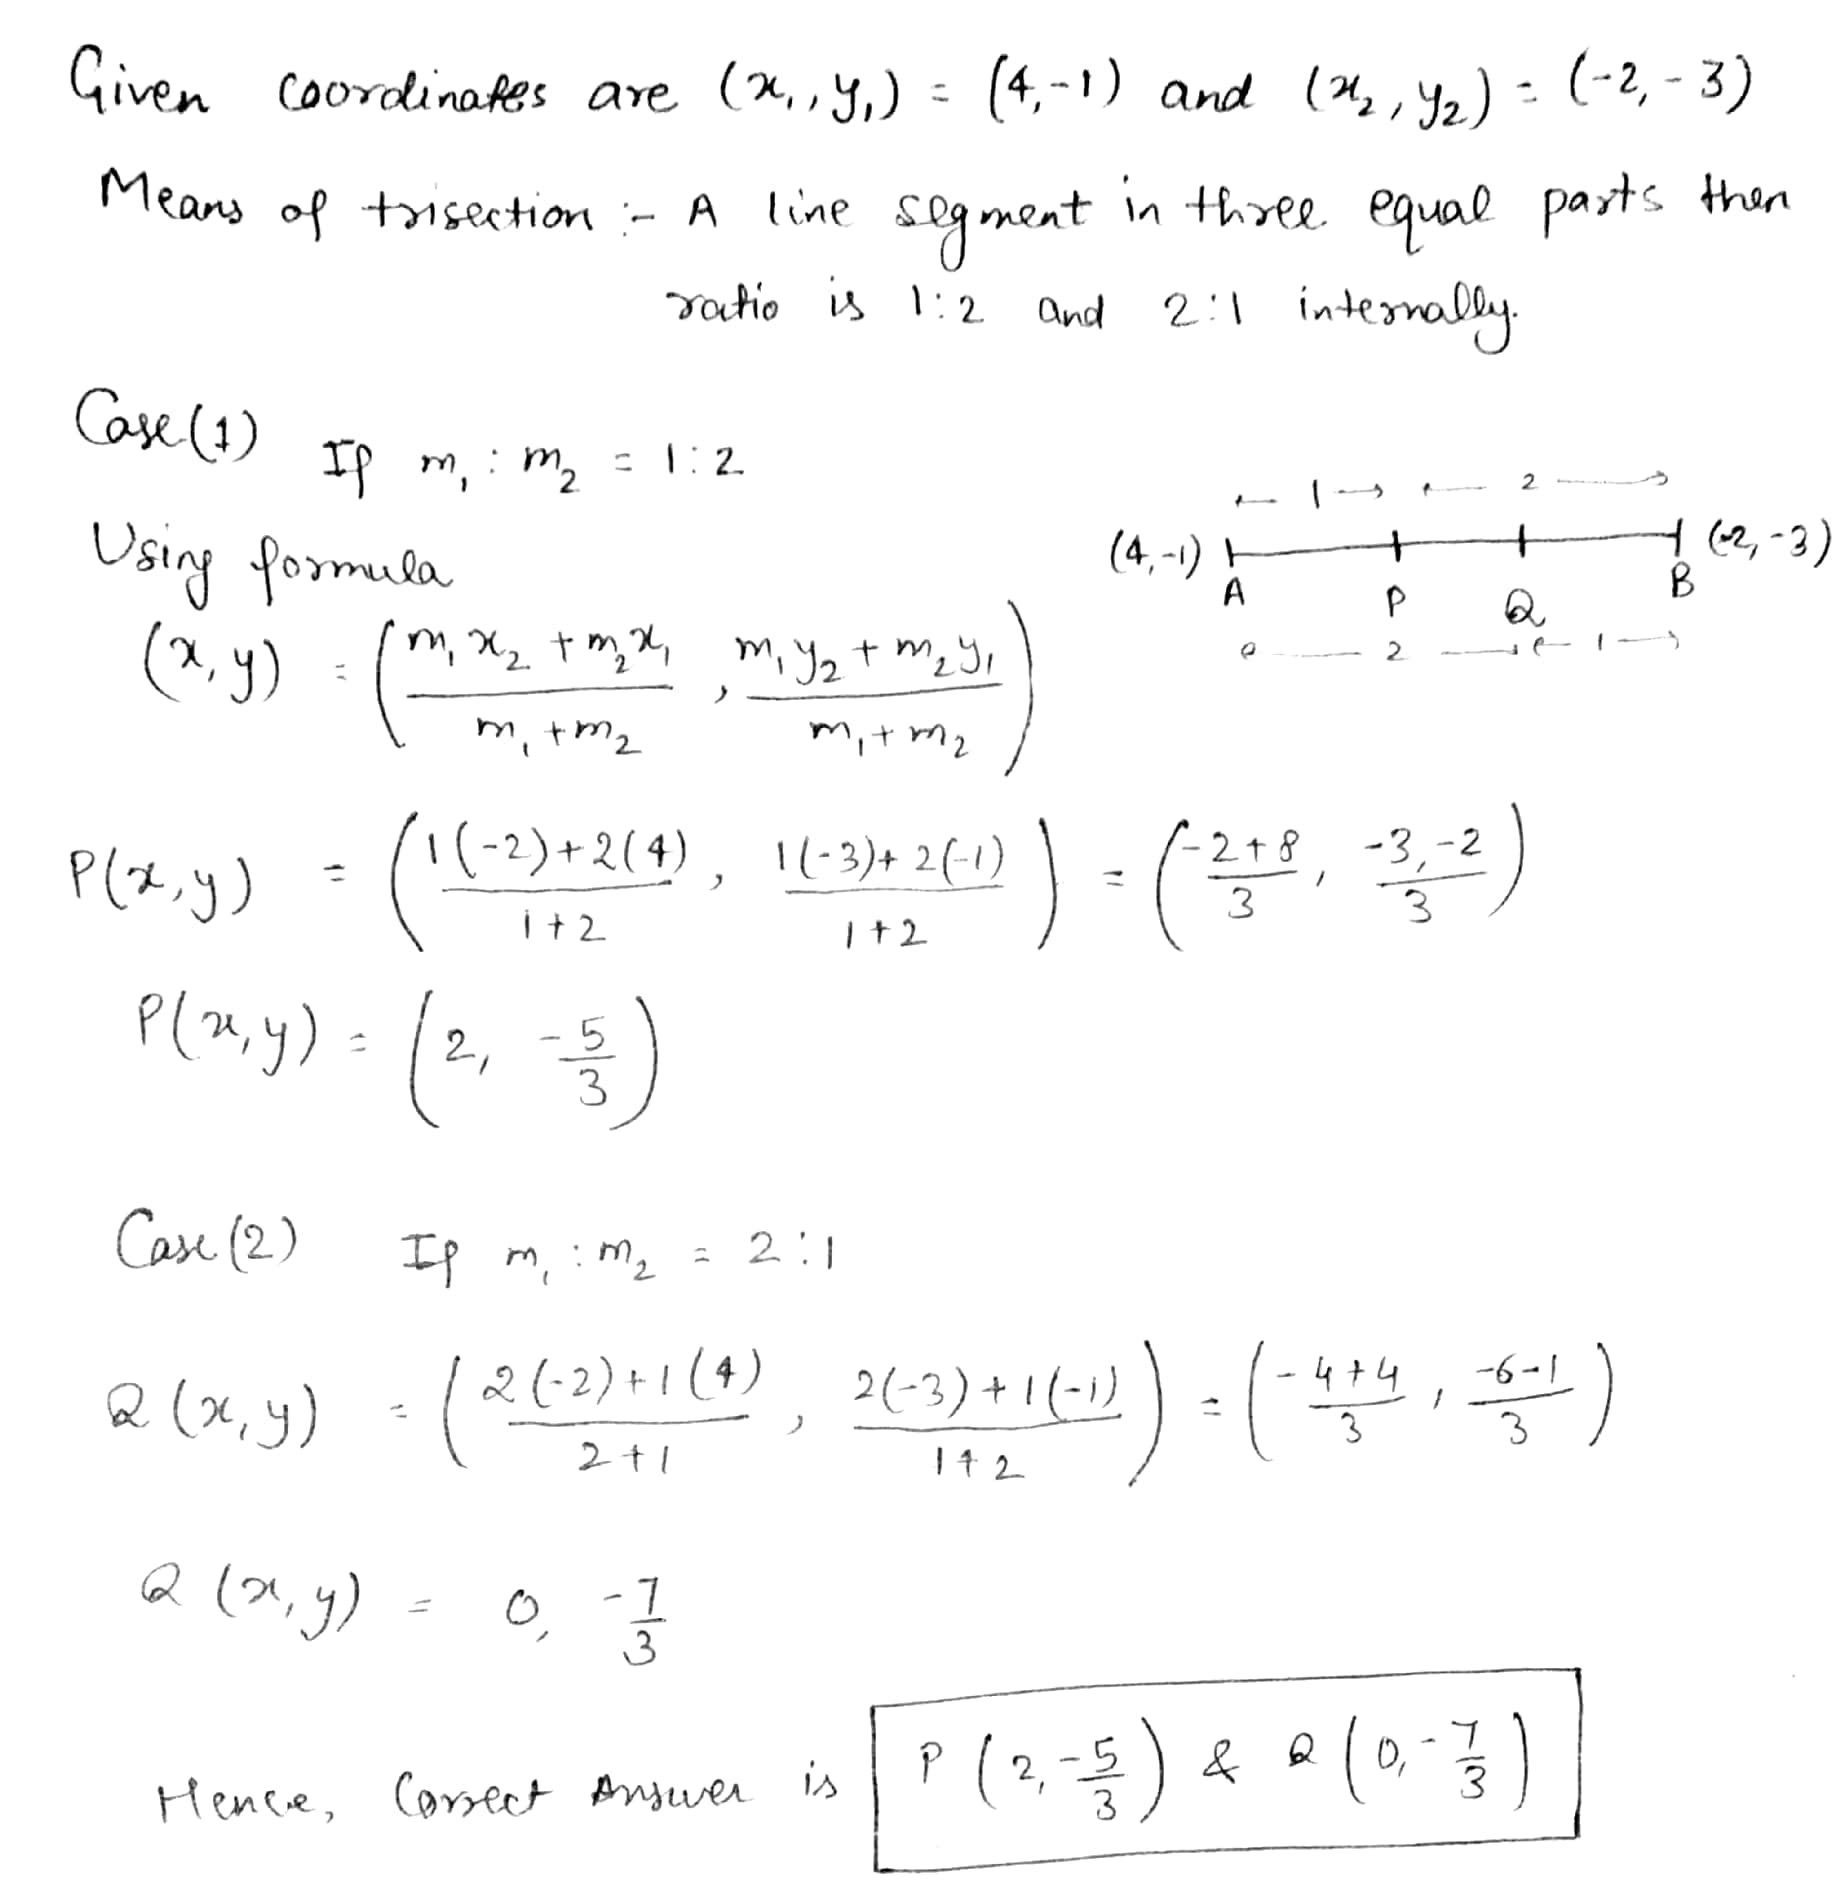
Find the coordinate of the points of trisection of the line segment joining $$(-2, -3)$$ and $$(4, -1)$$
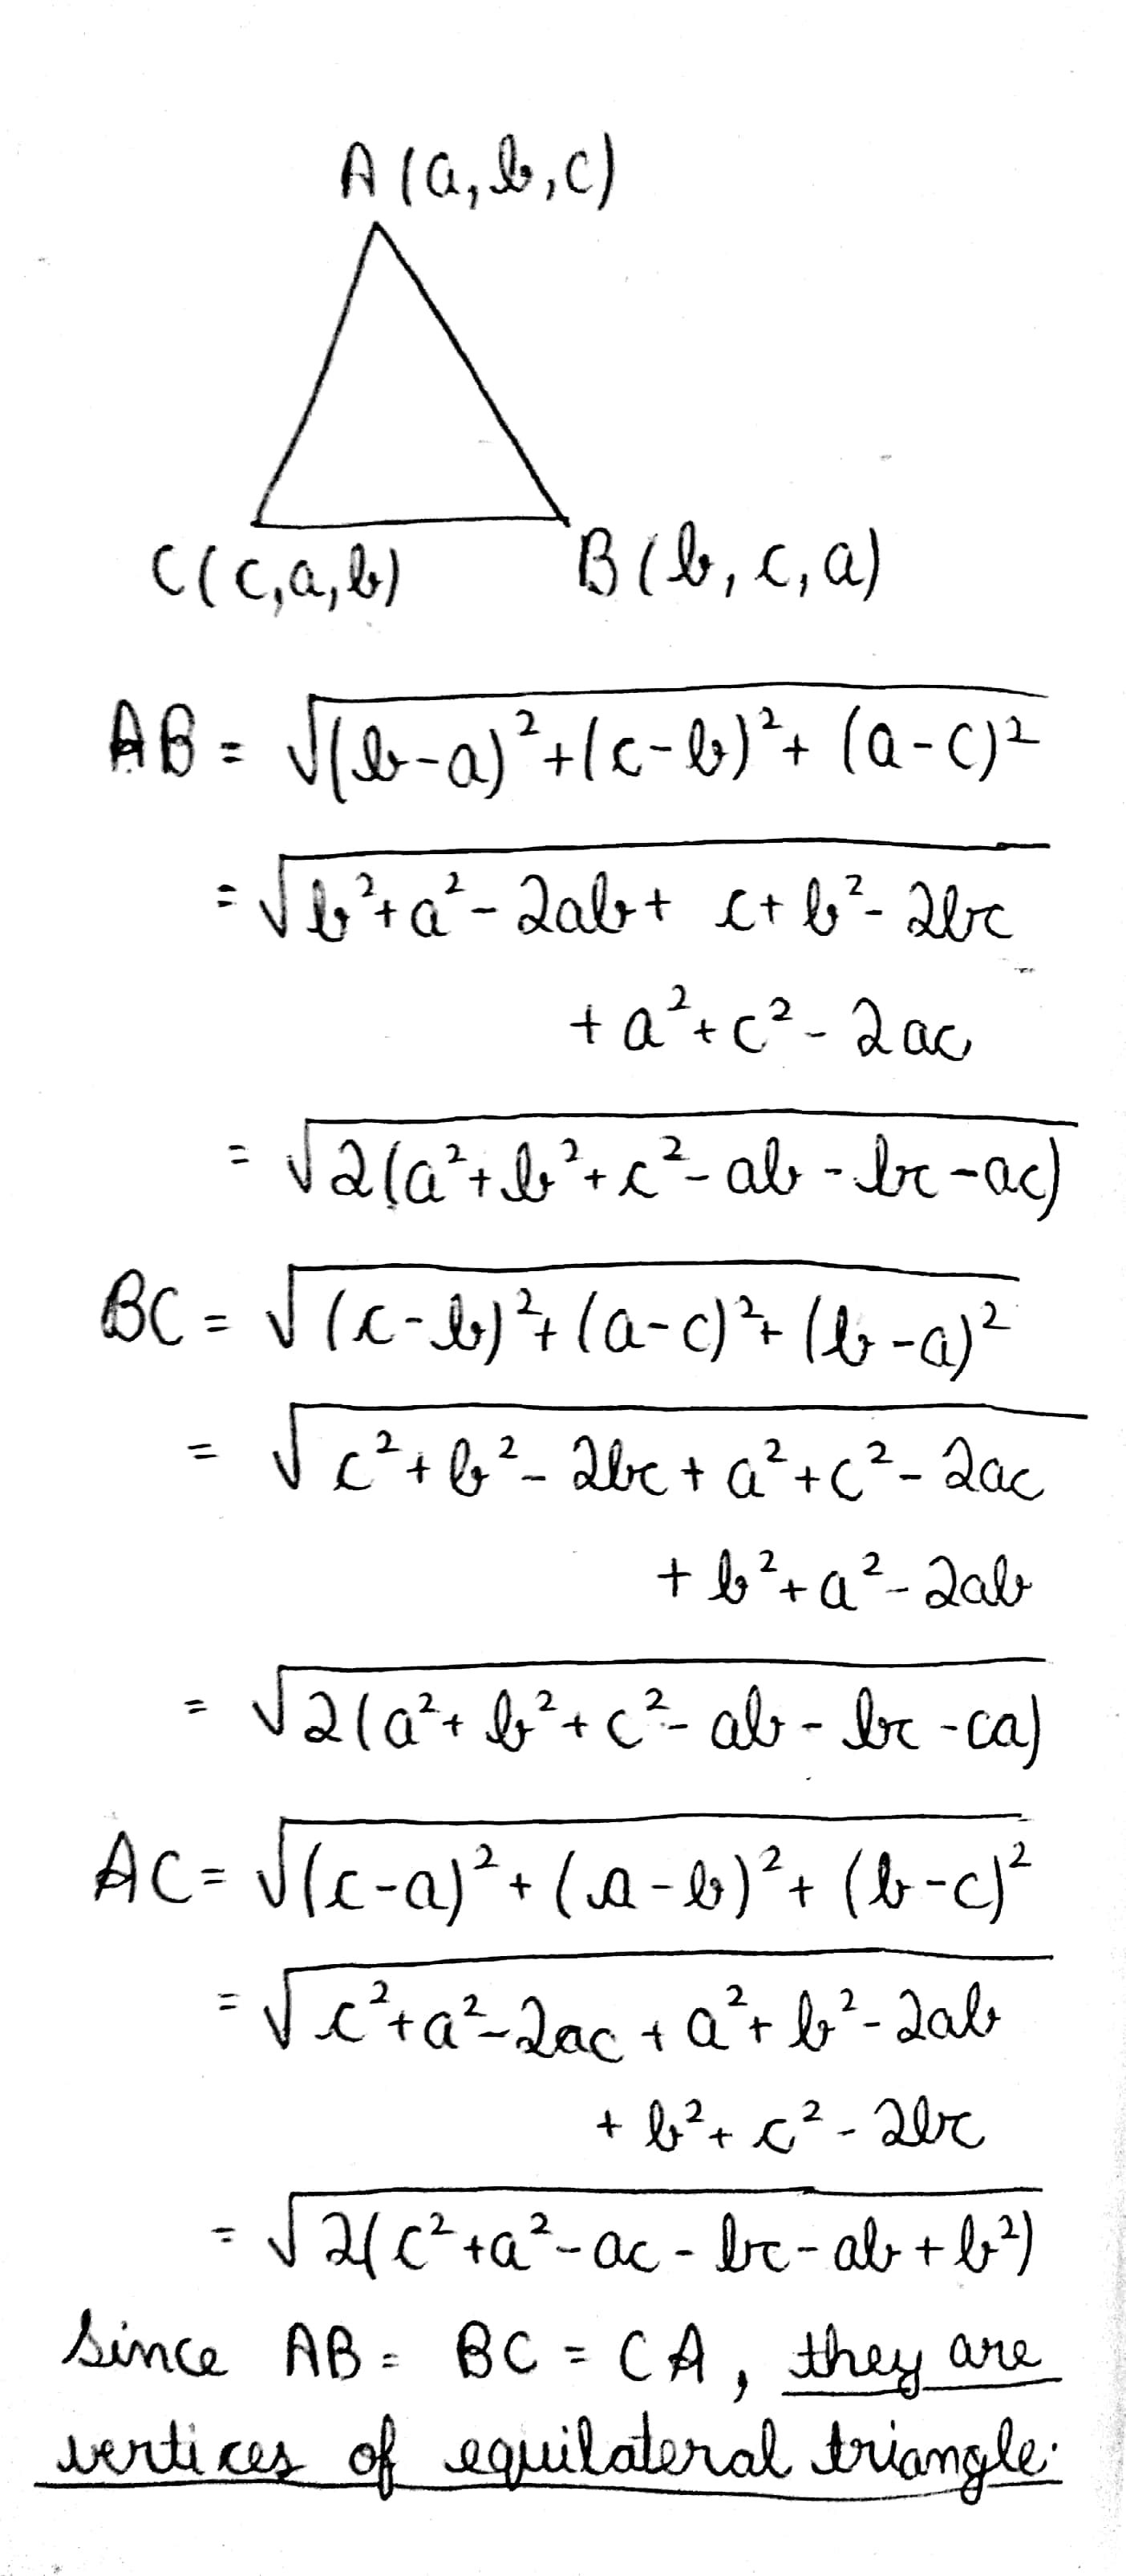
Show that the points (a,b,c), (b,c,a) and (c,a,b) are the vertices of an equilateral triangle.
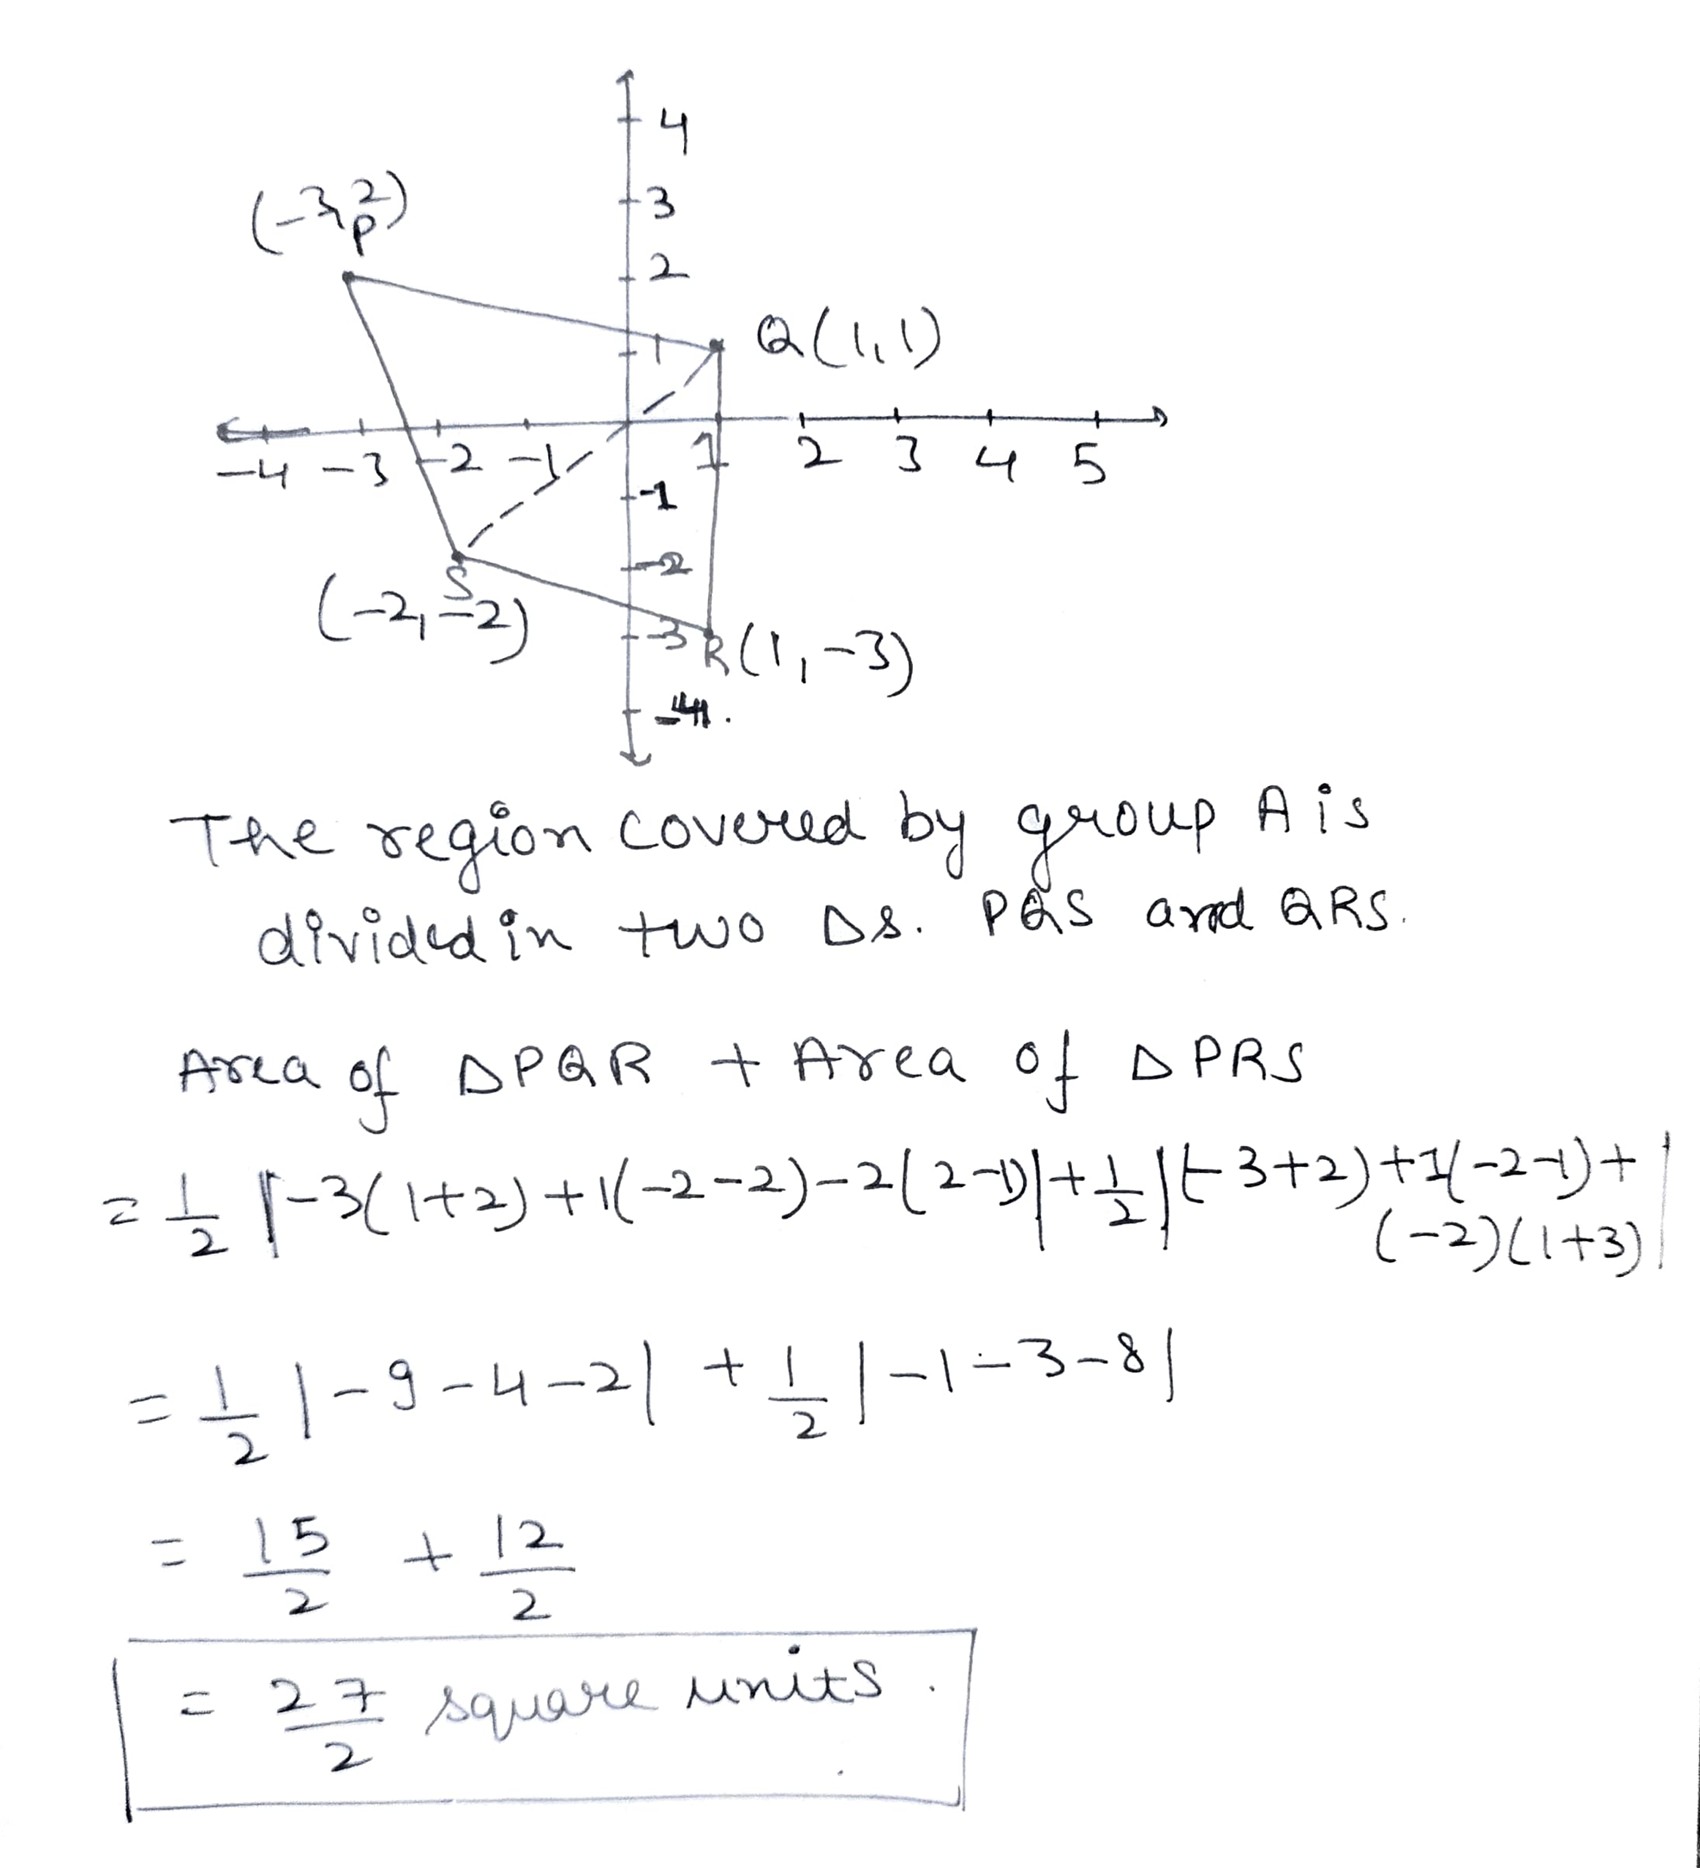
The students of class X of a school undertake to work for the campaign ' Say no to plastic' in a city. They took the map of the city and form coordinate plane on it to divide their areas. Group A took the region covered between the coordinates $$(1, 1), (-3, 2), (-2, -2)$$ and (1, -3) taken in order. Find the area of the region covered by group A.
A $$(3,4)\ \&\ C (1, -1)$$ are the two opposite angular points of a square ABCD. Find the co-ordinates of the other two vertices.
Find the value of k, if slope of line passing through $$ \mathrm{P}(k, 3) $$
and $$ Q(1,2) $$ is $$ -\frac{1}{3} $$.
Prove that the points (2, -1), (0, 2), (2, 3) and (4, 0) are the coordinates of the angular points of a parallelogram and find the angular between its diagonal.
Find the ratio in which the line 2 x + 3 y - 5 = 0 divides the line segment joining the points ( 8 , - 9 ) and ( 2,1 ). Also, find the co-ordinates of the point of division.
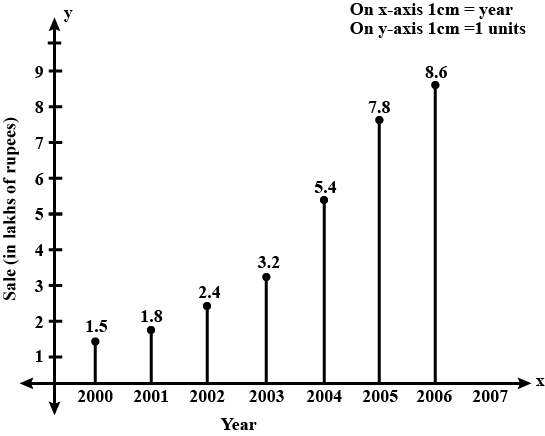
The following table shows the sales of a commodity during the years $$2000$$ to $$2006$$.
| Years | $$2000$$ | $$2001$$ | $$2002$$ | $$2003$$ | $$2004$$ | $$2005$$ | $$2006$$ |
| sale(in lakhs of Rs) | $$1.5$$ | $$1.8$$ | $$2.4$$ | $$3.2$$ | $$5.4$$ | $$7.8$$ | $$8.6$$ |
| year | 2000 | 2001 | 2002 | 2003 | 2004 | 2005 | 2006 |
| Sale (in lakhs of Rs.) | 1.5 | 1.8 | 2.4 | 3.2 | 5.4 | 7.8 | 8.6 |
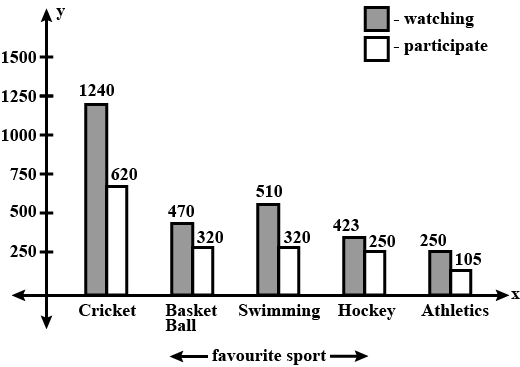
Consider the following data gathered from a survey of a colony:
| Favourate Sport: | Cricket | Basket-Ball | Swimming | Hockey | Athletics |
| Watching | 1240 | 470 | 510 | 423 | 250 |
| Participating | 620 | 320 | 320 | 250 | 105 |
What is more preferred watching or participating in sports?
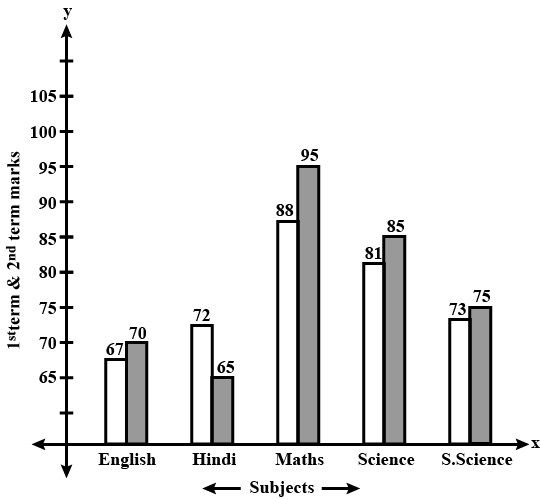
The performance of students in 1 st term and 2nd term is as given below. Draw a double bar graph choosing appropriate scale and answer the following:
| Subject: | English | Hindi | Maths | Science | S.Science |
| $$ 1^{st}$$ term: | 67 | 72 | 88 | 81 | 73 |
| $$ 2^{nd}$$ term: | 70 | 65 | 95 | 85 | 75 |
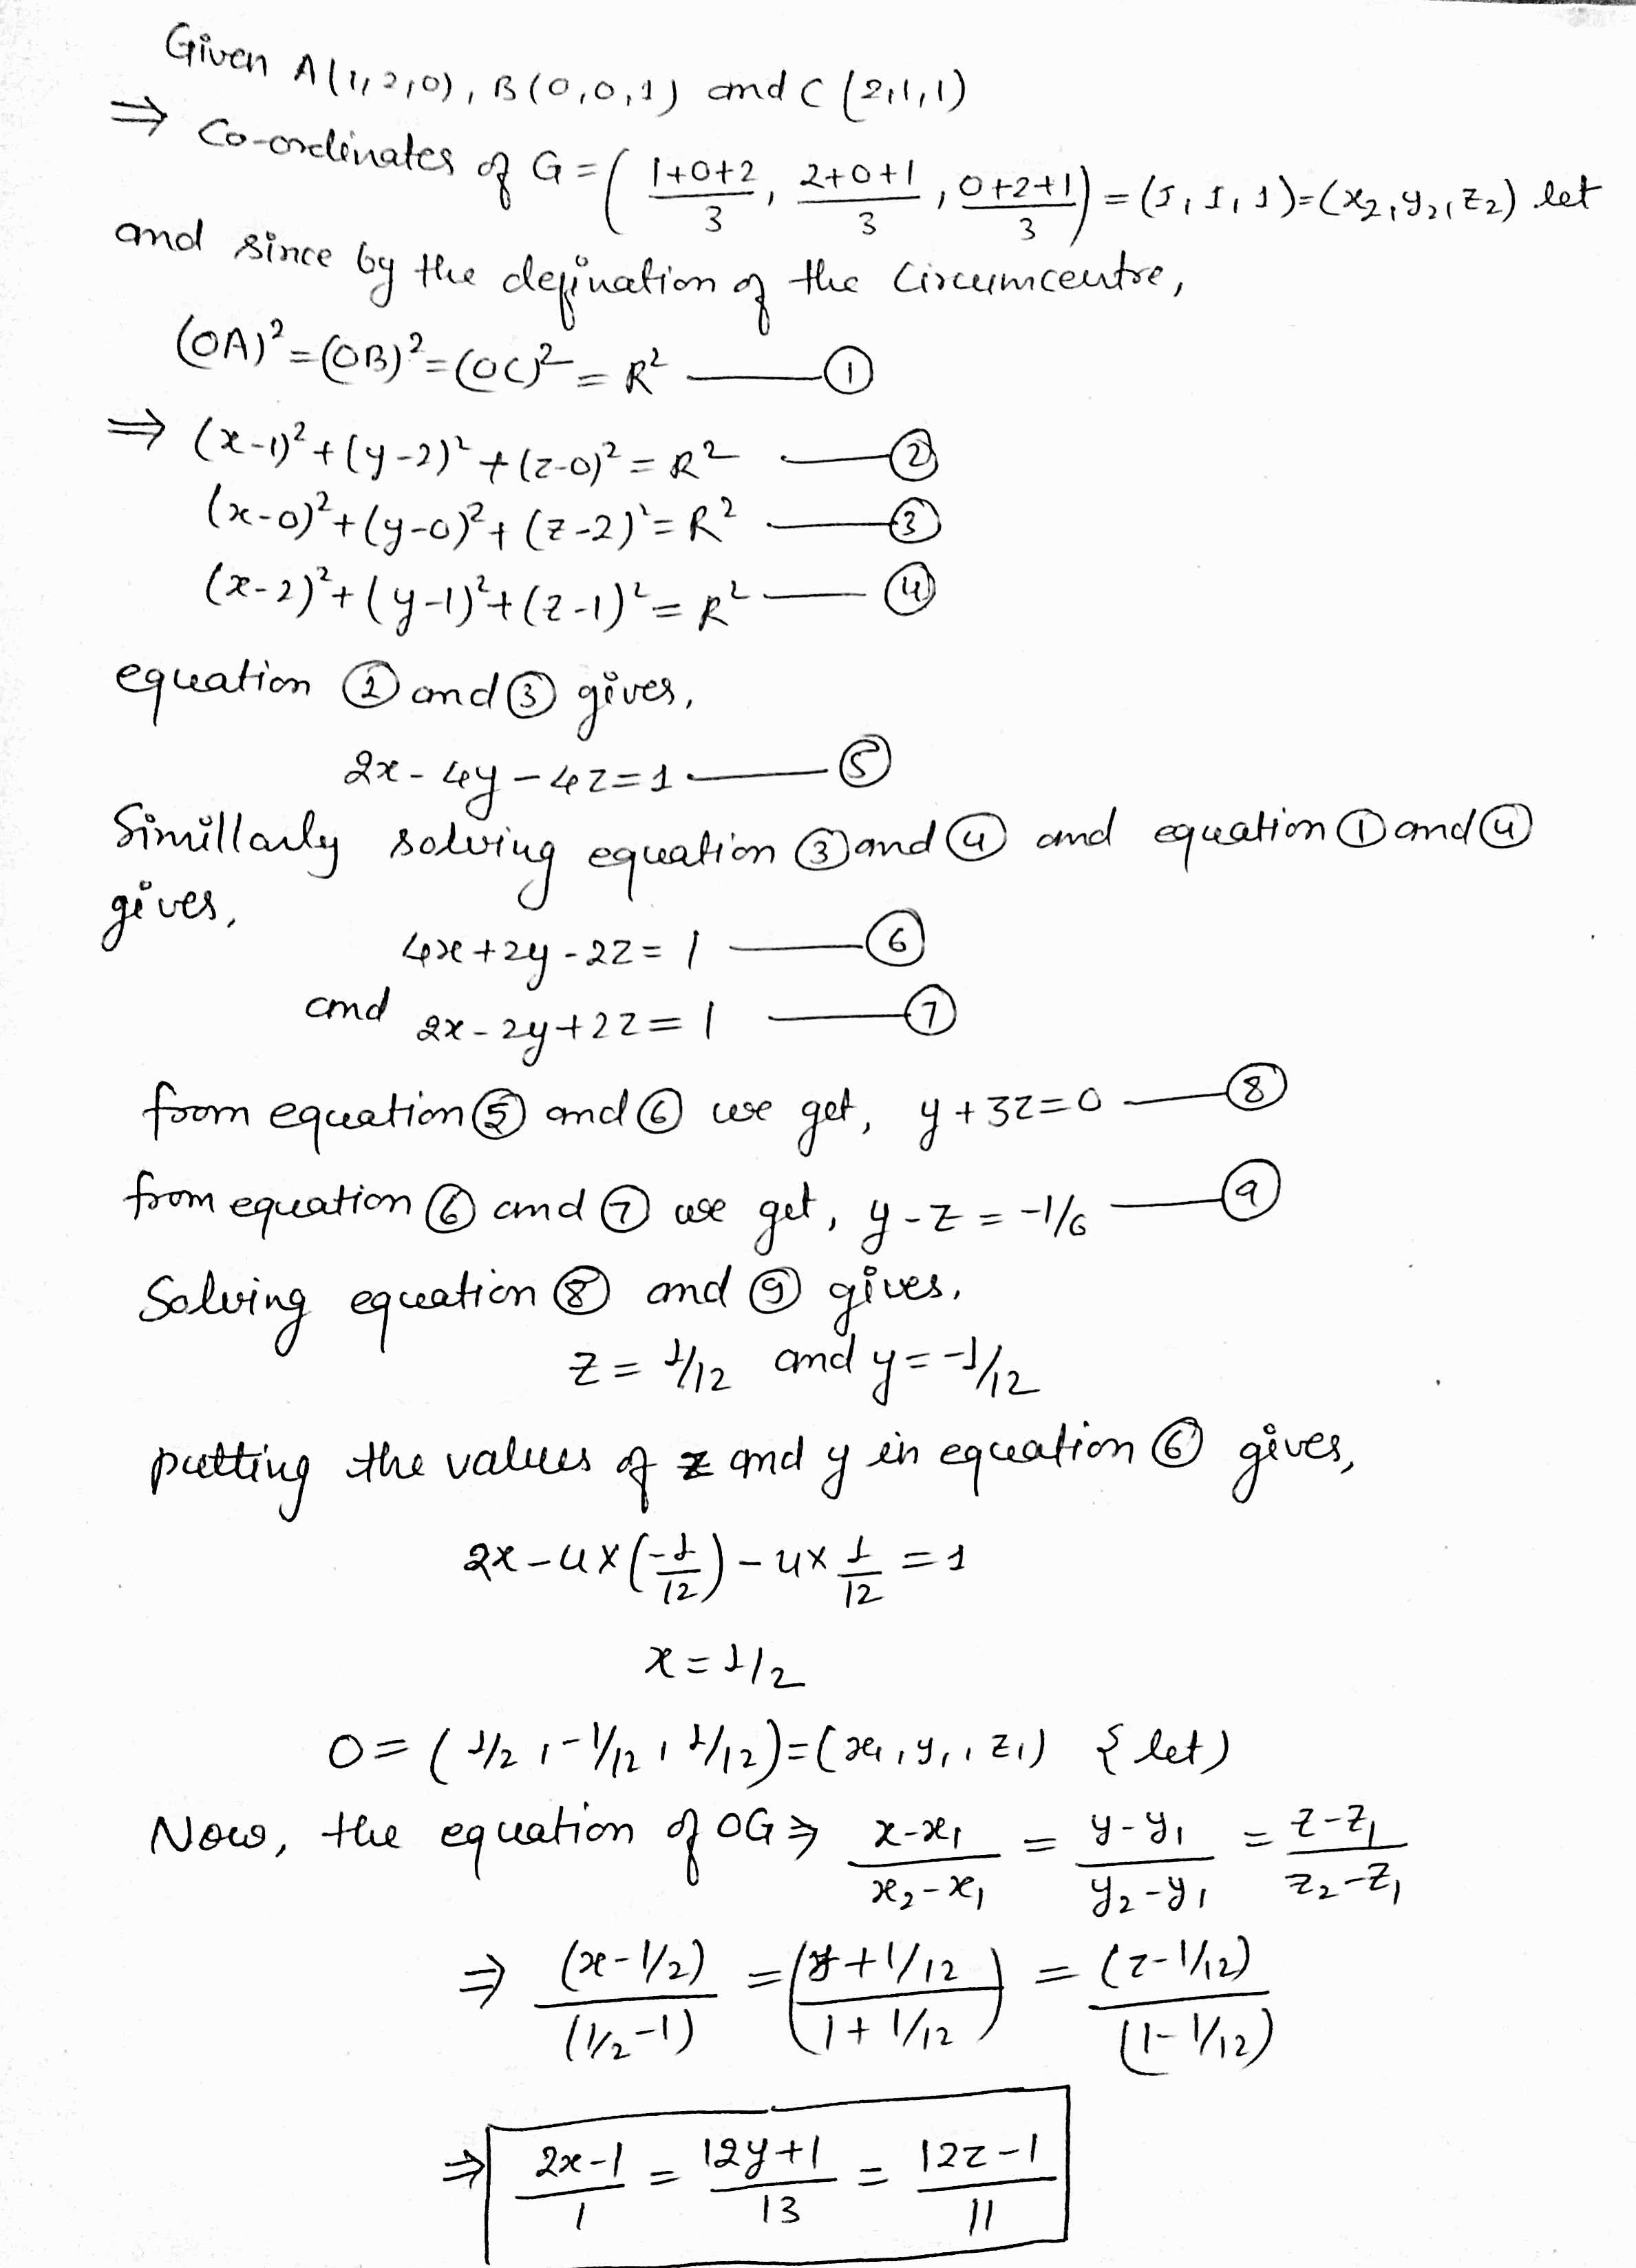
If $$G$$ is the centroid and $$O$$ is the circumcentre of the triangle with vertices $$(1,2,0)$$, $$(0,0,2)$$, and $$(2,1,1)$$, then find the equation of line $$OG$$.
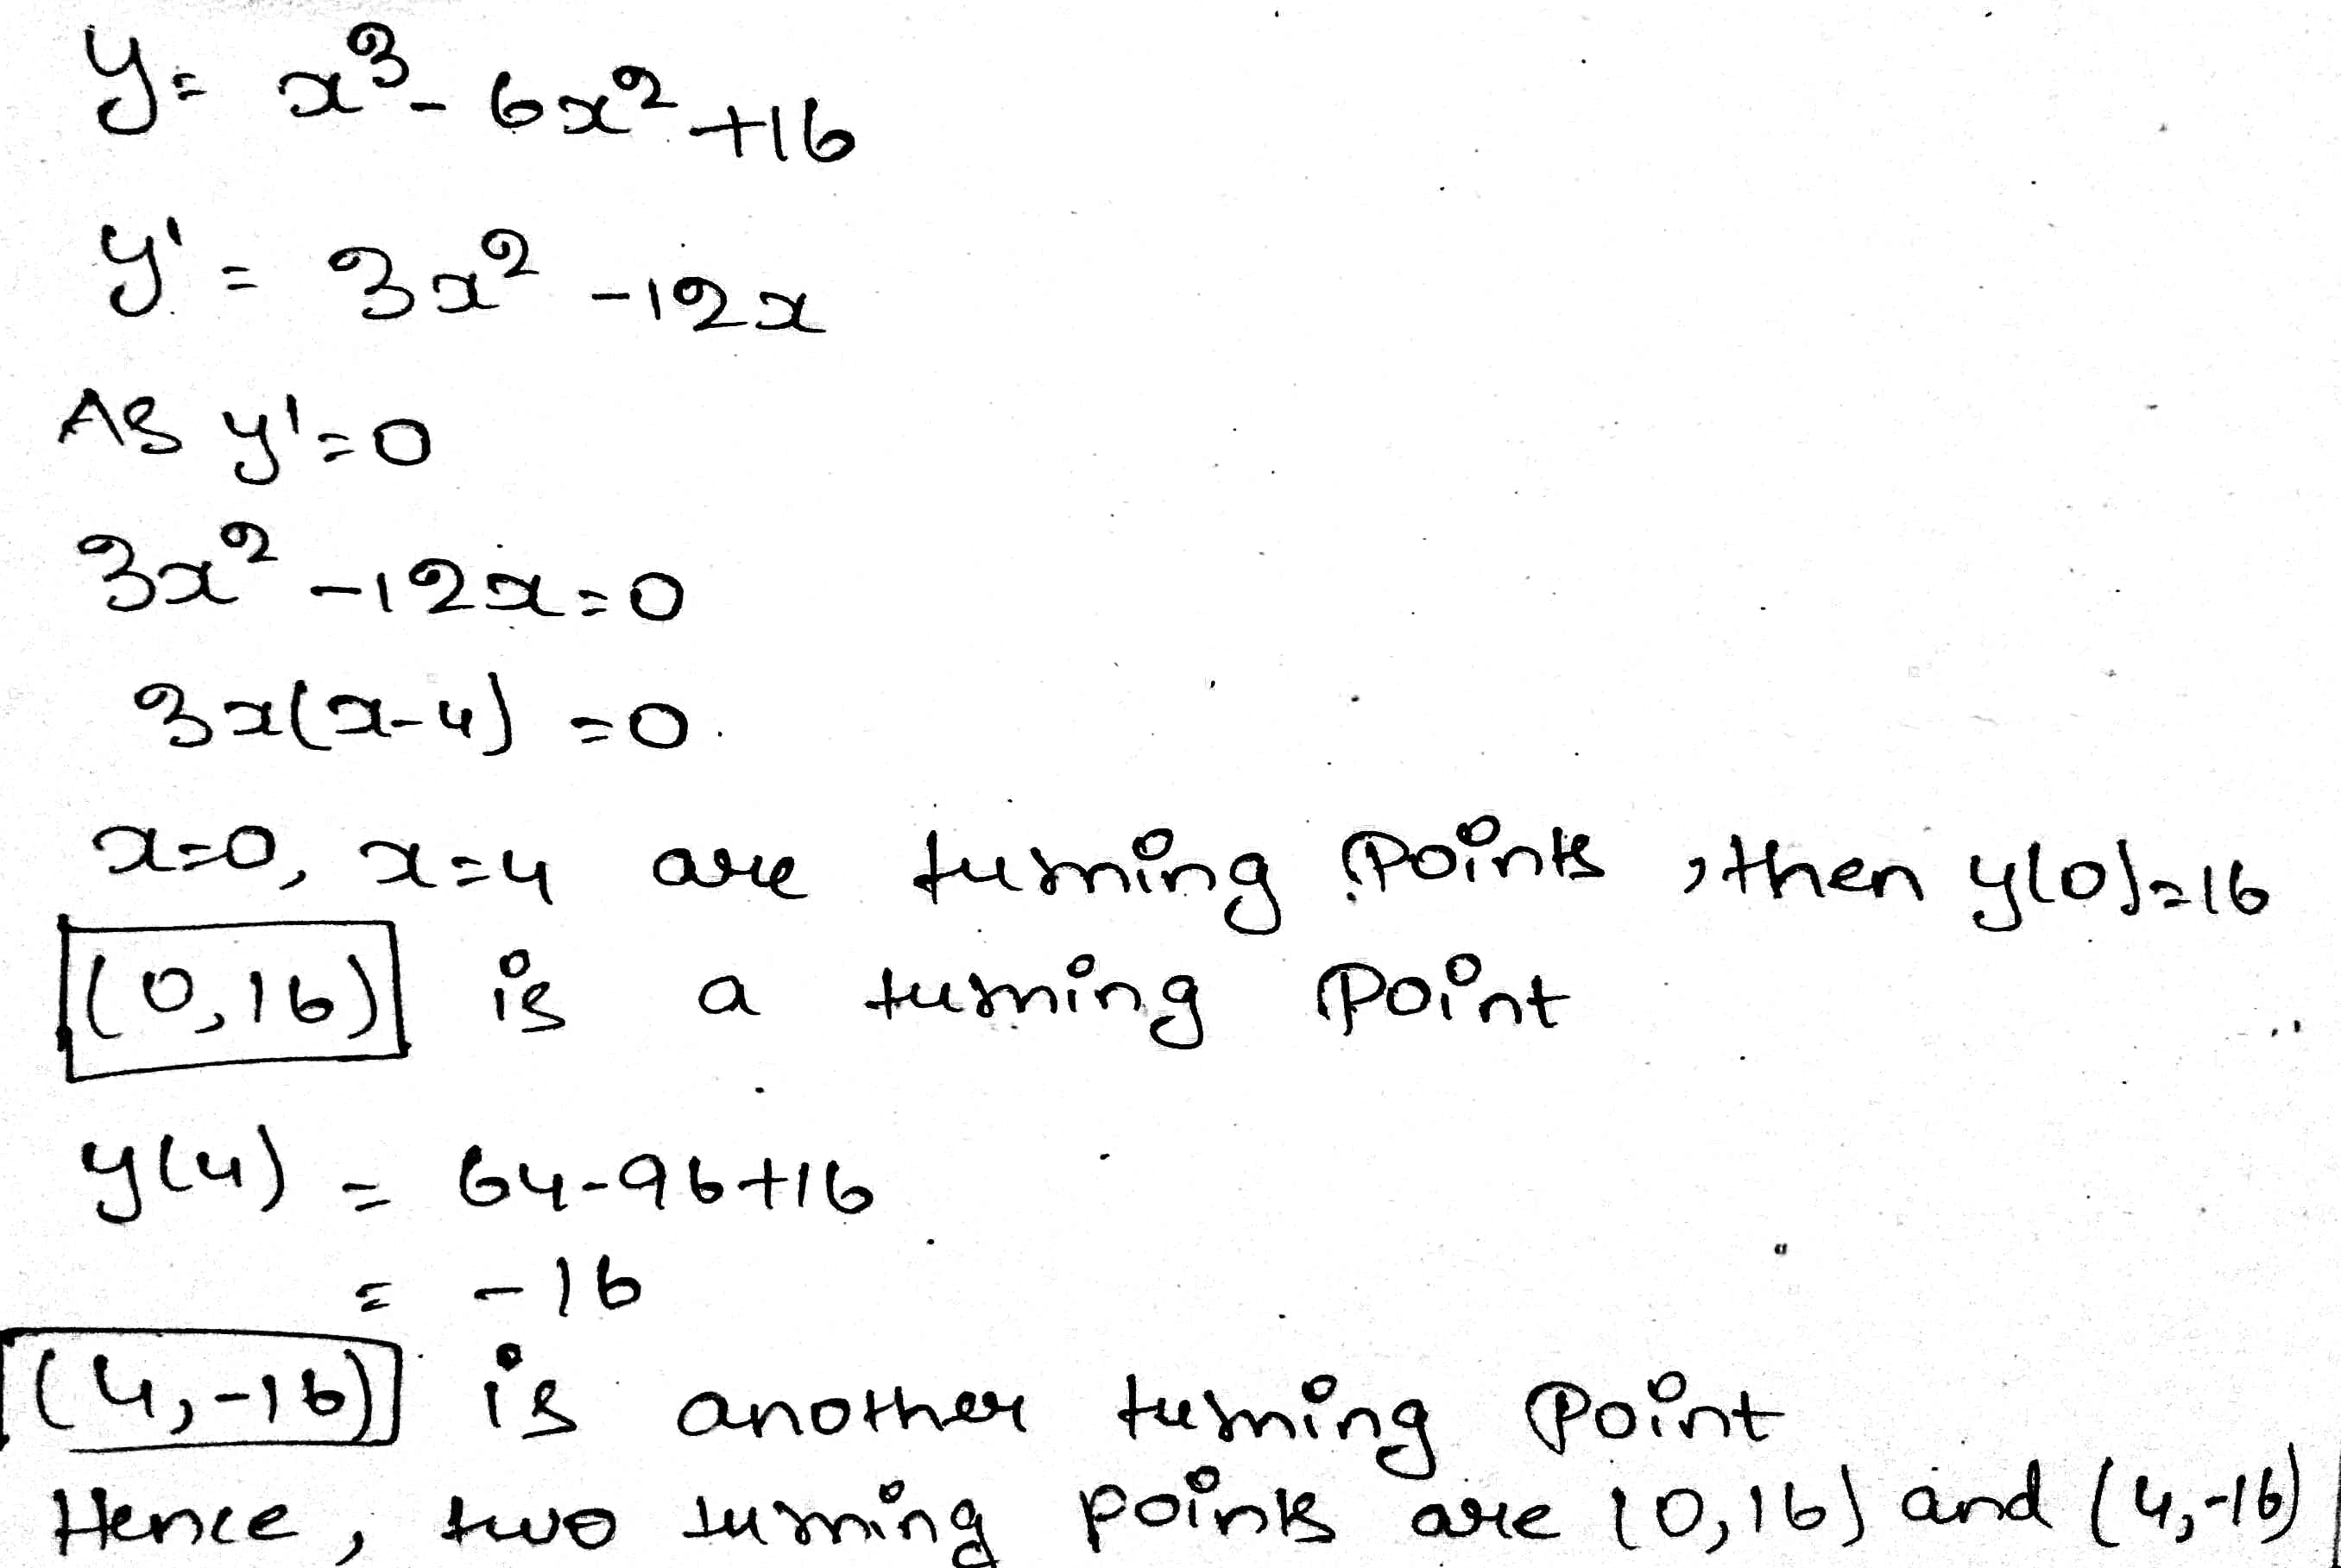
A curve has equation $$y=x^3-6x^2 +16$$
Find the coordinates of the two turning points.
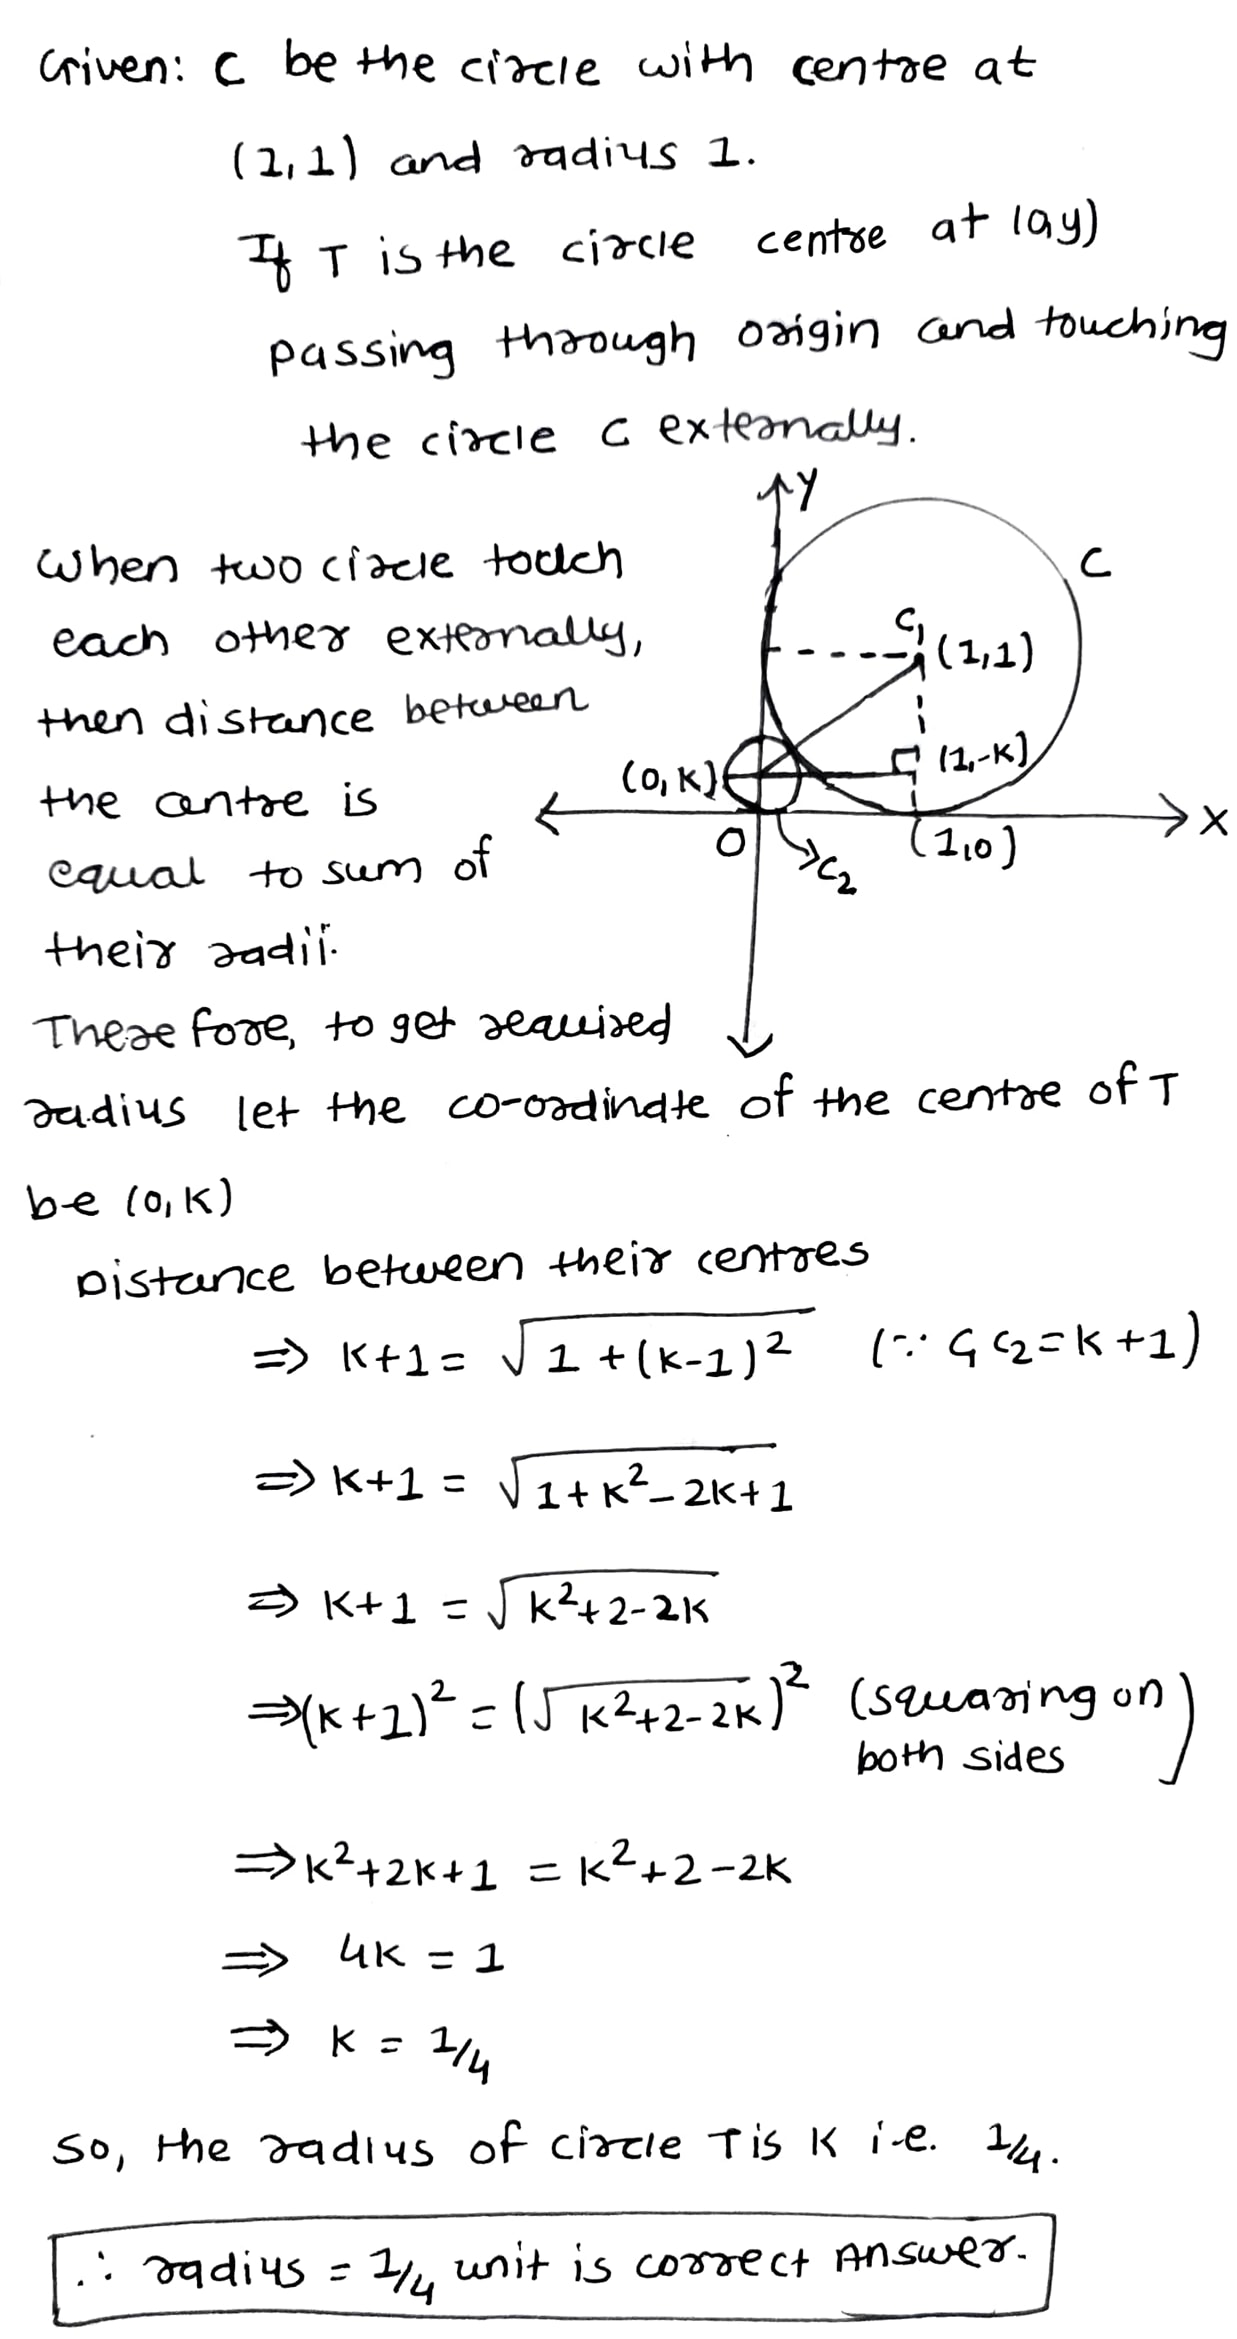
Let C be the circle with centre at (1, 1) and radius =1. If T is the circle centred at ( 0 , y ), passing through origin and touching the circle C externally then the radius of T is equal to.
Solve :
The diagram shows four shapes, A , B , C and D.
Describe fully the single transformation that map shape A onto shape C.
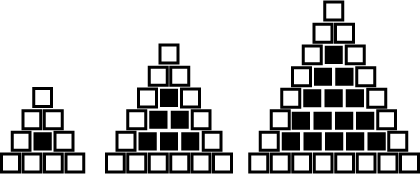
Sonal and Amole then made another sequence of the designs. Three of the designs are shown below.
Draw a graph of rawos and number of while tiles Draw another graph of the number of rows and the number of purple tiles. Put the number of rows on the horizontal axis.

Solve :
The diagram shows four shapes, A , B , C and D.
On the grid , draw the enlargement of shape A by scale factor $$2$$ and center $$(-1 , 2)$$.

Solve :
The diagram shows four shapes, A , B , C and D.
Describe fully the single transformation that map shape A onto shape D.

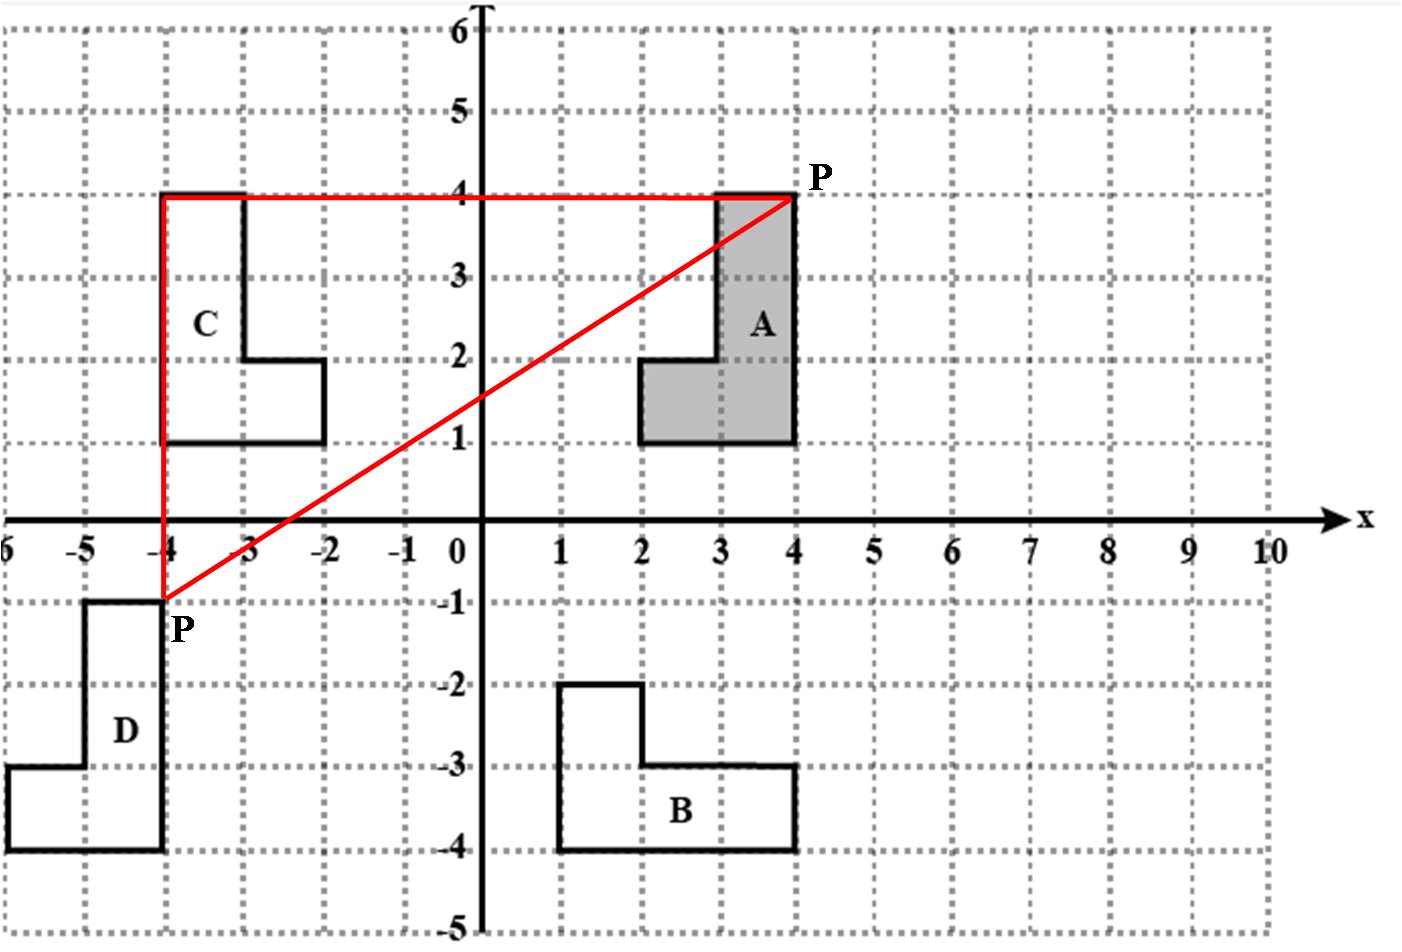
If a point $$(x,y)$$ lies above the horizontal axis, then $$y$$ is always .....
Class 8 Maths Extra Questions
- Algebraic Expressions And Identities Extra Questions
- Comparing Quantities Extra Questions
- Cubes And Cube Roots Extra Questions
- Data Handling Extra Questions
- Direct And Inverse Proportions Extra Questions
- Exponents And Powers Extra Questions
- Factorisation Extra Questions
- Introduction To Graphs Extra Questions
- Linear Equations In One Variable Extra Questions
- Mensuration Extra Questions
- Playing With Numbers Extra Questions
- Practical Geometry Extra Questions
- Rational Numbers Extra Questions
- Squares And Square Roots Extra Questions
- Understanding Quadrilaterals Extra Questions
- Visualising Solid Shapes Extra Questions