Smart Charts - Class 5 Maths - Extra Questions
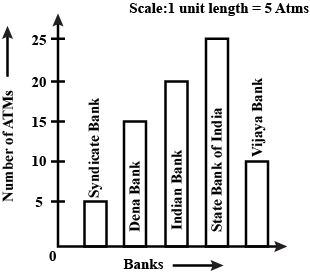
The number of ATMs of different banks in a city
is shown below:
Draw a bar graph to represent the above information by choosing the scale of your choice.
Take Number of ATM on the vertical axis and name of Bank on
horizontal axis.
horizontal axis.
The relation between dependent and independent variables is shown through a ________ .
Observe the toothpick pattern given below:
Use your graph to predict the number of toothpicks in patterns $$7$$ nad $$8$$. Check your answers by actually drawing them.

The graph is shown above :
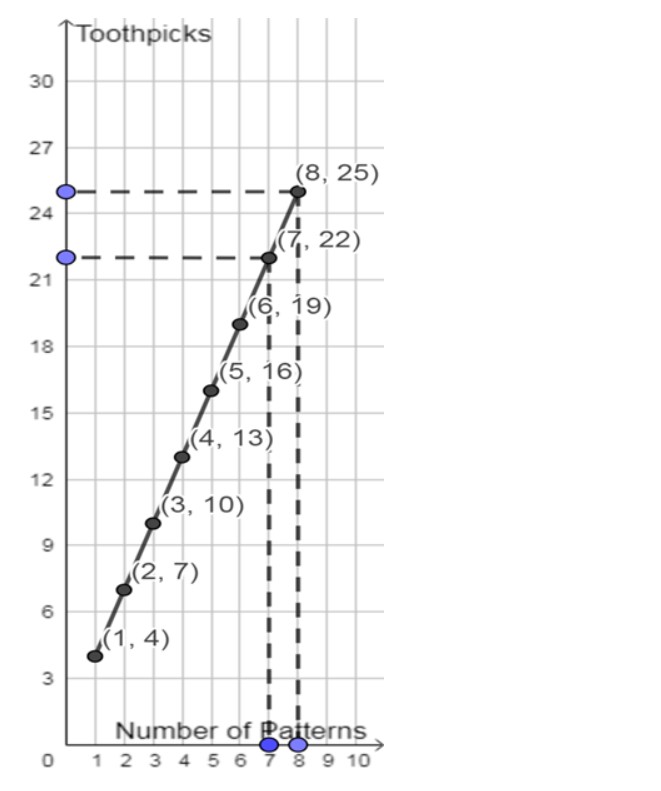
It is following the line y = 3x + 1 .
So, if x = 7 , then y = ( 3 x 7 ) + 1 = 22
and if x = 8 , then y = ( 3 x 8 ) + 1 = 25
Hence, the tabular representation is :
| Pattern | 7 | 8 |
| Toothpicks | 22 | 25 |
Define / Explain the following concepts.
Aggregates.
Read the following transactions and identify the cause of difference on the basis of time gap or errors made by business firm/ bank.Put a $$(\surd)$$ for the correct cause.
| S.N | Transactions | Time Gap | Errors made by business / bank |
| 1 2 3 4 5 | Cheque issued to customer but not presented for payment. Cheque amounting to Rs.5,000 issued to M/s XYZ but recorded as Rs.500 in the cash book. Interest credited by the bank but not yet recorded in the cash book. Cheque deposited into the bank but not yet collected by the bank. Bank charges debited to firm's current account by the bank. |
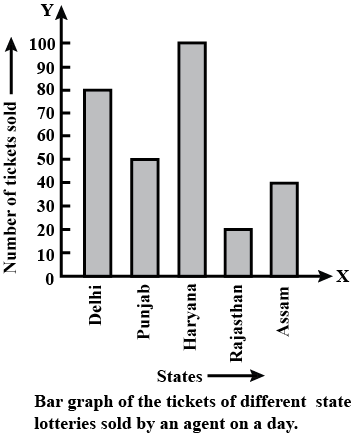
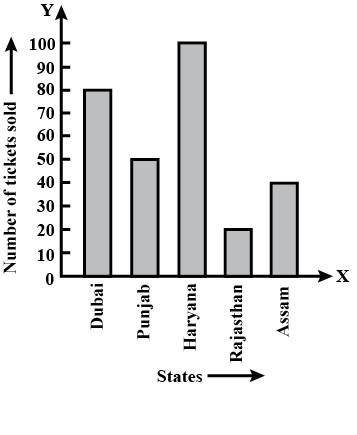
Read the bar graph and answer the following questions:
Of which state were the minimum number of tickets sold?
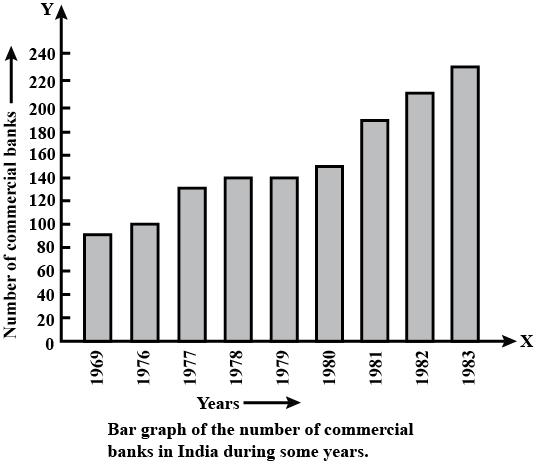
Read the bar graph and answer the following question:
What was the number of commercial banks in $$1977$$?
Read the bar graph and answer the following questions:
Of which state, were the maximum number of tickets sold?
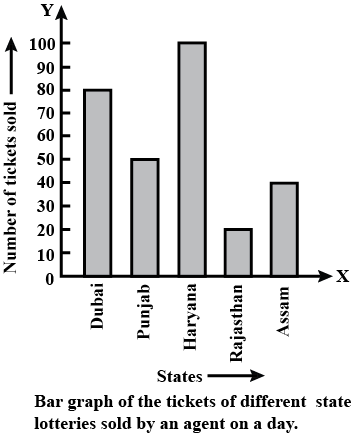
Bar graph shows the tickets of different state lotteries sold by an agent on a day.Read the bar graph and answer the following questions:
How many tickets of Assam State Lottery were sold by the agent?
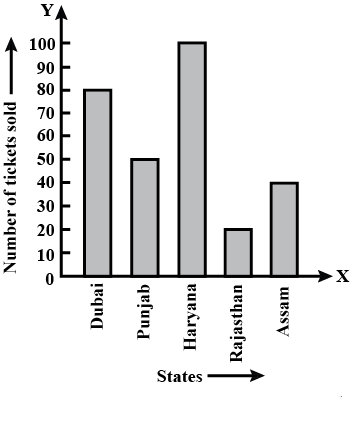
Read the bar graph and answer the following questions:
The information given by the bar graph is the number of tickets of different state lotteries sold by an agent on a day.For the above statement, type 1 if it is true and type 0 if it is false.
Study the given graph and complete the table below.
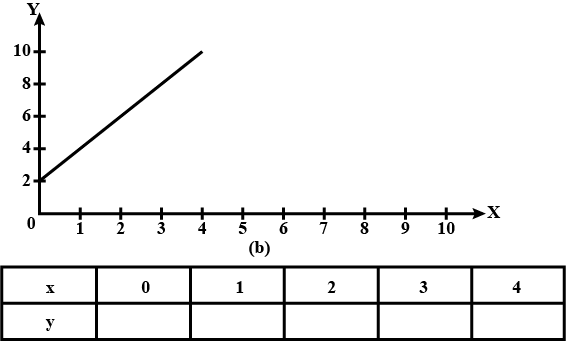
After observing the graph, we conclude that,
For $$x=0\ ,\ \ y=2$$
For $$x=1\ ,\ \ y=4$$
For $$x=2\ ,\ \ y=6$$
For $$x=3\ ,\ \ y=8$$
For $$x=4\ ,\ \ y=10$$
Hence, the complete table is as shown.

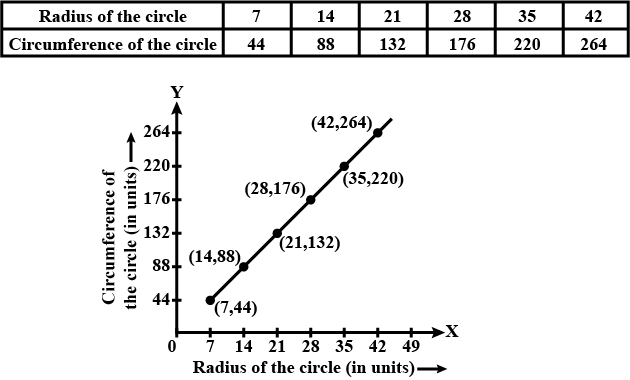
Draw a graph fro the radius and circumference of circle using a suitable scale. (Hint : take radius = $$7 ,14, 21$$ units and so on)
From the graph,
a) Find the circumference of the circle when radius is 42 units.
b) What radius will the circumference of the circle be $$220$$ units?
We know that,
Circumference of a circle $$=2\pi r=2\times \dfrac{22}7\times r=\dfrac {44r}7$$
Let, the radius = $$7$$ units
So, the circumference $$= 2 \times \pi \times r=\dfrac {44\times 7}7 = 44$$units.
Let, the radius = $$14$$ units
So, the circumference $$= 2 \times \pi \times r=\dfrac {44\times 14}7 = 88$$units.
Calculating so on, we get the following table. And the graph is plotted as shown.
From the graph,
(a) The circumference of the circle when radius is $$42$$ units is $$264$$ units.
(b) The radius of circle will be $$35$$ units when the circumference is $$220$$ units.
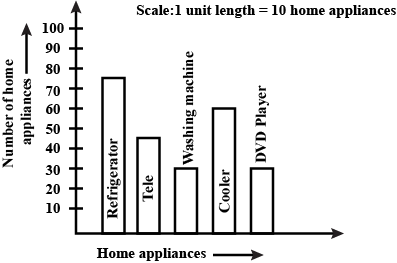
Home appliances sold by a shop in one month are given below:
| Home appliance | Number of home appliances |
| Refrigertator Television Washing MAchine cooler DVD Player | 75 45 30 60 30 |
Draw a bar graph to represent the above information
Take Number of the Home appliance on the vertical axis
and Home appliances on the horizontal axis.
and Home appliances on the horizontal axis.
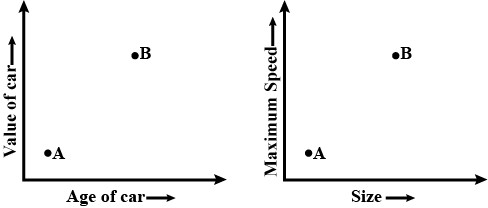
The two graphs below compares Car A and Care B. The left graph shows the relationship between age and value. The right graph shows the relationship between size and maximum speed.
Use the graphs to determine whether each statement is true or false, and explain your answer.
The older car is less valuable.

The two graphs below compares Car A and Care B. The left graph shows the relationship between age and value. The right graph shows the relationship between size and maximum speed.
Use the graphs to determine whether each statement is true or false, and explain your answer.
The faster car is larger.

The two graphs below compare Car A and Care B. The left graph shows the relationship between age and value. The right graph shows the relationship between size and maximum speed.
Use the graphs to determine whether each statement is true or false, and explain your answer.
The larger car is older.
Observe the toothpick pattern given below:
make a graph by taking the pattern numbers on the horizontal axis and the number of toothpicks on the vertical axis. Make the horizontal axis from 0 to 10 and the vertical axis from 0 to 30.

The above graph is plotted by the pattern numbers on the horizontal axis and the number of toothpicks on the vertical axis.

Thee two graph below compare Car A and Care B. The left graph shows the relationship between age and value. The right graph shows the relationship between size and maximum speed.
Use the graphs to determine whether each statement is ture or false, and explain your answer.
The faster car is older.

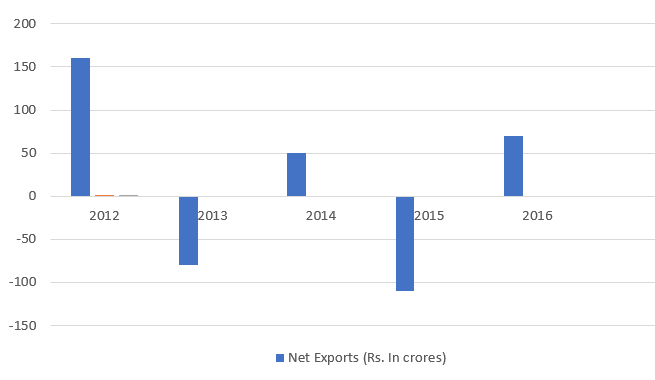
Represent the following data relating to net exports of a company by deviation
bar diagram:
| Year | 2011 | 2012 | 2013 | 2014 | 2015 | 2016 |
| Net Exports (Rs. in crores) | 250 | 160 | (-)80 | 50 | (-)110 | 70 |
Deviation bar diagram is as follows:
Sonal and Amole then made another sequence of the designs. Three of the designs are shown below.
Which graph in linear?
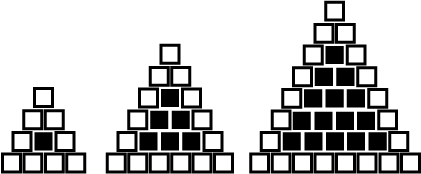

As shown in above graphs, graph of number of white tiles vs number of rows is linear
Class 5 Maths Extra Questions
- Area And Its Boundary Extra Questions
- Be My Multiple I Will Be Your Factor Extra Questions
- Boxes And Sketches Extra Questions
- Can You See The Pattern Extra Questions
- Does It Look The Same Extra Questions
- How Big How Heavy Extra Questions
- How Many Squares Extra Questions
- Mapping Your Way Extra Questions
- Parts And Whole Extra Questions
- Shapes And Angles Extra Questions
- Smart Charts Extra Questions
- Tenths And Hundreths Extra Questions
- The Fish Tale Extra Questions
- Ways To Multiply And Divide Extra Questions