Determination Of Income And Employment - Class 12 Commerce Economics - Extra Questions
Define marginal propensity to consume.
An economy is in equilibrium. From the following data. calculate the marginal propensity to save :
(a) Income $$= 10,000$$
(b) Autonomous consumption $$= 500$$
(c) Consumption expenditure $$= 8,000$$
Define ex post measure.
Explain government expenditure.
What is aggregate supply?
Distinguish between Autonomous Consumption and Induced Consumption.
What is effective demand? How is it determined?
Define or explain the following concepts.
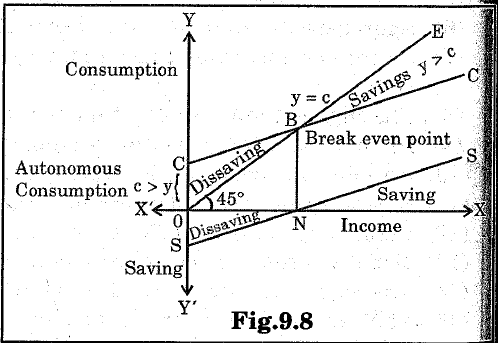
Dis-savings.
The diagram shows the dis-savings, which is to the left of the Break even point. Also when there is dis-saving, the saving function curve will be in the negative quadrant.
Answer the following questions.
What are the efforts of population on consumption expenditure?
Answer in detail.
Explain Keynes subjective and objective factors influencing consumption function.
Answer in detail.
Explain in detail 'saving function with schedule and diagram.
Savings function refers to the standard equation of savings which defines the relationship between savings and income where savings value can be derived at each level with the use of income value.
S= s + Y(1-b) where s=autonomous savings, (1-b)= marginal propensity to save, and Y= income.
For example, s= -50 and MPS= 0.5. Then, savings function schedule will be as follows:
|
Income (Y) |
Savings = s+ (1-b) Y |
|
0 |
-50 |
|
100 |
0 |
|
200 |
50 |
Answer in detail.
What are the objective factors influencing consumption function.
The value of marginal propensity to consume is $$0.6$$ and initial income in the economy is Rs. $$100$$ crores. Prepare a schedule showing Income, Consumption and Saving. Also show the equilibrium level of income by assuming autonomous investment of Rs. $$80$$ crores.
What is meant by aggregate demand? State its components.
Why does the consumption curve not start from the origin?
A consumer consumes goods $$X$$ and $$Y$$. Given below is his marginal utility schedule for goods $$X$$ and $$Y$$. Suppose, the price of $$X$$ is $$Rs.2$$, $$Y$$ is $$Rs.1$$ and income $$Rs.12$$. State the law of Equimarginal utility and explain how the consumer will attain equilibrium.
| Units | 1 | 2 | 3 | 4 | 5 | 6 |
| $$MU_X$$ | 16 | 14 | 12 | 10 | 8 | 6 |
| $$MU_Y$$ | 11 | 10 | 9 | 8 | 7 | 6 |
Explain how a firm in perfect competition incurs loss, in short-run equilibrium.
Answer briefly each of the following questions.
What is meant by ex-ante demand and ex-post demand?
Explain how a producer attains equilibrium using the TR and TC approach.
Discuss the mechanism of investment multiplier with the help of a numerical example.
Write explanatory answer:
Explain the subjective and objective factors determining consumption function.
Give reasons or explain:
With the increase in income, both consumption and savings increase.
Define marginal propensity to consume. How is it different from marginal propensity to save?
Marginal propensity to consume can be greater than one but less than infinity. True/false
What is marginal propensity to consume? How is it related to marginal propensity to save?
What is the difference between ex-ante investment and ex-post investment ?
How are the following treated while estimating private final consumption expenditure? Give reasons for your answer.
(i) Exports.
(ii) Direct purchases made abroad by resident households.
(iii) Final consumption expenditure of non-profit institutions serving households.
(iv) Change in stocks.
Classify the following expenditures as intermediate consumption expenditure and final consumption expenditure.
(i) Expenditure on research and development by Tata.
(ii) Insurance premium paid by a firm to an insurance company.
(iii) Insurance premium paid by households to an insurance company.
(iv) Expenditure on repairs and maintenance of plant and machinery.
(v) Expenditure incurred by a firm on purchase of equipments.
(vi) Advertising expenditure incurred by Airtel on promotion of Its products.
(vii) Business expenses of the employees on tour and entertainment.
The consumption function of an economy is given as: C = 60 + 0.6Y. For the given consumption function, calculate the break-even level of income.
What is consumption function?
Define marginal propensity to consume.
Distinguish between APC and MPC.
What can be the maximum value of marginal propensity to save?
If MPC is 0.75, calculate the value of MPS.
What are the 2 kinds of propensities to save?
Calculate the marginal propensity to consume in an economy, when the MPS is 0.2.
Give the meaning of ex-ante saving.
Give the meaning of ex-ante investment.
Can the value of MPC be greater than one?
Will a firm invest, if its marginal efficiency of investment is 12% and the rate of interest is 16%?
Explain, in brief, the concept of ex-ante and ex-post saving and investment. Why are ex-ante saving and ex-ante investment not always equal to each other?
Which of the following cannot have a negative value? Give reasons.
(i) Average propensity to save (iiI) Marginal propensity to save.
What do you understand by ex-post saving and ex-post investment?
Explain the distinction between ex-ante measures and ex-post measures.
If households save Rs. 500 crores out of an additional income of Rs. 5,000 crores, then calculate MPC.
Give the meaning of propensity to save. Discuss in brief the two types of propensities to save.
Distinguish between marginal propensity to consume and average propensity to consume. Give a numerical example.
"The rate of increase in consumption is equal to the rate of increase in income". Do you agree with this statement?
Will ex-ante saving always be equal to the ex-ante investment?
Distinguish between ex-ante measure and ex-post measure of a variable. Which of the two forms the basis of the theory of national income determination?
From the following schedule. compute APC, APS, MPC and MPS.
| Income | 200 | 250 | 300 | 350 | 400 |
| Saving | - | 5 | 15 | 20 | 50 |
Complete the following tables:
| Income | Marginal Propensity to Consumption | Saving | Average Propensity to Consume |
| 0 | -30 | - | |
| 100 | 0.75 | - | - |
| 200 | 0.75 | - | - |
| 300 | 0.75 | - | - |
If the total income increases from Rs. 5,000 crores to Rs. 6,000 crores and saving Increases from Rs. 1,000 crores tot 1,500 crores, calculate MPC.
If MPS is 0.3 and the income increases from Rs. 6,000 crores to Rs. 9,000 crores, what will be the additional consumption in the economy?
If the total increase from Rs. 5000 crores to Rs. 6000 crores and saving increases from Rs. 1000 crores to Rs. 1500 crores, calculate MPC.
Complete the following tables:
| Income | Consumption | Marginal Propensity to Save | Average Propensity to Consume |
| 0 | 15 | - | - |
| 50 | 50 | - | - |
| 100 | 85 | - | - |
| 150 | 120 | - | - |
Using the consumption function: $$ C = \bar{c}+ b(Y)$$, calculate saving at income of Rs. 2,000 crores, If autonomous consumption is Rs. 150 crores and 40% of additional income is consumed.
Complete the following tables:
| Income | Consumption | Marginal Propensity to Save | Average Propensity to Save |
| 0 | 80 | - | - |
| 100 | 140 | - | - |
| 200 | - | 0 | - |
| - | 240 | - | 0.20 |
| - | 260 | 0.80 | 0.35 |
Complete the following tables:
| Consumption Expenditure (Rs.) | Saving (Rs.) | Income (Rs) | Marginal Propensity to Consume |
| 100 | 50 | 150 | - |
| 175 | 75 | - | - |
| 250 | 100 | - | - |
| 325 | 125 | - | - |
Complete the following tables:
| Income | Saving | Marginal Propensity to Consume | Average Propensity to Consume |
| 0 | -20 | - | - |
| 50 | -10 | - | - |
| 100 | 0 | - | - |
| 150 200 | 30 60 | - - | - - |
The saving function is given as: S.-120+ 0.4 (Y). Determine: (i) Consumption function; (ii) Consumption at income level of f 600 crores; (ii) Break-even level of income.
((i) C =120+ 0.60 (Y); (it) Rs. 480 crores; (iii) Rs. 1300 crores)
The consumption function for an economy is given as: C = 200 + 0.8Y. (i) Determine the value of MPC and MPS; (ii) Autnomous Consumption; (iii) Derive the corresponding saving function; (iv) Calculate consumption at the income levels of Rs. 3,000 crores and Rs. 5,000 crores. (v) Determine the break-even level of income.
((i) MPC = 0.8; MPS =0.2; (ii) Autnomous Consumption = 1200 crows (iii) S = -200 + 0.20Y (iv) Rs. 2,600 crams and Rs. 4,200 crores; (v) Rs. 1,000 crores)
The break-even point for an economy occurs at the income level of ? 500 crores if marginal propensity to consume is 0.6, determine: (i) Autonomous consumption; (ii) Saving function; (iii) Level of Income when saving is ? 600 crores.
((i) Rs. 200 crows; (ii) - 200 + 0.4 (Y); Rs. 2000 cares)
If MPC is four times MPS and consumption at zero level of income is Rs. 70 crores, derive the consumption function. (C = 70 + 0.80 Y)
The consumption curve makes an intercept of Rs. 60 crores on the Y-axis. MPC:MPS can be expressed as 1:3, then derive the saving and consumption function. Also determine the level of income, when saving becomes zero?
(Saving Function: S = -60 + 0.75 (Y); Consumption Function: C = 60 + 0.25 09; Saving will become zero at income of Rs. 80 acres)
In an economy, Investment increases by Rs. 200 crores. As a result, the total income increases by 1,000 crores. Calculate the MPC. (0.80)
In an economy, the consumption function is C = 600 + 0.9 Y, where C is consumption expenditure and is income. Calculate the equilibrium level of income and consumption expenditure, when investment expenditure is 500.
(Equilibrium level of income 11,000; Consumption expenditure = 10,500.)
How much additional income will be generated in an economy with an additional investment of Rs. 100 crores and when half of increase in Income is spent on consumption?
The consumption function of an economy is given as: C = 200 + 0.75 Y. If planned investments are Rs. 500 crores, calculate equilibrium level of national income. (52,800 crores)
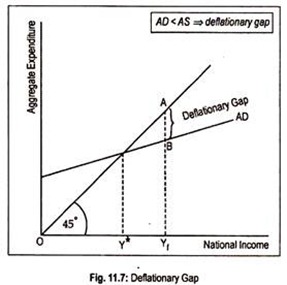
Explain the concept of 'deflationary gap'. Also explain the role of 'margin requirements' in reducing it.
Calculate the value of multiplier, if MPC is: (i) 0.60; (ii) 0.50
Explain the meaning of under-employment equilibrium. Explain two measures by which full employment equilibrium can be reached.
Name the situation under which planned aggregate expenditure exceeds the equilibrium level of expenditure.
What is the impact of excess demand and deficient demand on the price level?
Explain the meaning of inflationary gap with the help of a diagram.

Calculate Marginal Propensity to Consume from the following data about an economy which is in equilibrium:
National income = Rs. 2,000
Autonomous consumption expenditure = Rs. 200
Investment expenditure = Rs. 100
(Marginal Propensity to Consume = 0.85)
Calculate equilibrium national income from the following:
(i) Consumption expenditure at zero income Rs.60
(ii) Marginal propensity to consume 0.9
(iii) Investment Rs. 100
(Equilibrium level of income =Rs. 1,600)
In an economy the autonomous investment is 60 and the marginal propensity to consume is 0.If the equilibrium level of Income is 400, then the autonomous consumption isTrue or False? Justify your answer.
(False. The given value of autonomous consumption is Incorrect. The correct value is 20)
Calculate equilibrium level of income from the following:
(i) Consumption expenditure at zero income Rs. 40
(ii) Marginal Propensity to Consume 0.8
(iii) Investment Rs. 80
(Equilibrium level of income =Rs. 600)
An economy is in equilibrium. Its national is Rs. 5,000 and autonomous consumption expenditure isWhat is the total consumption expenditure if marginal propensity to consumer is 0.7?
Calculate Marginal Propensity to consume from the following:
(i) Consumption expenditure at zero income Rs. 70
(ii) Equilibrium income Rs.700
(iii) Investment Rs. 140
(Marginal Propensity to Consume = 0.7)
Calculate Marginal Propensity to Consume from the following:
(i) Equilibrium income Rs. 350
(ii) Consumption expenditure at zero income Rs. 20
(iii) Investment Rs. 50
Calculate marginal propensity to consume from the following date about an economy which is in equilibrium.
National Income = Rs. 1,500
Autonomous Consumption Expenditure = Rs. 300
Investment Expenditure = Rs. 300
Calculate 'Investment' from the following:
(i) Equilibrium income Rs. 500
(ii) Consumption expenditure at zero income Rs. 50
(iii) Marginal propensity to consume 0.7
Calculate autonomous consumption expenditure from the following date about an economy which is In equilibrium.
National income = Rs. 1,200
Marginal propensity to save = 0.20
Investment expenditure = Rs. 100
(Autonomous Consumption Expenditure = 140)
An economy is in equilibrium. Calculate Autonomous Consumption from the following:
National Income = 1250
Marginal Propensity to Save = 0.2
Investment Expenditure = 150
An economy is in equilibrium. Calculate national income from the following:
Autonomous consumption = 100
Marginal propensity to save = 0.2
Investment expenditure = 200
(National Income = 1,500)
An economy is in equilibrium. Calculate the Marginal Propensity to Save from the following:
National income = 1000
Autonomous Consumption = 100
Investment = 120
S = -100 + 0.2 Y Is the saving equilibrium level of income. Investment expenditure is 5,Calculate the equilibrium level of income.
(Equilibrium Level of Income = 25,500)
Suppose marginal propensity to consume is 0.How much increase in investment is required to increase national income by Rs. 2,000 crore? Calculate.
(Increase in investment = Rs.400 Croce)
An economy is in equilibrium. Find Marginal Propensity to Consume from the following:
National income = 2000
Autonomous consumption = 400
Investment expenditure = 200
In an economy, 20 percent of increased Income is saved. How much will be the increase in Income if investment Increases by 10,000? Calculate.
(Increase in Income = 50,000)
Calculate the equilibrium level of income in the economy, if C = 500 + (0.9) Y; and Investment Expenditure = 3,000.
(Equilibrium Level of Income = 35.000)
In an economy, investment increases from 300 toAs a result of this, equilibrium level of income increases by 2,Calculate the marginal propensity to consume.
(Marginal Propensity to Consume = 0.9)
An economy is in equilibrium. Calculate Marginal Propensity to Consume:
National Income = 1,000
Autonomous Consumption Expenditure = 200
Investment Expenditure = 100
(Marginal Propensity to Consume = 0.70)
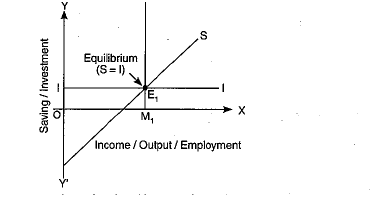
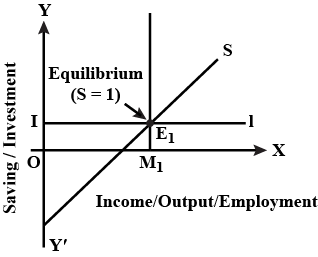
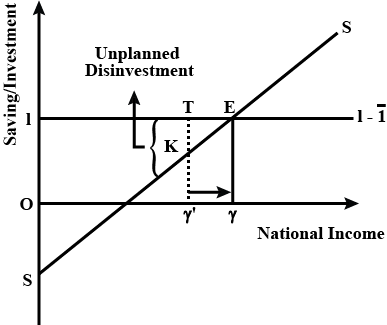
Explain equilibrium level of national income using Savings and Investment approach. Draw diagram in support of your explanation.
According to this approach of equilibrium,
the equilibrium is reached only when Investment(I) equals Savings(S) because at this level there is no tendency for income and output to
change.
In the diagram the equilibrium is at E1 where savings intersects investment curve At this point, I=S.
When S is more than I , then
the planned inventory would fall below the desired level. To bring back the
Inventory at the desired level, the producers expand the output More
output means more income. Rise in output means rise in I and rise in
income means rise in S. Both continue to rise till they reach E1, S=I.
When S is less than I, then
the planned inventory rises above the desired level. To clear the unwanted
increase in inventory, firms plan to reduce the output till S becomes equal to
I.
So, equilibrium takes place only at point E1, when S=I.
From the following data calculate the equilibrium level of national income:
Autonomous Consumption = 500
Marginal Propensity to Save = 0.2
Investment = 2,000
(Equilibrium Level of National Income = 12,500)
If marginal propensity consume is 0.8, how much will be the value of investment multiplier? Calculate.
(Investment Multiplier = 5)
Explain the meaning of investment multiplier. What can be its minimum value and why?
Short Answer Type Question:
Can an economy be in equilibrium when there is unemployment in the economy. Explain.
If in an economy: (a) Consumption function is given by C = 100 + 0.75 Y, and (b) Autonomous Investment Is 150 crores. Estimate (I) Equilibrium level of Income and (ii) Consumption and Savings at the Equilibrium Level of Income.
((i) Rs. 1,000 crores; (ii) Consumption = Rs. 850 crores, Savings= Rs. 150 crass)
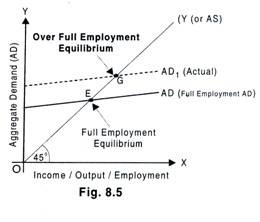
Briefly discuss the concept of over full employment equilibrium. Use diagram.
In Figure , AD, = AS at point ‘G’ which is higher than the full employment level.
As OQ, is more than OQ, point ‘G’ signifies the over full employment equilibrium.
In an economy, investment increased by 1,100 and as a result of it, income increased by 5,Had the marginal propensity to save been 25 percent, what would have been the increase in income?
(Increase in Income = 4,400)
Using the 'saving and investment' approach explain how is the equilibrium level of national income determined? Also explain what will happen if the equilibrium condition is not fulfilled.
In the diagram the equilibrium is at E1 where savings intersects investment curve At this point, I=S.
When S is more than I , then the planned inventory would fall below the desired level. To bring back the Inventory at the desired level, the producers expand the output More output means more income. Rise in output means rise in I and rise in income means rise in S. Both continue to rise till they reach E1, S=I.
When S is less than I, then the planned inventory rises above the desired level. To clear the unwanted increase in inventory, firms plan to reduce the output till S becomes equal to I.
So, equilibrium takes place only at point E1, when S=I.

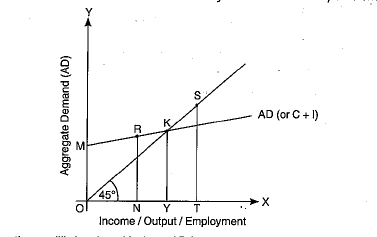
Discuss, in brief, the state of full employment equilibrium with the help of a diagram.
In the diagram the equilibrium is at K where AD intersects 45 line. At this point, AD = AS.
When AD is more than AS (say, at point R), then the planned inventory would fall below the desired level. To bring back the Inventory at the desired level, the producers expand the output More output means more income. Rise in output means rise in AS and rise in income means rise in AD. Both continue to rise till they reach K, where AD = AS.
When AD is less than AS (say, at point S), then the planned inventory rises above the desired level. To clear the unwanted increase in inventory, firms plan to reduce the output till AD becomes equal to AS.
So, full employment level of equilibrium will take place only at point K, when AD = AS where all the capable and willing people get job at the existing wage rate.
What is investment multiplier? How is its value determined? What can be its minimum and maximum value?
Explain the relationship between MPC and multiplier with the help of an example.
Explain the working of investment multiplier with the help of a numerical example.
Explain the meaning of equilibrium level of income and output using saving and investment approach. Use a diagram.
According to this approach of
equilibrium, the equilibrium level of income or output is reached only when Investment(I) equals
Savings(S) because at this level there is no tendency for income and output to
change.
In the diagram the
equilibrium is at E1 where savings intersects investment curve At this point, I=S.
When S is more than I, then
the planned inventory would fall below the desired level. To bring back the
Inventory at the desired level, the producers expand the output More
output means more income. Rise in output means rise in I and rise in
income means rise in S. Both continue to rise till they reach E1, S=I.
When S is less than I, then
the planned inventory rises above the desired level. To clear the unwanted
increase in inventory, firms plan to reduce the output till S becomes equal to
I.
So, equilibrium takes place
only at point E1, when S=I.
"The size of multiplier varies directly with the size of the MPC". Defend or refute.
Discuss the meaning of investment multiplier. What can be its minimum and maximum value?
Explain the meaning of under-employment equilibrium.
Long Answer Type Questions:
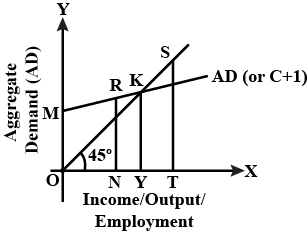
Explain determination of equilibrium level of income using 'Consumption plus Investment' approach. Use diagram.
According to this approach ,
the equilibrium is reached only when aggregate demand (AD= consumption+ Investment) equals aggregate
supply (AS) because at this level there is no tendency for income and output to
change.
In the diagram the equilibrium is at K where AD
intersects 45 line. At this point, AD = AS.
When AD is more than AS (say, at point R), then
the planned inventory would fall below the desired level. To bring back the
Inventory at the desired level, the producers expand the output More
output means more income. Rise in output means rise in AS and rise in
income means rise in AD. Both continue to rise till they reach K, where AD =
AS.
When AD is less than AS (say, at point S), then
the planned inventory rises above the desired level. To clear the unwanted
increase in inventory, firms plan to reduce the output till AD becomes equal to
AS.
So, equilibrium takes place only at point K,
when AD = AS.

Explain, with the help of a diagram, how equilibrium level of income is determined considering aggregate demand and aggregate suppl.
The equilibrium is determined only when aggregate demand (AD) equals aggregate
supply (AS) because at this level there is no tendency for income and output to
change.
In the diagram, the equilibrium is at K where AD
intersects 45 line. At this point, AD = AS.
When AD is more than AS, then
the planned inventory would fall below the desired level. To bring back the
Inventory at the desired level, the producers expand the output More
output means more income. The rise in output means rise in AS and rise in
income means rise in AD. Both continue to rise till they reach E, where AD =
AS.
When AD is less than AS, then
the planned inventory rises above the desired level. To clear the unwanted
increase in inventory, firms plan to reduce the output till AD becomes equal to
AS.
So, equilibrium takes place only at point K,
when AD = AS.
What changes will take place to bring an economy in equilibrium if: (i) planned savings are greater than planned Investment; (ii) planned savings are less than planned investment.
Explain the determination of equilibrium level of national income using 'saving and investment approach. Use diagram. Also explain the effects if saving is greater than investment.
According to this approach of
equilibrium, the equilibrium is reached only when Investment(I) equals
Savings(S) because at this level there is no tendency for income and output to
change.
In the diagram the
equilibrium is at E where savings intersects investment curve At this
point, I=S.
When S is more than I , then
the planned inventory would fall below the desired level. To bring back the
Inventory at the desired level, the producers expand the output More
output means more income. Rise in output means rise in I and rise in
income means rise in S. Both continue to rise till they reach E, S=I.
When S is less than I, then
the planned inventory rises above the desired level. To clear the unwanted
increase in inventory, firms plan to reduce the output till S becomes equal to
I.
So, equilibrium takes place
only at point E, when S=I.

The value of marginal propensity to consume is double the value of marginal propensity to save.
Find the value of multiplier.
"Economists are generally concerned about the rising Marginal Propensity to Save (MPS) in an economy". Explain why ?
What is the range of values of investment multiplier? Clarify the relation of investment multiplier with marginal propensity to consume (MPC) and with marginal propensity to save (MPS).
Why must aggregate demand be equal to aggregate supply at the equilibrium level of Income and output? Explain with the help of a diagram.
According to AD= AS approach,
the equilibrium is determined only when aggregate demand (AD) equals aggregate
supply (AS) because at this level there is no tendency for income and output to
change and the economy may achieve full employment equilibrium.
In the diagram the equilibrium is at K where AD
intersects 45 line. At this point, AD = AS.
When AD is more than AS (say, at point R), then
the planned inventory would fall below the desired level. To bring back the
Inventory at the desired level, the producers expand the output More
output means more income. Rise in output means rise in AS and rise in
income means rise in AD. Both continue to rise till they reach K, where AD =
AS.
When AD is less than AS (say, at point S), then
the planned inventory rises above the desired level. To clear the unwanted
increase in inventory, firms plan to reduce the output till AD becomes equal to
AS.
So, equilibrium takes place only at point K,
when AD = AS.

Calculate the additional investment needed if the equilibrium level of income falls short by Rs. 1,000 crores. It is given that consumption function is given as: $$C = 120 + 0.8\,Y$$ .
Assuming that increase in investment is Rs. 1,000 crore and marginal propensity to consume is 0.9, explain the working of multiplier.
Explain the relationship between MPC and multiplier with the help of an example.
When investment multiplier is 1, the value of marginal propensity to consume is zero.
Explain 'Paradox of Thrift'.
Is it necessary that equality between AD and AS is established at the full employment level?
If MPC and MPS are equal, what is the value of the multiplier?
What are the two approaches for determining the equilibrium level of income?
What is the meaning of over full employment equilibrium?
What is under employment equilibrium?
What Is the relationship between marginal propensity to save and multiplier?
How is the equilibrium level of income attained through saving and investment approach?
An increase of Rs. 100 crores in investment leads to a rise of Rs. 500 crores in the national income. Calculate the value of multiplier.
How is the equilibrium level of income attained through AD and AS approach?
What is the value of multiplier when Marginal Propensity to Save is zero?
Assuming that increase In Investment is Rs. 1.000 crore and marginal propensity to consume is 0.9, explain the working of multiplier.
What can be the minimum value of investment multiplier?
If the value of marginal propensity to consume is 0.calculate the value of multiplier.
If Investment multiplier is 1, what will be the value of marginal propensity to consume?
Short Answer Type Questions:
Can an economy be In equilibrium when there is unemployment in the economy. Explain.
Calculate the values of multiplier if the MPS is:
(a) 0.40; (b) Equal to MPC
Calculate multiplier if MPC is : (i) 0.75; (ii) 0.90
Discuss the adjustment mechanism in the following situations :
Ex-Ante Investments are greater than Ex-Ante Savings.
Answer the following question in $$12$$ sentences.
Write a table to show the impact of simultaneous shifts on equilibrium.
In an economy investment is increased by $$Rs 300$$ crore. If marginal propensity to consume is $$2/3$$, calculate increase in national income.
Answer the following question in $$4$$ sentences.
Give the meaning of investment multiplier. Write its formula.
Answer the following question in $$12$$ sentences.
Briefly explain consumption function.
State the meaning of the following :
(a) Ex-Ante Savings
(b) Full Employment
(c) Autonomous Consumption
Calculate Marginal Propensity to consume from the following data about an economy which is in equilibrium:
National income =2000
Autonomous consumption expenditure=200
Investment expenditure =100
Value of Marginal Propensity to Consume (MPC) varies between ________ and _______.
How is the MPC of poor is more than that of rich?
The summation of Marginal Propensity to Consume (MPC) and ____ have the value of equal to 1.
Equilibrium occurs when ex-ante saving is equal to ________.
If MPC is equal to 0.60, then MPS is equal to _______.
____________ refers to actual savings in an economy during a year.
If MPC and MPS are equal, then the value of the multiplier is _________.
Distinguish between Aggregate Demand (AD) and Aggregate Supply (AS).
Class 12 Commerce Economics Extra Questions
- Comparative Development Experiences Of India And Its Neighbours Extra Questions
- Determination Of Income And Employment Extra Questions
- Employment: Growth,Informalisation And Other Issues Extra Questions
- Environment And Sustainable Development Extra Questions
- Government Budget And The Economy Extra Questions
- Human Capital Formation In India Extra Questions
- Indian Economy (1950-1990) Extra Questions
- Infrastructure Extra Questions
- Introduction To Macroeconomics Extra Questions
- Liberalization,Privatisation And Globalisation: An Appraisal Extra Questions
- Money And Banking Extra Questions
- National Income Accounting Extra Questions
- Open Economy Macroeconomics Extra Questions
- Poverty Extra Questions
- Rural Development Extra Questions