Statistics - Class 11 Engineering Maths - Extra Questions
Find the median of the following data: $$2, 7, 3, 15, 12, 17$$ and $$5$$.
Find the mode of $$14, 25, 14, 28, 18, 17, 18, 14, 23, 22, 14, 18$$.
Calculate the coefficient of range for the following data:
| Heights in cm. | $$120-124$$ | $$125-129$$ | $$130-134$$ | $$135-139$$ | $$140-144$$ |
| No. of students | $$6$$ | $$9$$ | $$10$$ | $$12$$ | $$8$$ |
Calculate the coefficient of range for the following data.
| No. of wards | $$1$$ | $$2$$ | $$3$$ | $$4$$ | $$5$$ | $$6$$ | $$7$$ | $$8$$ |
| No. of houses | $$32$$ | $$57$$ | $$28$$ | $$96$$ | $$138$$ | $$90$$ | $$66$$ | $$58$$ |
Calculate the mean deviation from the mean for the scores given below:
$$15, 11, 13, 20, 26, 18, 21$$
The formula for coefficient of variation (C.V.) is given by _______________.
The weight(in kg) of $$13$$ students in a class are $$42.5, 47.5, 48.6, 50.5, 49, 46.2, 49.8, 45.8, 43.2, 48, 44.7, 46.9, 42.4$$. Find the range and coefficient of range.
The smallest value of a collection of data is $$12$$ and the range is $$59$$. Find the largest value of the collection of data.
Write two merits of mode.
The largest value in a collection of data is $$7.44$$. If the range is $$2.26$$, then find the smallest value in the collection.
Find the mode of the following data. 12, 24, 36, 46, 25, 38, 72, 36, 25, 38, 12, 24, 46,25, 12, 24, 46, 25, 72, 12, 24, 36,25, 38 and 36.
Write the relation between standard deviation of a set of scores and its variance.
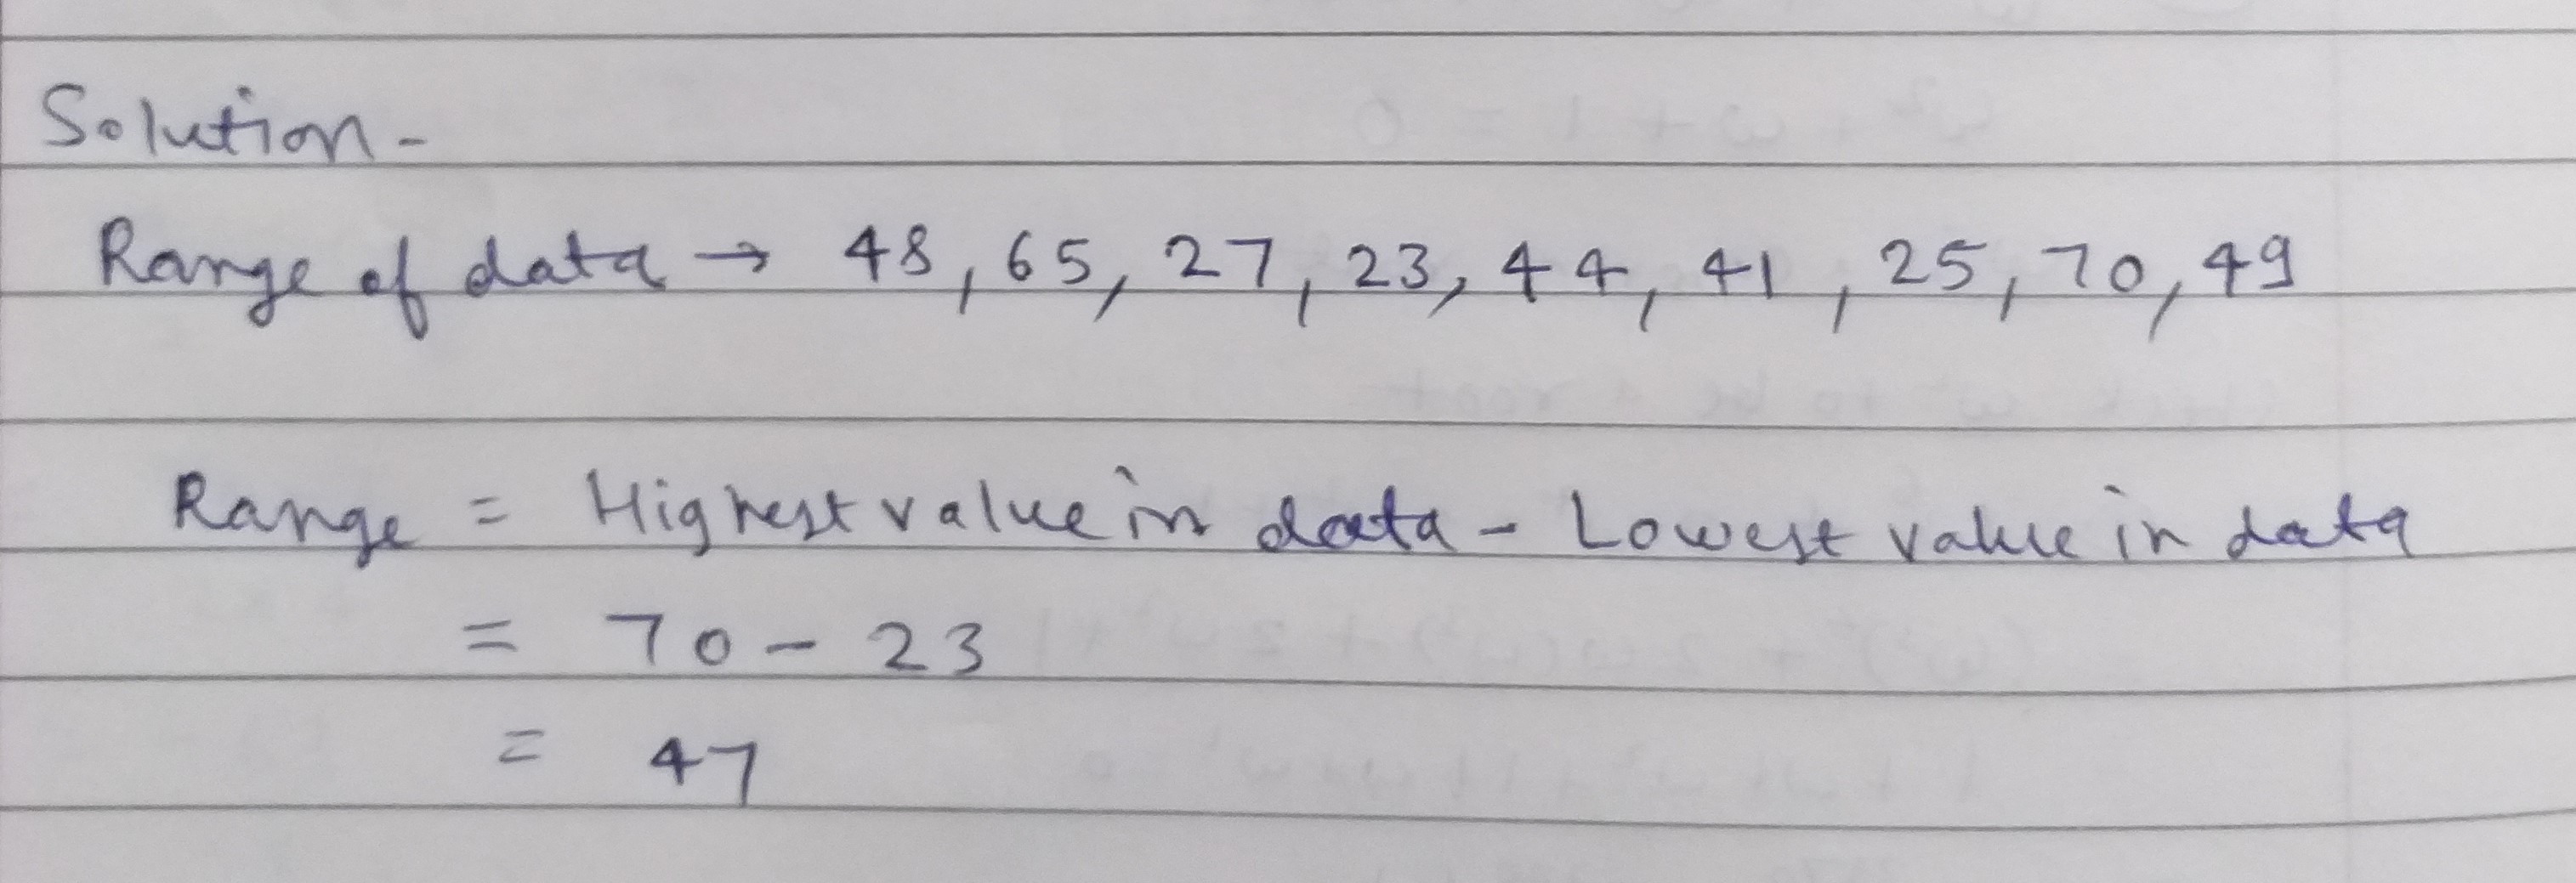
What is the range of the data : $$ 48, 65, 27, 23, 44, 41, 25, 70, 49$$ ?
Find the mean $$S.D$$ of $$1,2,3,4,5,6$$.
Find the sum of deviation of all observations of the data 5, 8, 10, 15, 22 from their mean.
Find the mode of this data
$$2,5,4,3,5,2,5,2,4,5$$
The rainfall ( in mm) in a city on $$7$$ days of a certain week was recorded as follows:
Days | Mon | Tue | Wed | Thurs | Fri | Sat | Sun |
Rainfall ( in mm) | 0.0 | 12.2 | 2.1 | 0.0 | 20.5 | 5.5 | 1.0 |
i) Find the range of the rainfall in the above data.
The runs scored in a cricket match by $$11$$ players is as follows:
$$6, 15, 120, 50, 100, 80, 10, 15, 8, 10, 15$$
Find the mean, mode and median of this data. Are the three same?
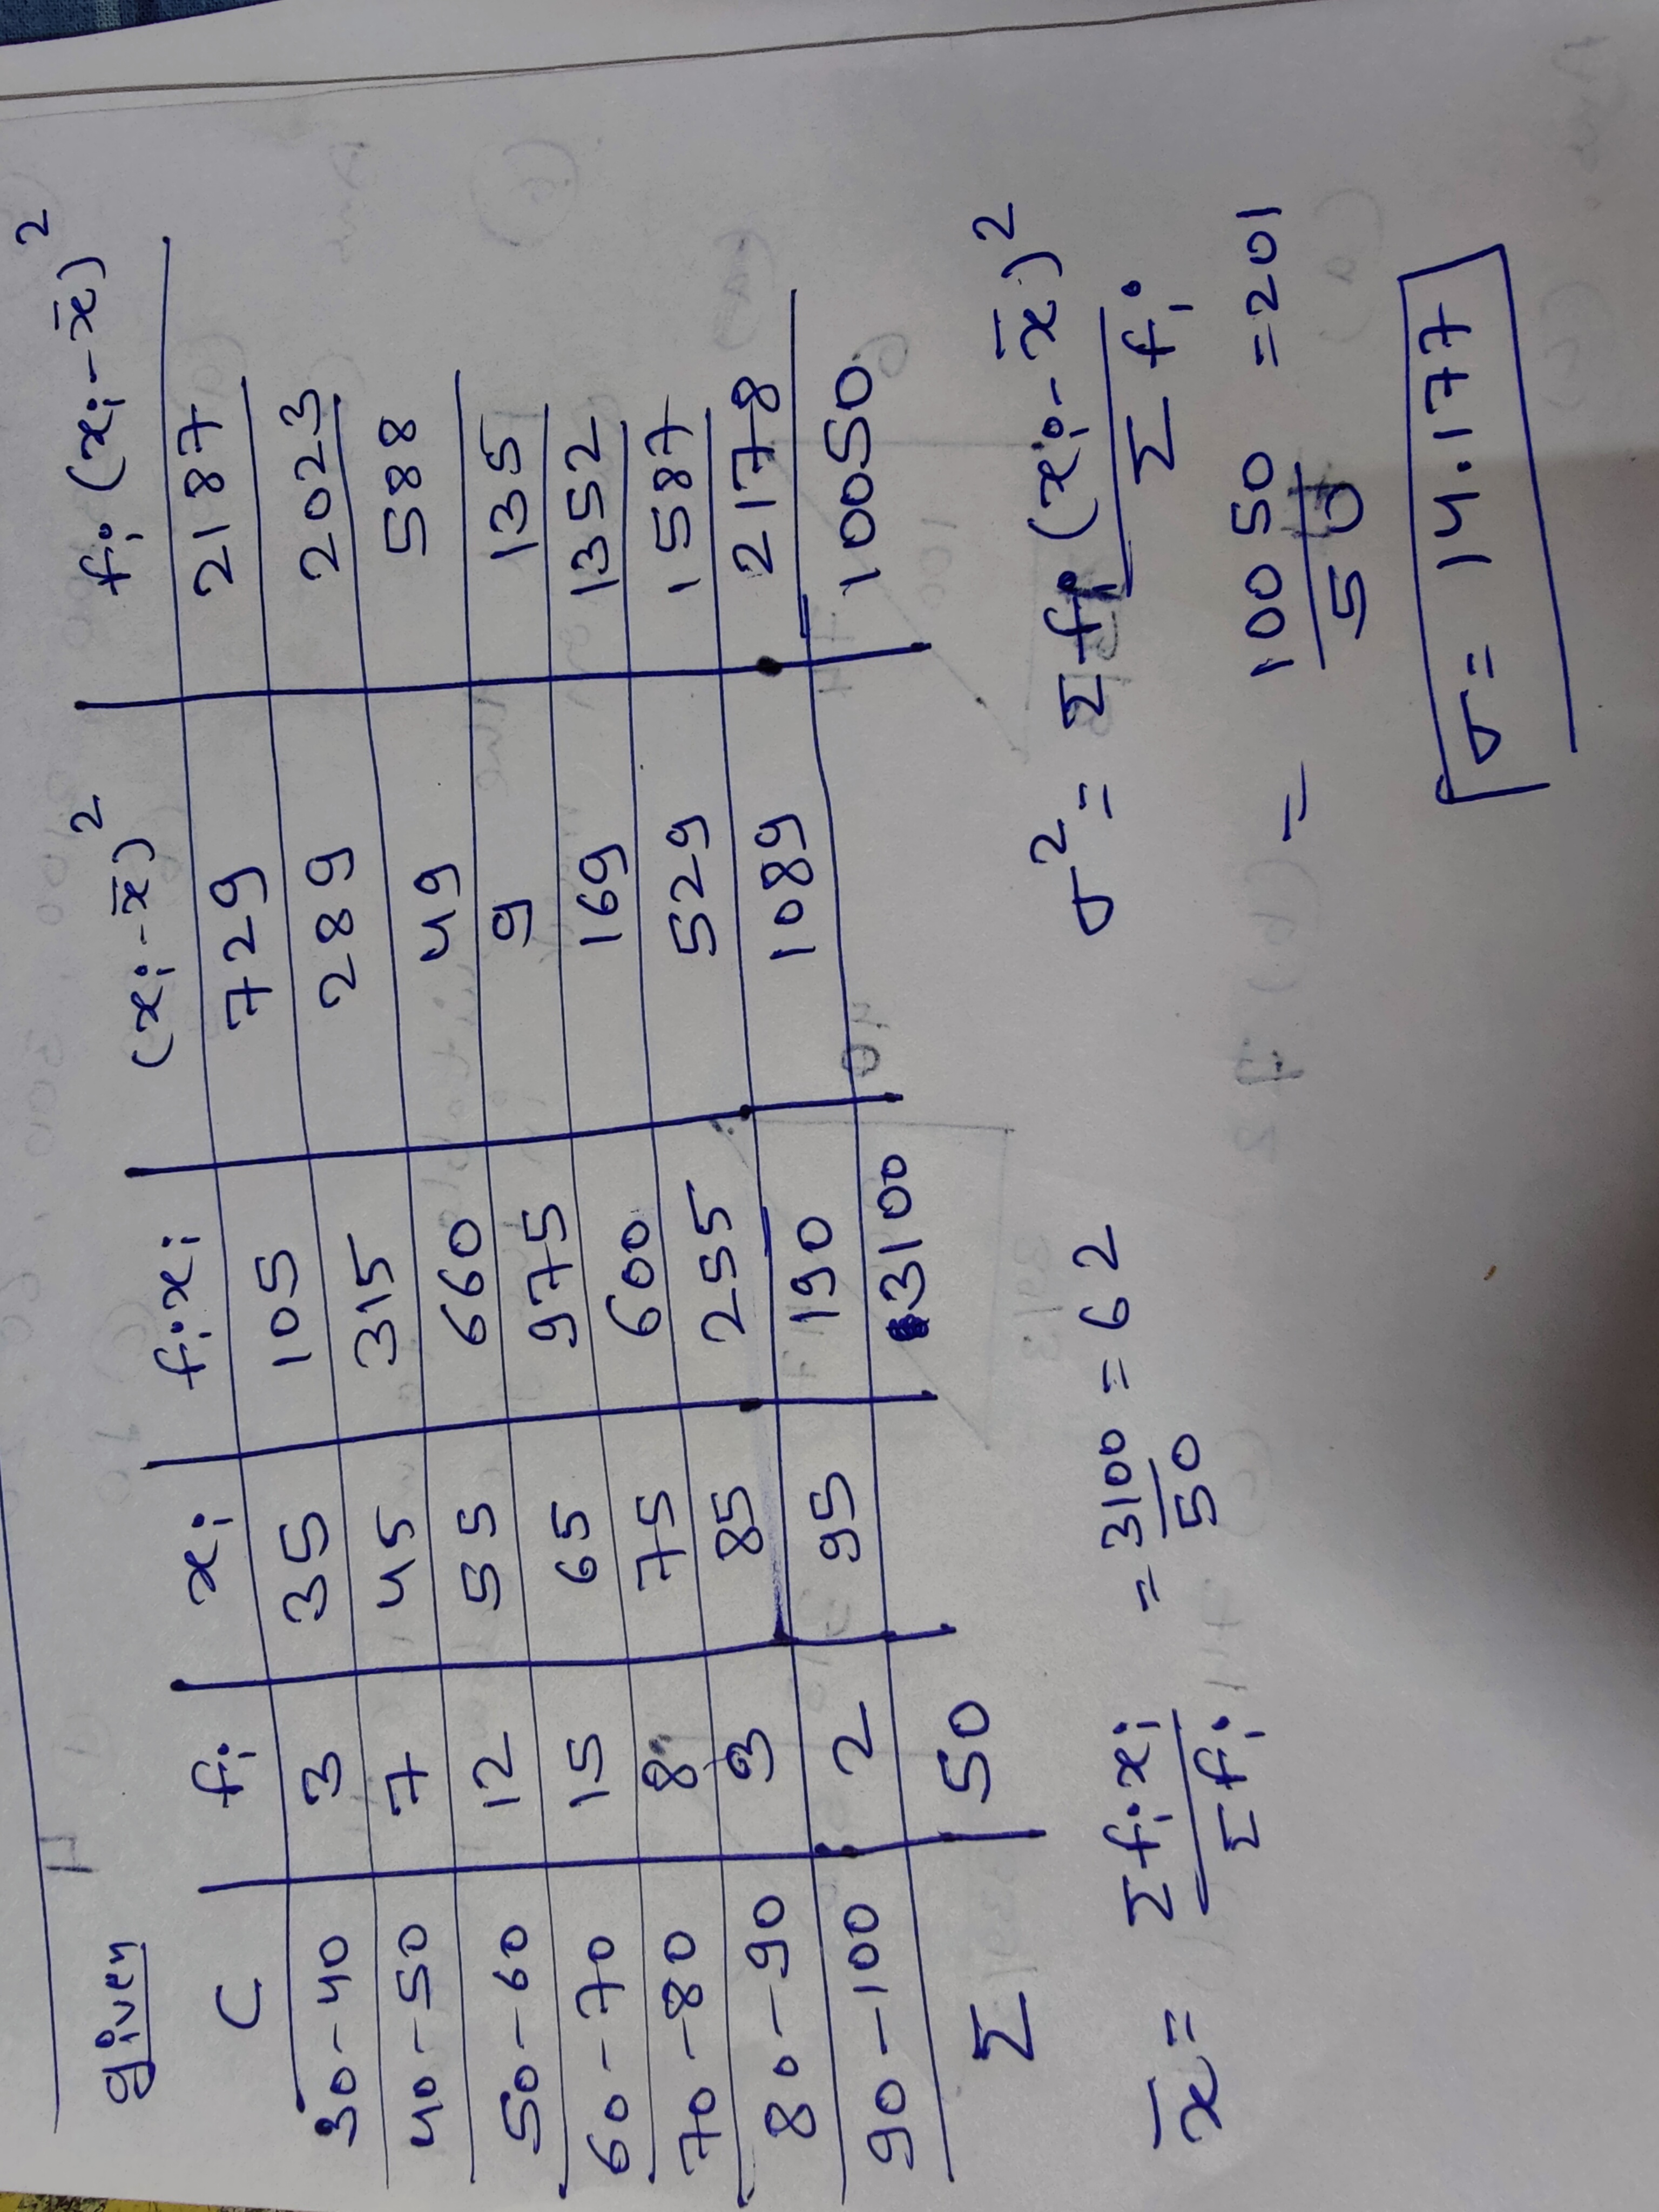
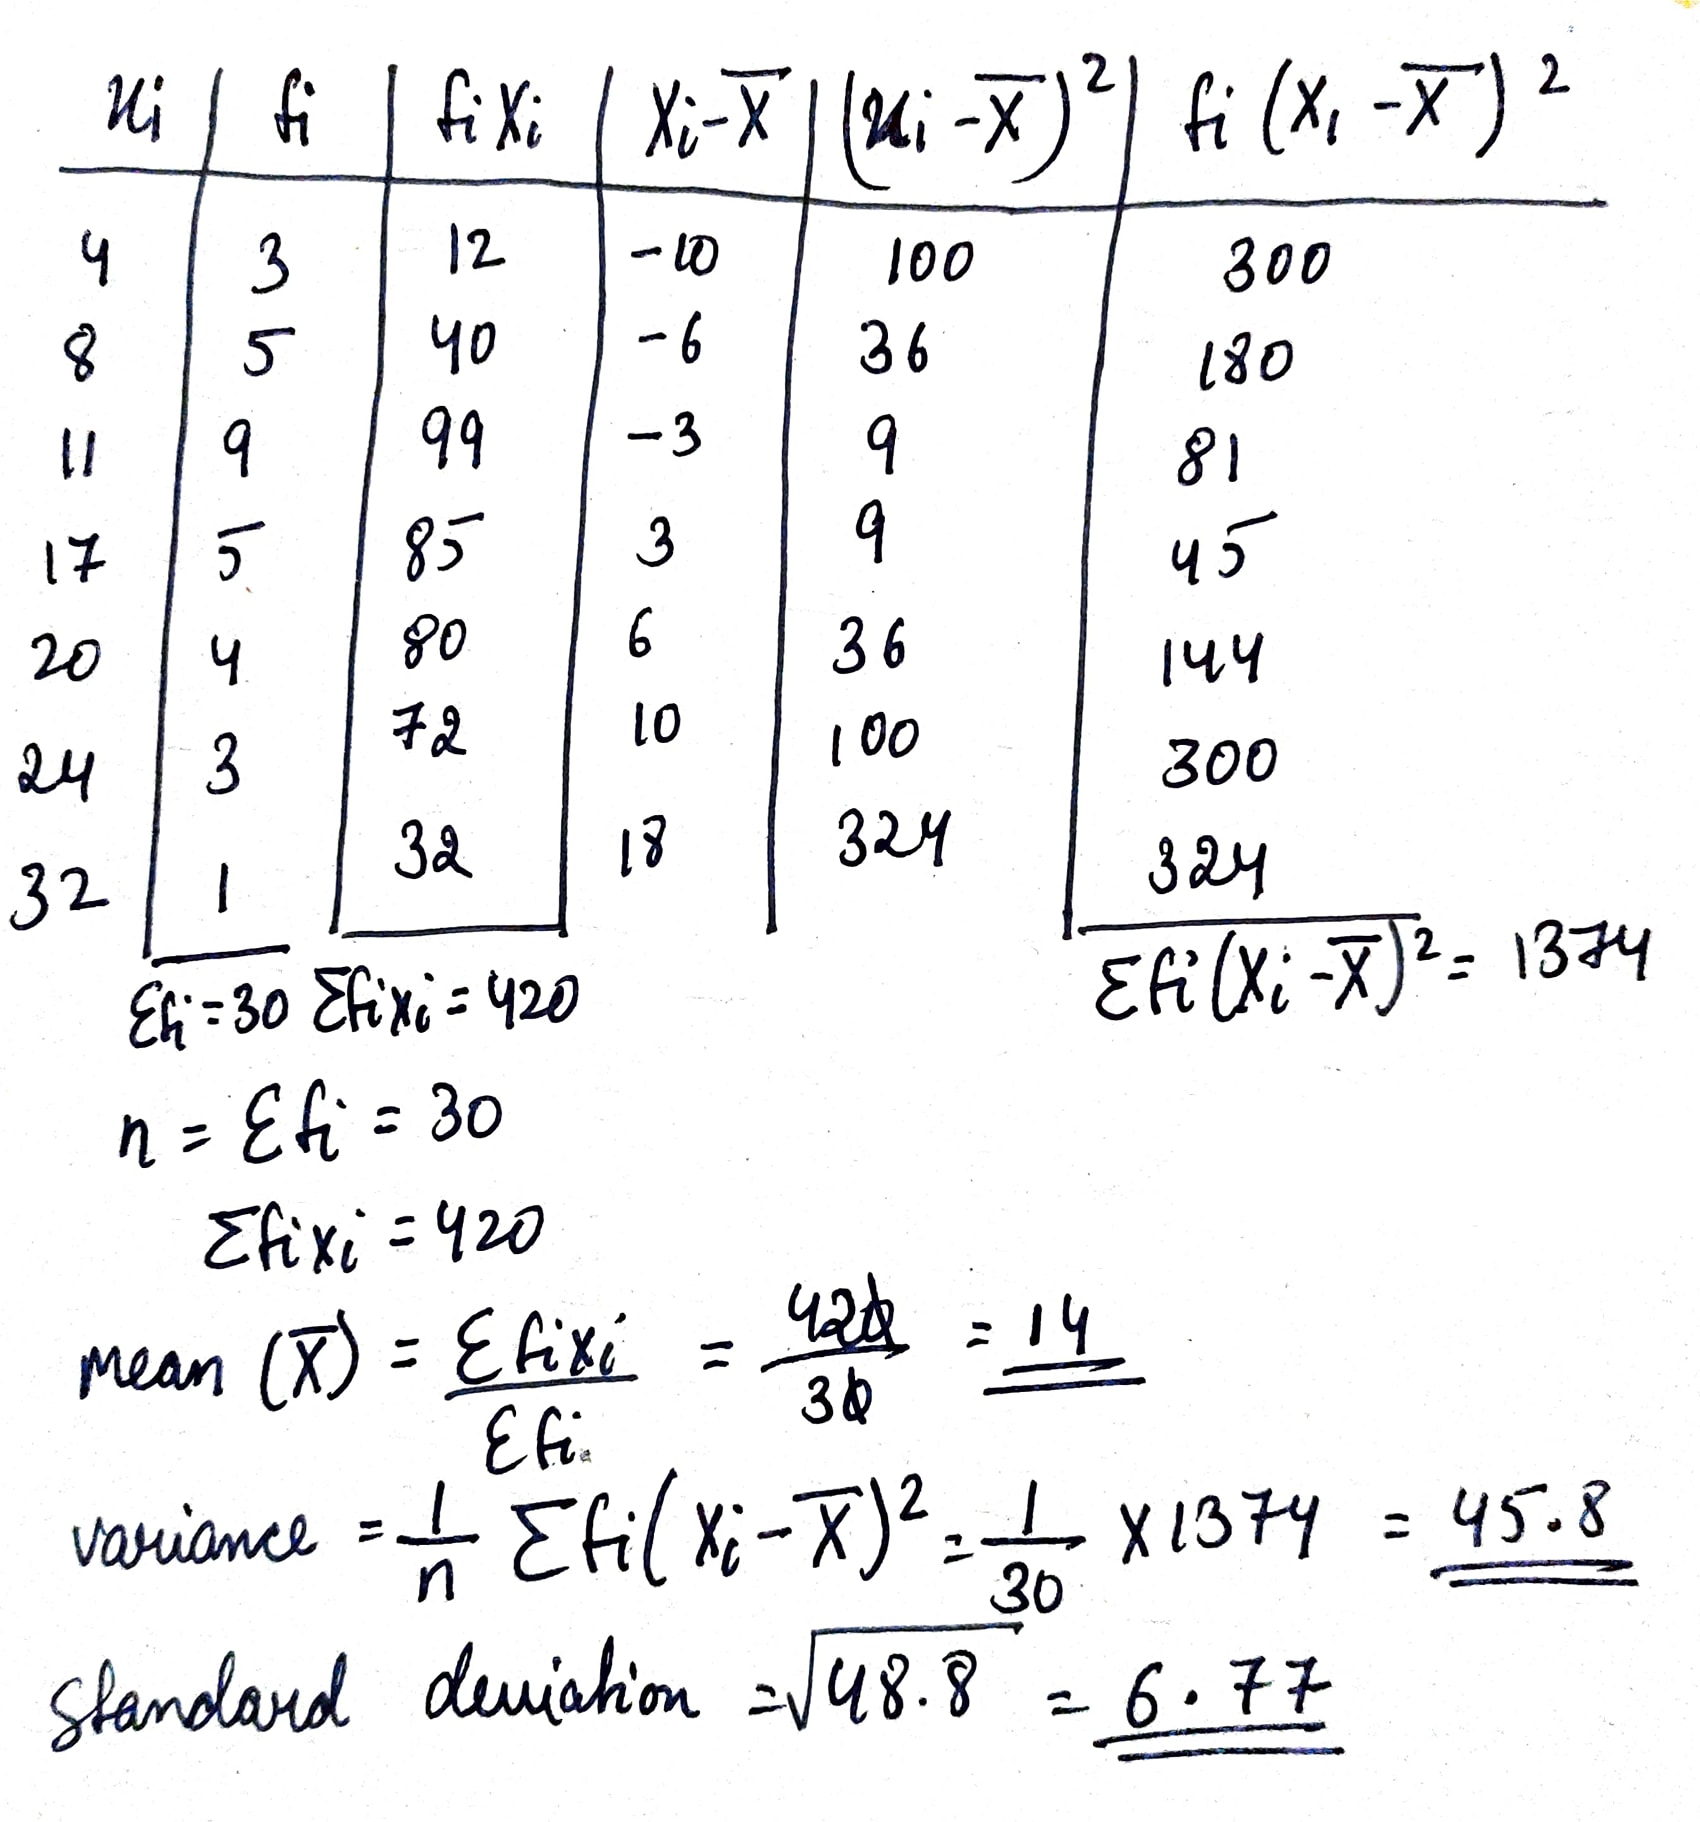
Calculate the variance and standard deviation of the following continuous frequency distribution
| Class interval | $$30-40$$ | $$40-50$$ | $$50-60$$ | $$60-70$$ | $$70-80$$ | $$80-90$$ | $$90-100$$ |
| Frequency | $$3$$ | $$7$$ | $$12$$ | $$15$$ | $$8$$ | $$3$$ | $$2$$ |
Find the standard deviation of $$9,16,23,30,37,44,51$$.
Find the median of:
$$26, 33, 41, 18, 30, 22, 36, 45$$ and $$24$$
The S. D of $$15$$ items is $$6$$ and if each item is decreased by $$1 $$, then standard deviation will be
Find the median of:
$$3.2, 4.8, 5.6, 7.3, 8.9$$ and $$9.1$$
Let $$a, b, c, d$$ and $$e$$ be the observations with mean $${ m }$$ and standard deviation $$s$$. The standard deviation of the observations $$a $$ $$+ { k } , b+k ,c+k , d+k$$ and $$e+k$$ is
Find the median of:
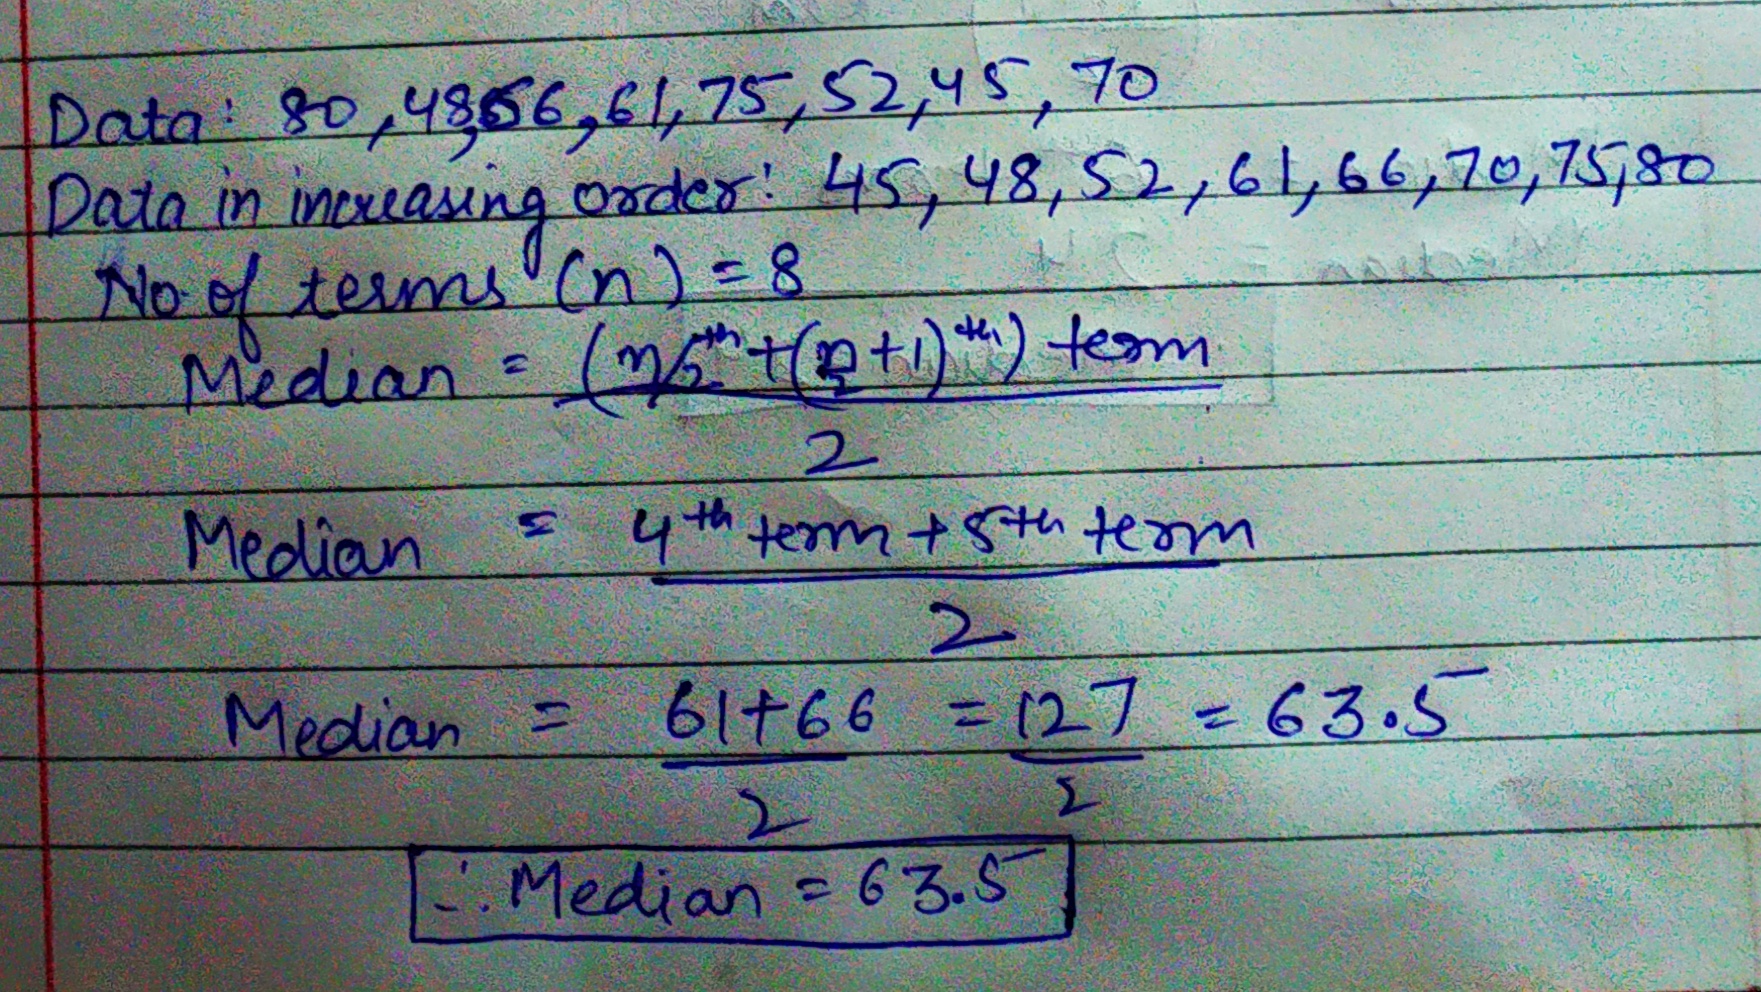
$$80, 48, 66, 61, 75, 52, 45$$ and $$70$$
Find the coefficient of range for the following data.
| Size | $$10-15$$ | $$15-20$$ | $$20-25$$ | $$25-30$$ |
| Frequency | $$2$$ | $$4$$ | $$6$$ | $$8$$ |
Following tare the lives in hours of $$15$$ pieces of the components of aircraft engine$$.$$ Find the median$$:$$ $$715,724,725,710,729,745,694,699,696,712,734,728,716,705,719$$
Find the median of $$8, 15, 7, 19, 16, 12$$ and $$10$$
What is mode ?
If the median of $$\cfrac{a}{3},\cfrac{a}{2},\cfrac{a}{4},\cfrac{{2a}}{5},\cfrac{a}{6}$$ is $$12$$ then find the value of $$a\left( {a > 0} \right)$$.
The median of the given data 6,8,9,15,x,29,25,21,22 is 18, find value of x ?
Calculate variance and standard deviation of the following data :10, 12, 8, 14, 16
Find the median of the following :
33,31,48,45,41,92,78,51,61
A die is tossed thrice. Getting an even number is considered as success. What is the variance of the binomial distribution ?
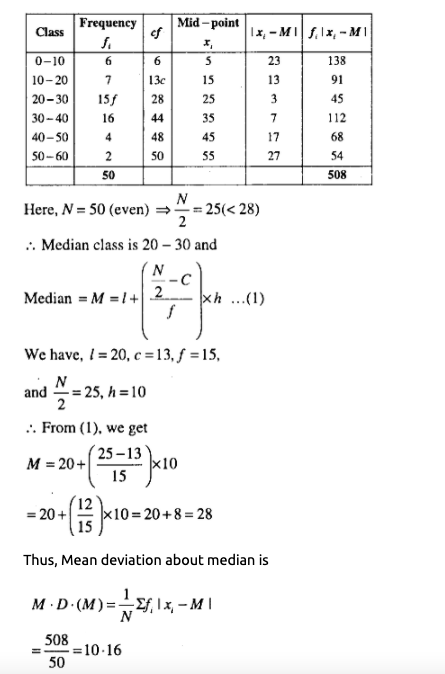
Find the mean deviation from the mean of the following data, using the step deviation method:
| Marks | No. of students |
| 0-10 | 6 |
| 10-20 | 5 |
| 20-30 | 8 |
| 30-40 | 15 |
| 40-50 | 7 |
| 50-60 | 6 |
| 60-70 | 3 |
From the following frequency distribution, find :
(i) the median
(ii) lower quartile
(iii) upper quartile
(iv) inter quartile range
Variate | 15 | 18 | 20 | 22 | 25 | 27 | 30 |
Frequency | 4 | 6 | 8 | 9 | 7 | 8 | 6 |
A data has $$13$$ observations arranged in descending order. Which observation represents the median of data?
The distribution below gives weights of $$30$$ students of a class. Find the median weight of the students.
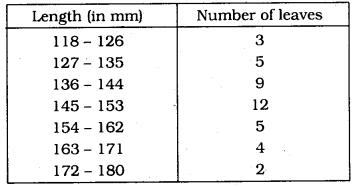
The length of $$40$$ leaves of a plant are measured correctly of the nearest millimeter, and the data obtained is represented in the following table:
Find the median length of the leaves.
The average weight of $$40$$ Students is $$32$$. If the Heaviest and Lightest are excluded the average weight reduces by $$1$$. If only the Heaviest is excluded then the average is $$31$$. Then what is the weight of the Lightest?
The exam scores of all 500 students were recorded and it was determined that these scores were normally distributed. If Jane's score is 0.8 standard deviation above the mean, then how many, to the nearest unit, students scored above Jane?
25, 16, 26, 16, 32, 31, 19, 28 and 35
Find the mode of the following distribution:
| Income (in rupees) | 500-600 | 400-500 | 300-400 | 200-300 | 100-200 |
| Number of persons | 17 | 20 | 30 | 18 | 15 |
Find the mode of the following data:
| Marks below | 10 | 20 | 30 | 40 | 50 |
| Number of students | 3 | 8 | 17 | 20 | 22 |
Find the mode of the following distribution:
| Marks more than | 0 | 10 | 20 | 30 | 40 | 50 |
| Number of students | 50 | 46 | 40 | 20 | 10 | 3 |
Find the mode of the following distribution:
| Marks | 4 | 5 | 6 | 7 | 8 | 9 | 10 |
| Frequency | 3 | 8 | 10 | 12 | 16 | 12 | 10 |
Find the mode of the following distribution:
| Age in (years) | 0-10 | 10-20 | 20-30 | 30-40 | 40-50 | 50-60 | 60-70 |
| Frequency | 8 | 14 | 25 | 28 | 25 | 10 | 5 |
Find the mode of the following data:
| Class interval | 11 | 12 | 13 | 14 | 15 | 16 | 17 | 18 |
| Frequency | 2 | 9 | 3 | 4 | 8 | 7 | 8 | 3 |
Find the median of
$$3.2,4.8,5.6,5.6,7.3,8.9$$ and $$91$$
The marks (out of $$100$$) obtained by $$7$$ students in Mathematics examination are given below. Find the mode for these marks.
$$99, 100, 95, 100, 100, 60, 90$$
2.5 2.5 2.1 2.5 2.7 2.8 2.5
2 4 6 2 6 6 7 8
Find the mode of the following data.
| Marks | 35 | 36 | 37 | 38 | 39 | 40 |
| No of Student | 09 | 07 | 09 | 04 | 04 | 02 |
Find mode of the following frequency distribution :
| x | 3 | 4 | 5 | 6 | 7 | 8 |
| f | 2 | 4 | 6 | 3 | 2 | 1 |
A data has 19 observations arranged in descending order which observation represents the median data?
Find mode of the following frequency distribution :
| x | 1.1 | 1.2 | 1.3 | 1.4 | 1.5 | 1.6 |
| f | 20 | 50 | 80 | 60 | 15 | 8 |
2 5 7 5 3 1 5 8 7 5
The weights of $$10$$ students (in kg) are given below :$$40, 35, 42, 43, 37, 35, 37, 37, 42, 37$$
Find the mode of the data.
Find the mode of the data.
The number of members in 30 families of a village are according to following table.
Find their mode.
| No. of members | 2 | 3 | 4 | 5 | 6 | 7 | 8 |
| No. of families | 1 | 2 | 4 | 6 | 10 | 3 | 5 |
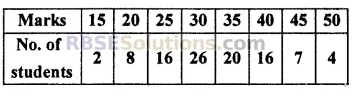
Marks obtained by students are given below, find the mode of marks.
| Marks | 10 | 20 | 30 | 40 | 50 | 60 | 70 | 80 |
| No. of Students | 2 | 8 | 16 | 26 | 20 | 16 | 7 | 4 |
Age in years of 20 students of a class are as follows:
15 16 13 14 14
13 15 14 13 13
14 12 15 14 16
13 14 14 13 15
Find mode by expressing them in frequency distribution:
Find the median of :
$$66, 98, 54, 92, 87, 63, 72$$
Find mode of the following frequency distribution
| Marks | No. of Students |
| 0 - 10 | 5 |
| 10 - 20 | 12 |
| 20 - 30 | 14 |
| 30 - 40 | 10 |
| 40 - 50 | 8 |
| 50 - 60 | 6 |
Find the mode of $$0, 5, 2, 7, 2, 1, 1, 3, 2, 4, 5, 7, 5, 1$$ and $$2$$
Find the mean and variance for the data $$6, 7, 10 , 12, 13, 4, 8, 12$$
Find the mean and variance for the data
| $$ \displaystyle X_{i} $$ | 6 | 10 | 14 | 18 | 24 | 28 | 30 |
| $$ \displaystyle f_{i} $$ | 2 | 4 | 7 | 12 | 8 | 4 | 3 |
Find the mean deviation about the mean for the data
$$4, 7, 8, 9, 10, 12, 13, 17$$
Find the mean and standard deviation using short-cut method
| $$ \displaystyle X_{i} $$ | 60 | 61 | 62 | 63 | 64 | 65 | 66 | 67 | 68 |
| $$ \displaystyle f_{i} $$ | 2 | 1 | 12 | 29 | 25 | 12 | 10 | 4 | 5 |
Find the mean and variance for the following frequency distrubution
| Classes | 0-10 | 10-20 | 20-30 | 30-40 | 40-50 |
| Frequencies | 5 | 8 | 15 | 16 | 6 |
Find the mean and variance for the following frequency distribution
| Classes | 0-30 | 30-60 | 60-90 | 90-120 | 120-150 | 150-180 | 180-210 |
| Frequencies | 2 | 3 | 5 | 10 | 3 | 5 | 2 |
Find the mean deviation about the mean for the data
$$38, 70, 48, 40, 42, 55, 63, 46, 54, 44$$
Find the mean and variance for the data
| $$ \displaystyle X_{i} $$ | 92 | 93 | 97 | 98 | 102 | 104 | 109 |
| $$ \displaystyle f_{i} $$ | 3 | 2 | 3 | 2 | 6 | 3 | 3 |
Find the mean variance and standard deviation using short-cut method
| Height in cms | No. of children |
| 70-75 | 3 |
| 75-80 | 4 |
| 80-85 | 7 |
| 85-90 | 7 |
| 90-95 | 15 |
| 95-100 | 9 |
| 100-105 | 6 |
| 105-110 | 6 |
| 110-115 | 3 |
Find the mean deviation about the median for the data $$13, 17, 16, 14, 11, 13, 10, 16, 11, 18, 12, 17$$.
The sum and sum of squares corresponding to length $$X$$ (in cm ) and weight $$y$$
(in gm) of $$50$$ plant products are given below:
$$ \displaystyle \sum_{i=l}^{50}X_{i}=212, \sum_{i=l}^{50} X_{i}^{2}=902.8, \sum_{i=l}^{50}y_{i}=261,\sum_{i=l}^{50}y_{i}^{2}=1457.6 $$
Which is more varying the length or weight ?
The mean and variance of eight observation are $$9$$ and $$9.25,$$ respectively. If six of the observation are $$6, 7, 10, 12, 12$$ and $$13$$, find the remaining two observations.
The mean and standard deviation of marks obtained by $$50$$ students of a class in three
subjects Mathematics, Physics and chemistry are given below :
| Subject | Mathematics | Physics | Chemistry |
| Mean | 42 | 32 | 40.9 |
| Standard deviation | 12 | 15 | 20 |
lowest ?
The mean and standard deviation of a group of $$100$$ observations were found to be $$20$$ and $$3$$ respectively. Later on it was found that three observations were incorrect which were recorded as $$21, 21$$ and $$18$$. Find the mean and standard deviation if the incorrect observation are omitted
From the data given below state which group is more variable $$A$$ or $$B$$
| Marks | 10-20 | 20-30 | 30-40 | 40-50 | 50-60 | 60-70 | 70-80 |
| Group A | 9 | 17 | 32 | 33 | 40 | 10 | 9 |
| Group B | 10 | 20 | 30 | 25 | 43 | 15 | 7 |
The diameters of circles (in $$mm$$) drawn in a design are given below :
| Diameters | No. of circles |
| $$33-36$$ | $$15$$ |
| $$37-40$$ | $$17$$ |
| $$41-44$$ | $$21$$ |
| $$45-48$$ | $$22$$ |
| $$49-52$$ | $$25$$ |
Given that $$ \displaystyle \bar{X} $$ is the mean and $$ \displaystyle \sigma ^{2} $$ is the variance of $$ \displaystyle n $$ observations $$ \displaystyle X_{1},X_{2}...X_{n } $$. Prove that the mean and variance of the observations $$ \displaystyle aX_{1},aX_{2},aX_{3}....aX_{n } $$ are $$ \displaystyle \bar{ax} $$ and $$ \displaystyle a^{2}\sigma ^{2} $$ respectively $$ \displaystyle (a\neq 0) $$.
From the prices of shares $$X$$ and $$Y$$ below find out which is more stable in value :
| X | 35 | 54 | 52 | 53 | 56 | 58 | 52 | 50 | 51 | 49 |
| Y | 108 | 107 | 105 | 105 | 106 | 107 | 104 | 103 | 104 | 101 |
The mean and standard deviation of $$20$$ observation are found to be $$10$$ and $$2$$ respectively. On rechecking it was found that an observation $$8$$ was incorrect. Calculate the correct mean and standard deviation in each of the following cases :
(i) If wrong item is omitted
(ii) If it is replaced by $$12$$
The mean and standard deviation of six observation are $$8$$ and $$4$$ respectively. If each observation is multiplied by $$3$$, find the new mean and new standard deviation of the resulting observations.
The following number of goals were scored by a team in a series of $$10$$ matches:
$$2, 3, 4, 5, 0, 1, 3, 3, 4, 3$$
Find the mean, median and mode of these scores.
The following observations have been arranged in ascending order. If the median of the data is $$63$$, find the value of $$x$$.
$$29, 32, 48, 50, x, x+2, 72, 78, 84, 95$$
Write the marks wise frequencies in the following frequency distribution table.
| Marks | Up to $$5$$ | Up to $$6$$ | Up to $$7$$$ | Up to $$8$$ | Up to $$9$$ | Up to $$10$$ |
| No of students | $$5$$ | $$11$$ | $$19$$ | $$31$$ | $$40$$ | $$45$$ |
Find the mean deviation about mean for the following data:
$$14, 21, 28, 21, 18$$
The relative humidity (in %) of a certain city for a September month of $$30$$ days was as follows:
| $$98.1$$ | $$98.6$$ | $$99.2$$ | $$90.3$$ | $$86.5$$ | $$95.3$$ | $$92.9$$ | $$96.3$$ | $$94.2$$ | $$95.1$$ |
| $$89.2$$ | $$92.3$$ | $$97.1$$ | $$93.5$$ | $$92.7$$ | $$95.1$$ | $$97.2$$ | $$93.3$$ | $$95.2$$ | $$97.3$$ |
| $$96.0$$ | $$92.1$$ | $$84.9$$ | $$90.0$$ | $$95.7$$ | $$98.3$$ | $$97.3$$ | $$96.1$$ | $$92.1$$ | $$89$$ |
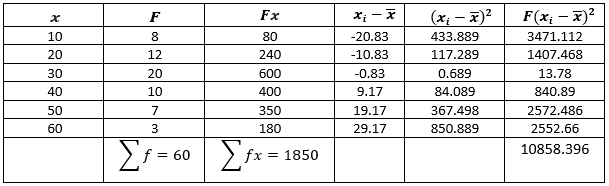
The marks scored by $$60$$ students in a science test are given below.
| Marks $$(x)$$ | $$10$$ | $$20$$ | $$30$$ | $$40$$ | $$50$$ | $$60$$ |
| No. of students $$(f)$$ | $$8$$ | $$12$$ | $$20$$ | $$10$$ | $$7$$ | $$3$$ |
Calculate the range and coefficient of range from the following data:
Number of trees planted in $$6$$ months: $$186, 234, 465, 361, 290, 142$$
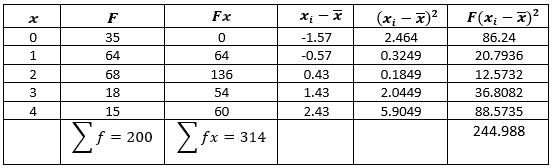
The number of books bought by $$200$$ students in a book exhibition is given below.
| No. of books | $$0$$ | $$1$$ | $$2$$ | $$3$$ | $$4$$ |
| No. of students | $$35$$ | $$64$$ | $$68$$ | $$18$$ | $$15$$ |
Find the mean deviation about median for the following data.
$$18, 23, 9, 11, 26, 4, 14, 21$$
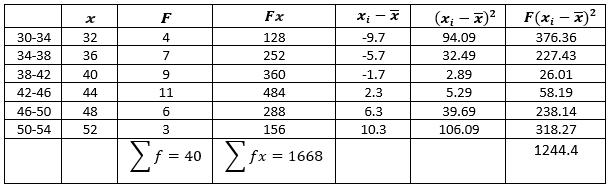
The daily wages of $$40$$ workers of a factory are given in the following table.
| Wages in Rs | $$30-34$$ | $$34-38$$ | $$38-42$$ | $$42-46$$ | $$46-50$$ | $$50-54$$ |
| No. of workers | $$4$$ | $$7$$ | $$9$$ | $$11$$ | $$6$$ | $$3$$ |
Calculate the range and coefficient of range from the following data:
Marks scored by $$12$$ students in a test: $$31, 18, 27, 19, 25, 28, 49, 14, 41, 22, 33, 13$$
Find the mean deviation about mean for the following data.
$$15, 18, 13, 16, 12, 24, 10, 20$$
If '$$x$$' varies inversely as '$$y$$' and $$x=7$$ when $$y=9$$:
(a) Find constant of variation $$(k)$$.
(b) Write equation of variation.
(c) Find '$$y$$' when $$x=9$$.
The coefficient of range of the data set $$\{3,1,4,2,5,9,8\}$$ can be represented as $$\dfrac{p}{q}$$ where $$p$$ and $$q$$ are co-primes. Then the value of $$(q-p)^2$$ is:
Find the range and the coefficient of range of $$43, 24, 38, 56, 22, 39, 45$$
Find the range and the coefficient of range of $$43, 24, 38, 56, 22, 39, 45$$
Find the mean deviation about the median for the following data.
$$13, 17, 16, 11, 13, 10, 16, 11, 18, 12, 17$$
Find the standard deviation of the first $$10$$ natural numbers.
Calculate the Standard Deviation and coefficient of variation for the given frequency table:
| Class-interval | Frequency |
| $$1-5$$ | $$1$$ |
| $$6-10$$ | $$2$$ |
| $$11-15$$ | $$3$$ |
| $$16-20$$ | $$4$$ |
Find the variance for an ungrouped data $$5, 12, 3, 18, 6, 8, 2, 10.$$
Calculate variance for the following data: $$2,4,6,8$$ and $$10$$.
Find standard deviation 50, 56, 59, 60, 63, 67, 68.
The p.m.f. of a r.v. $$X$$ is
$$P(x) = \left\{\begin{matrix}\dfrac {2x}{n(n + 1)}, & x = 1, 2, ... n;\\ 0, & otherwise.\end{matrix}\right.$$
Find $$E(X)$$ and $$Var (X)$$
Compute standard deviation for the following data.
| Class: | 0-4 | 4-8 | 8-12 | 12-16 | 16-20 |
| Frequency: | 6 | 10 | 12 | 10 | 8 |
If the mean of the data: $$7, 8, 9, 7, 8, 7, \lambda, 8$$ is $$8$$, then the variance of this data is?
In binomial distribution, the sum and the product of mean and the variance are $$\dfrac{25}{3}$$ and $$\dfrac{50}{3}$$ respectively. Determine the distribution.
Obtain the mean and standard deviation for the following data set:
| X | 10 | 20 | 30 | 40 | 50 | 60 | 70 |
| Y | 05 | 15 | 30 | 35 | 25 | 27 | 08 |
Write the formula of mode for grouped data and explain terms in it.
Given $$N = 10 , \Sigma x_i = 60$$ and $$\Sigma x_i^2= 1000 .$$ The standard deviation is
The following table given the daily wages of workers in a factory. Compute the standard deviation and the coefficient of variation of the wages of the workers.
| Wages (Rs) | $$125-175$$ | $$175-225$$ | $$225-275$$ | $$275-325$$ | $$325-375$$ | $$375-425$$ | $$425-475$$ | $$475-525$$ |
| Number of workers | $$2$$ | $$22$$ | $$19$$ | $$14$$ | $$3$$ | $$4$$ | $$6$$ | $$1$$ |
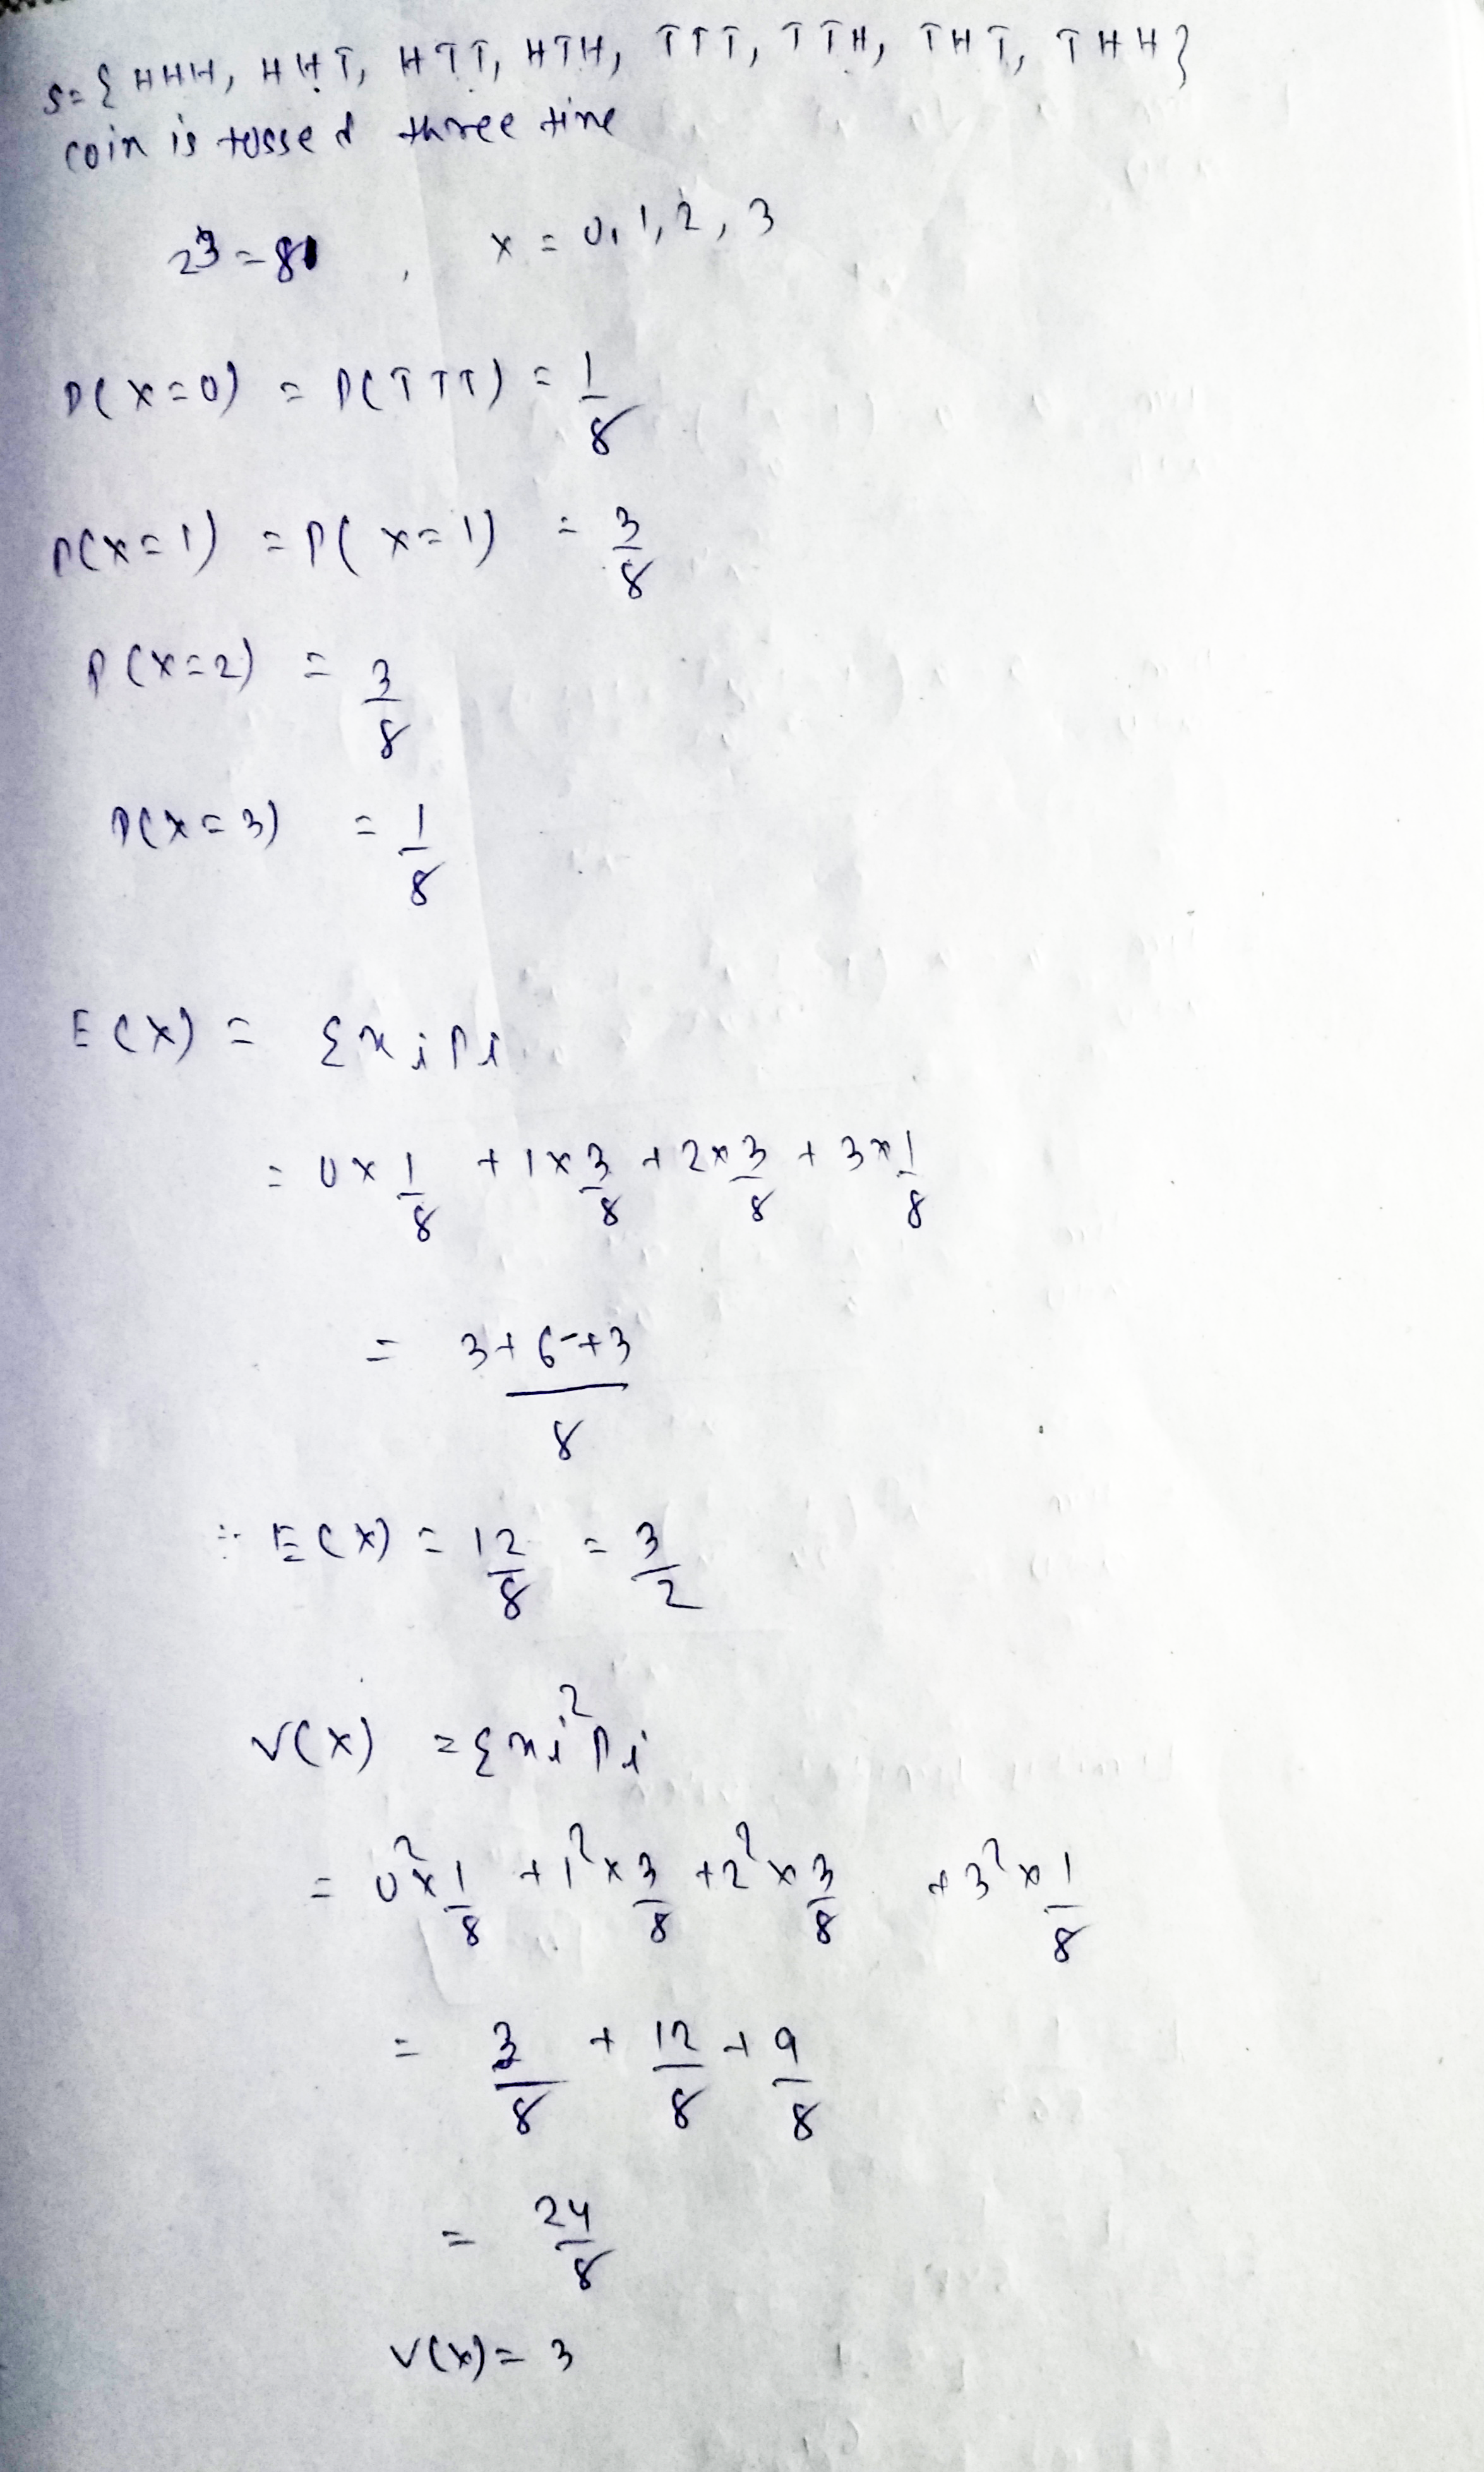
If a coin is tossed three times and $$X=$$ number of heads, then find $$E(X)$$ and $$V(X)$$.
The ages of ten students of a group are given below. The ages have been recorded in years and months:
$$8-6,9-0,8-4,9-3,7-8,8-11,8-7,9-2,7-10,8-8$$
What is the lowest age?
What is the highest age?
Determine the range?
Find the expected value, variance and standard deviation of a random variable whose $$p.m.f$$ is.
| $$X=x$$ | $$1$$ | $$2$$ | $$3$$ |
| $$p(X=x)$$ | $$\frac{1}{5}$$ | $$\frac{2}{5}$$ | $$\frac{2}{5}$$ |
On situation where mode would be an appropriate representative value.
The variance of first $$50$$ even natural numbers is
Find the mode of $$10$$ observations, if their mean is $$5$$ and median is $$4$$.
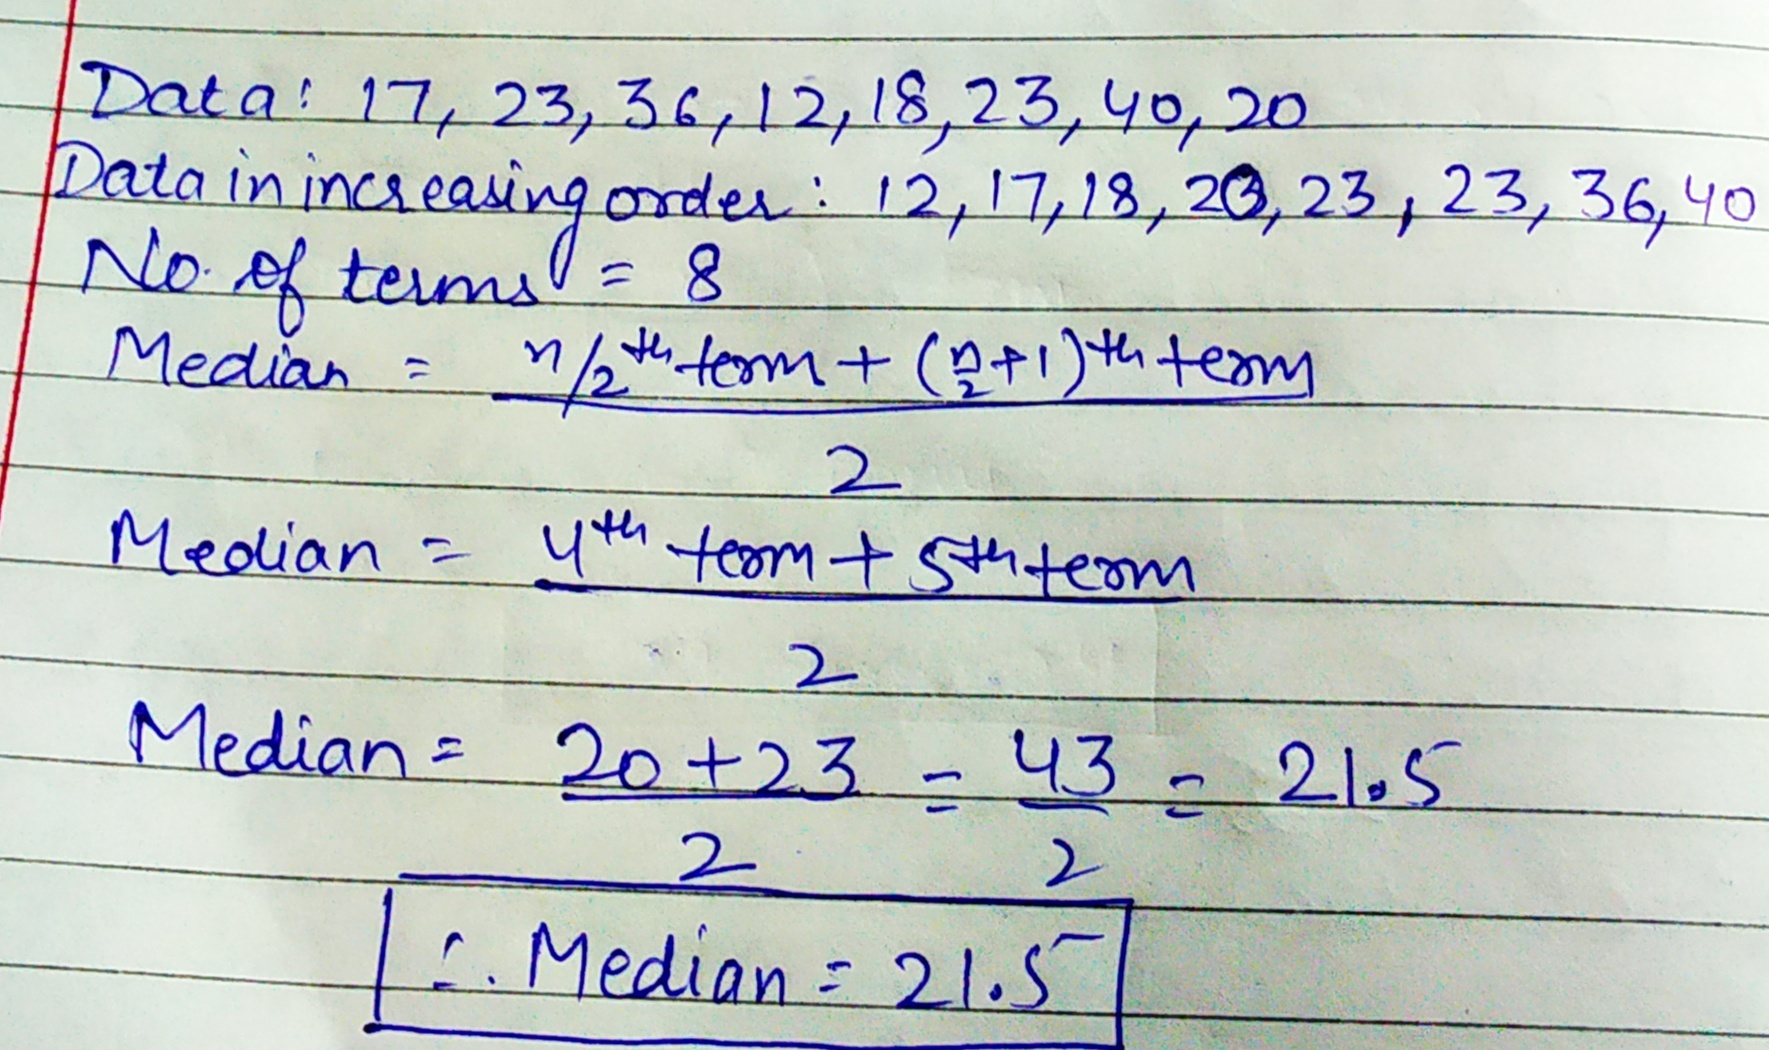
Find the median of:
$$17, 23, 36, 12, 18, 23, 40$$ and $$20$$.
The mean deviation from mean of the observation $$a,a+d,a+2d,....,a+2nd$$ is
Calculate the range and coefficient of range with following data
| Marks | 0-10 | 10-20 | 20-30 | 30-40 | 40-50 |
| No. of student | 02 | 05 | 07 | 08 | 03 |
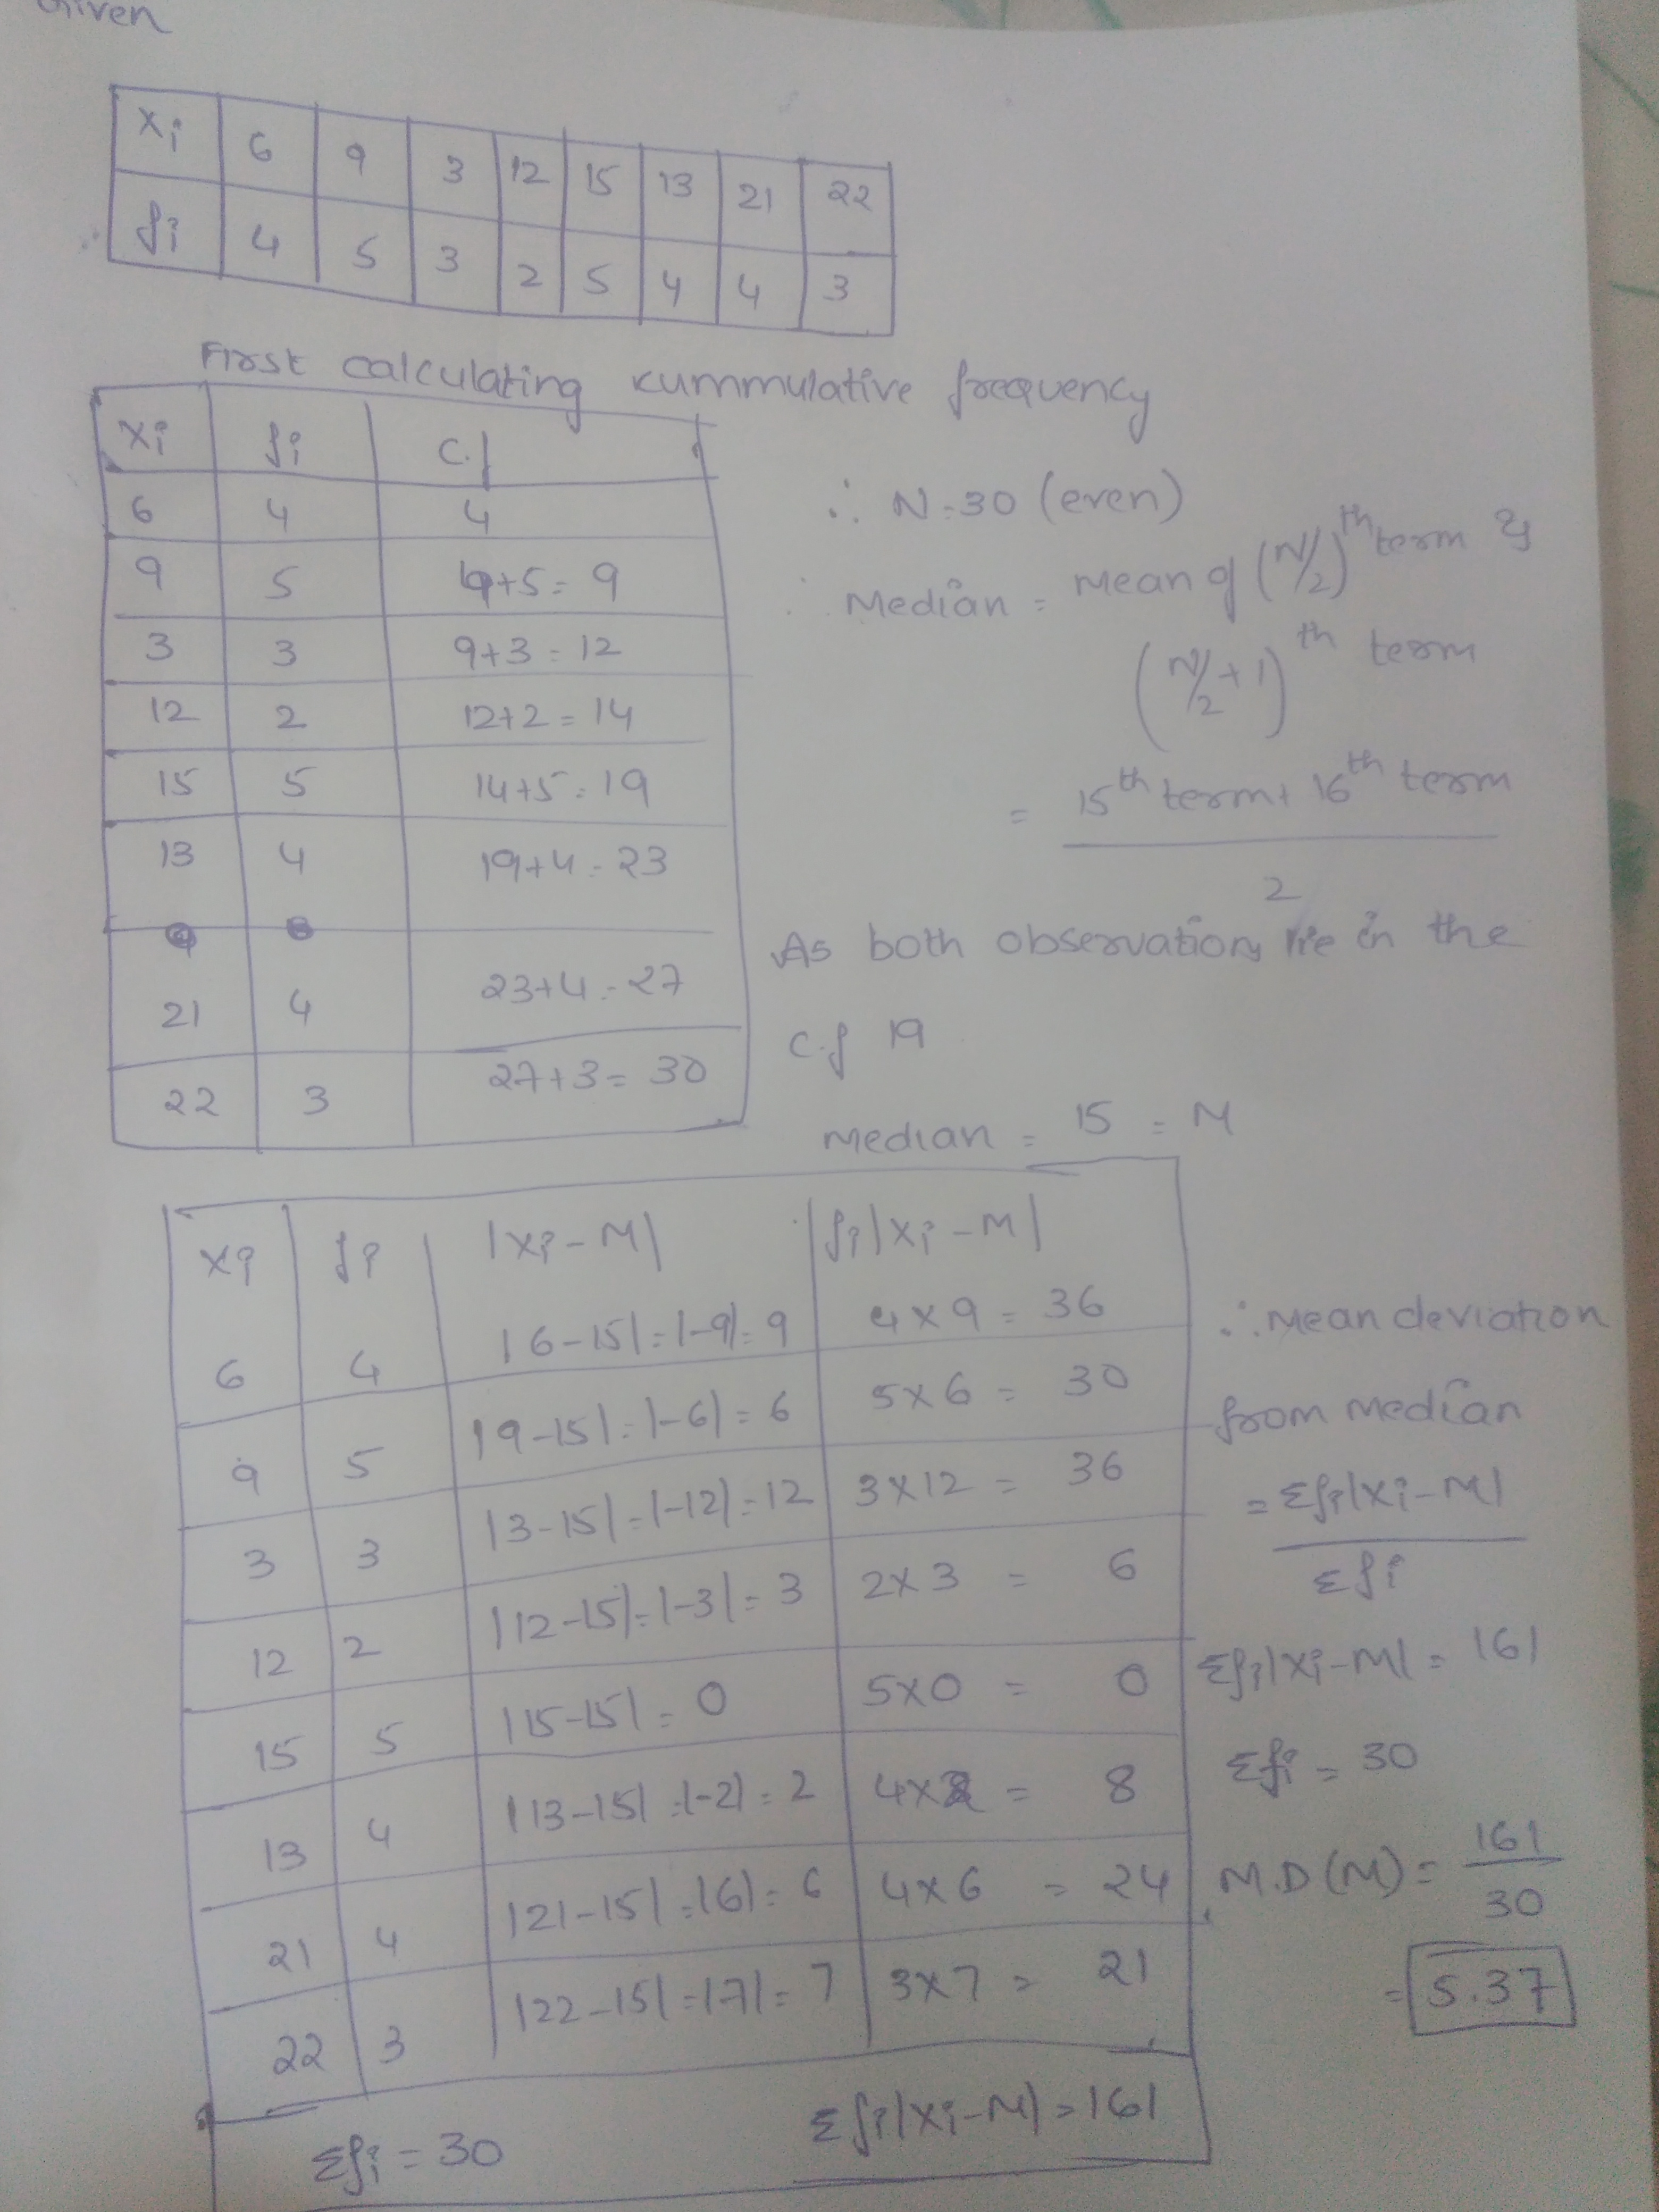
Find the mean deviation from the median for the following data:
| $$x_1^{}$$ | 6 | 9 | 3 | 12 | 15 | 13 | 21 | 22 |
| $$f_1^{}$$ | 4 | 5 | 3 | 2 | 5 | 4 | 4 | 3 |
| xi | 6 | 9 | 3 | 12 | 15 | 13 | 21 | 22 |
| fi | 4 | 5 | 3 | 2 | 5 | 4 | 4 | 3 |
| xi | fi | cf |
| 6 | 4 | 4 |
| 9 | 5 | 4+5=9 |
| 3 | 3 | 9+3=12 |
| 12 | 2 | 12+2=14 |
| 15 | 5 | 14+5=19 |
| 13 | 4 | 19+4=23 |
| 21 | 4 | 23+4=27 |
| 22 | 3 | 27+3=30 |
| xi 6 | fi 4 | $$|xi-M|$$ $$|6-15|=|-9|=9$$ | $$fi|xi-M|$$ $$4\times 9=36$$ |
| 9 | 5 | $$|9-15|=|-6|=6$$ | $$5 \times 6=30$$ |
| 3 | 3 | $$|3-15|=|-12|=12$$ | $$3 \times 12=36$$ |
| 12 | 2 | $$|12-15|=|-3|=3$$ | $$2 \times 3=6$$ |
| 15 | 5 | $$|15-15|=0$$ | $$5 \times 0=0$$ |
| 13 | 4 | $$|13-15|=|-2|=2$$ | $$4 \times 4=8$$ |
| 21 | 4 | $$|21-15|=|6|=6$$ | $$4 \times 6=24$$ |
| 22 | 3 | $$|22-15|=|7|=7$$ | $$3 \times 7=21$$ |
| $$\sum fi=30$$ | $$\sum fi|xi-M| = 161$$ |
Determine (a) the mode (b) the median , and (c) the mean for each of the following set of data :
(i) 1,16,11,6,11,8,14,11,21
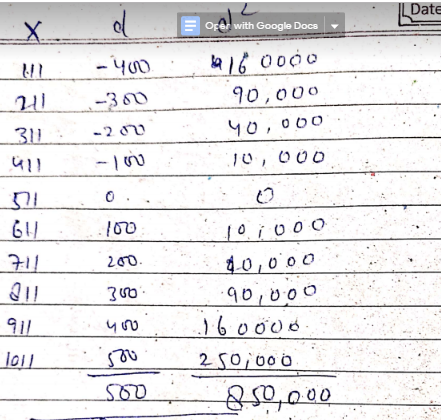
Find the standard deviation of $$10$$ observations $$111,\ 211,\ 311,...,1011$$
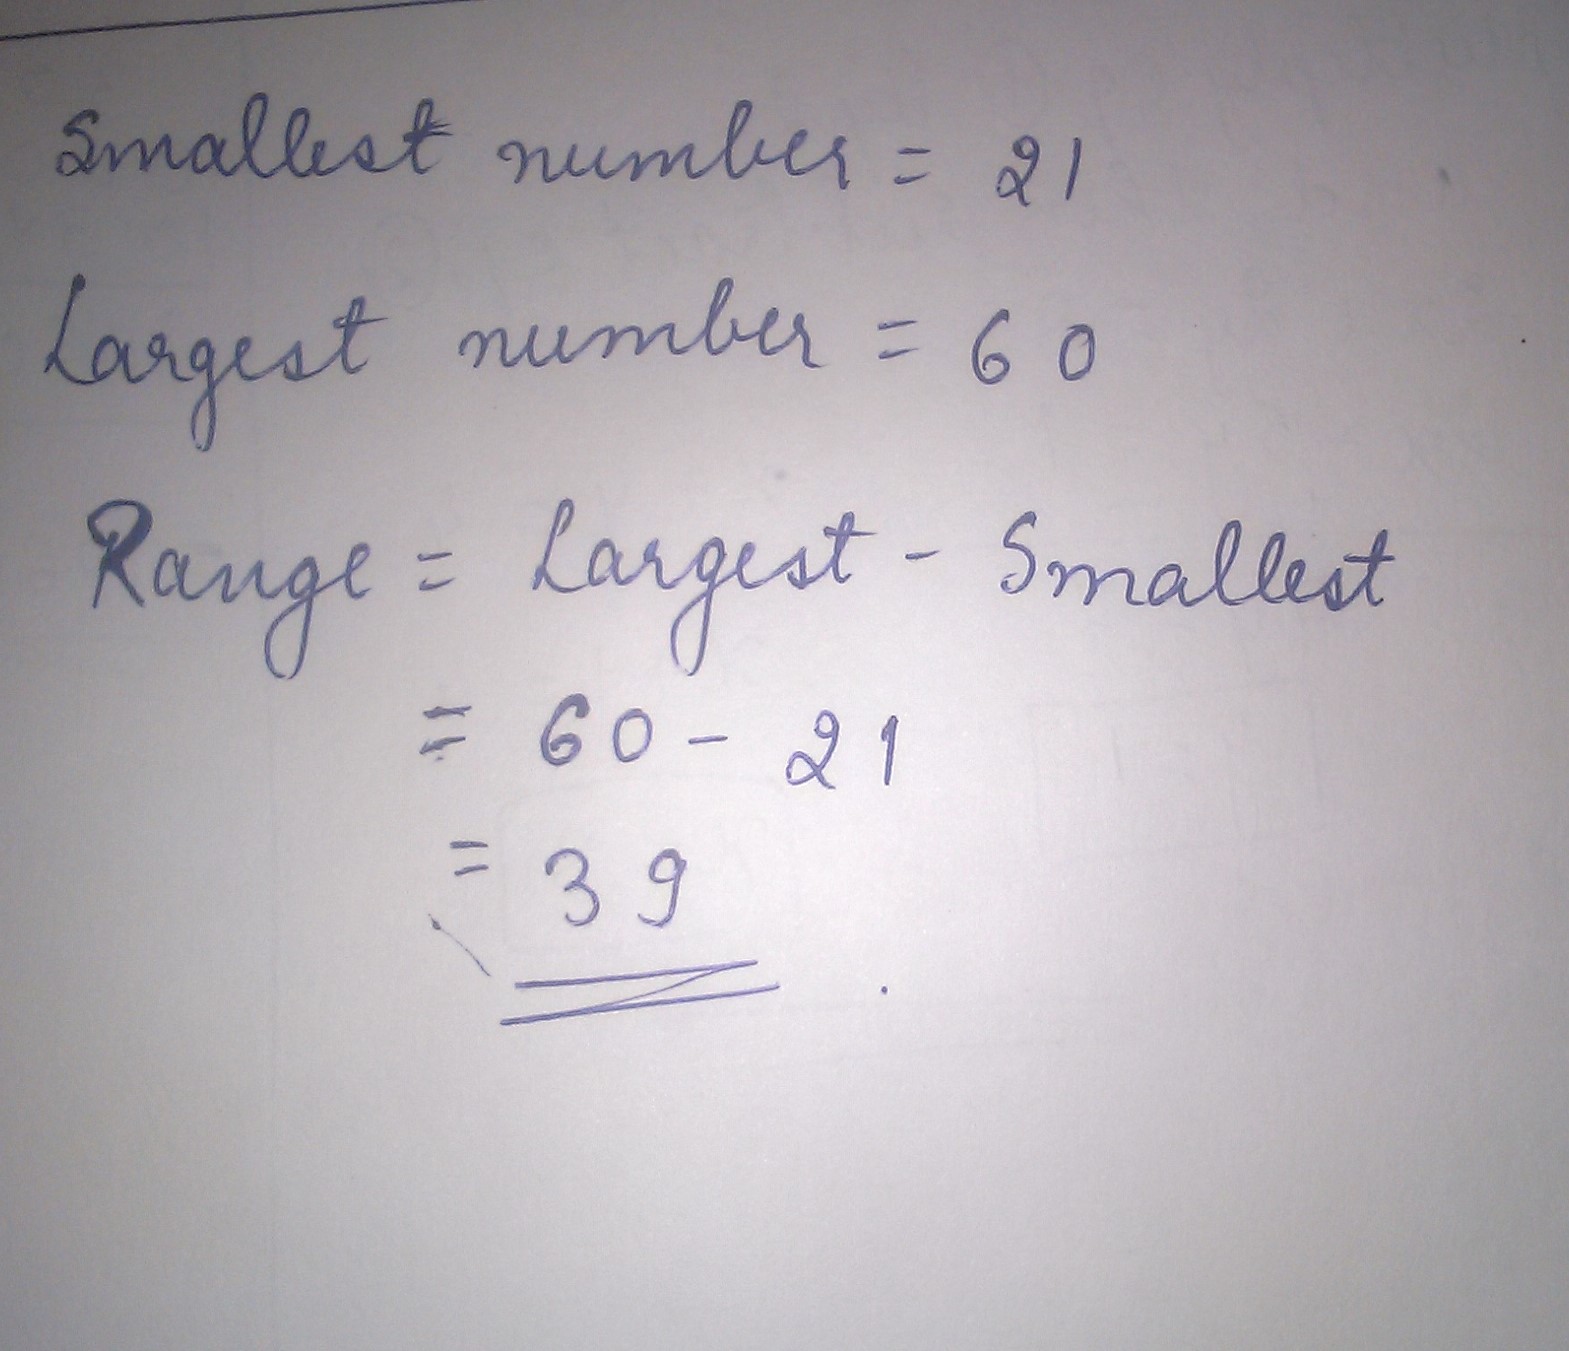
The smallest and largest numbers in the data are 21 and 60 respectively. Find the range of the data.
Define both of these:- median, altitude
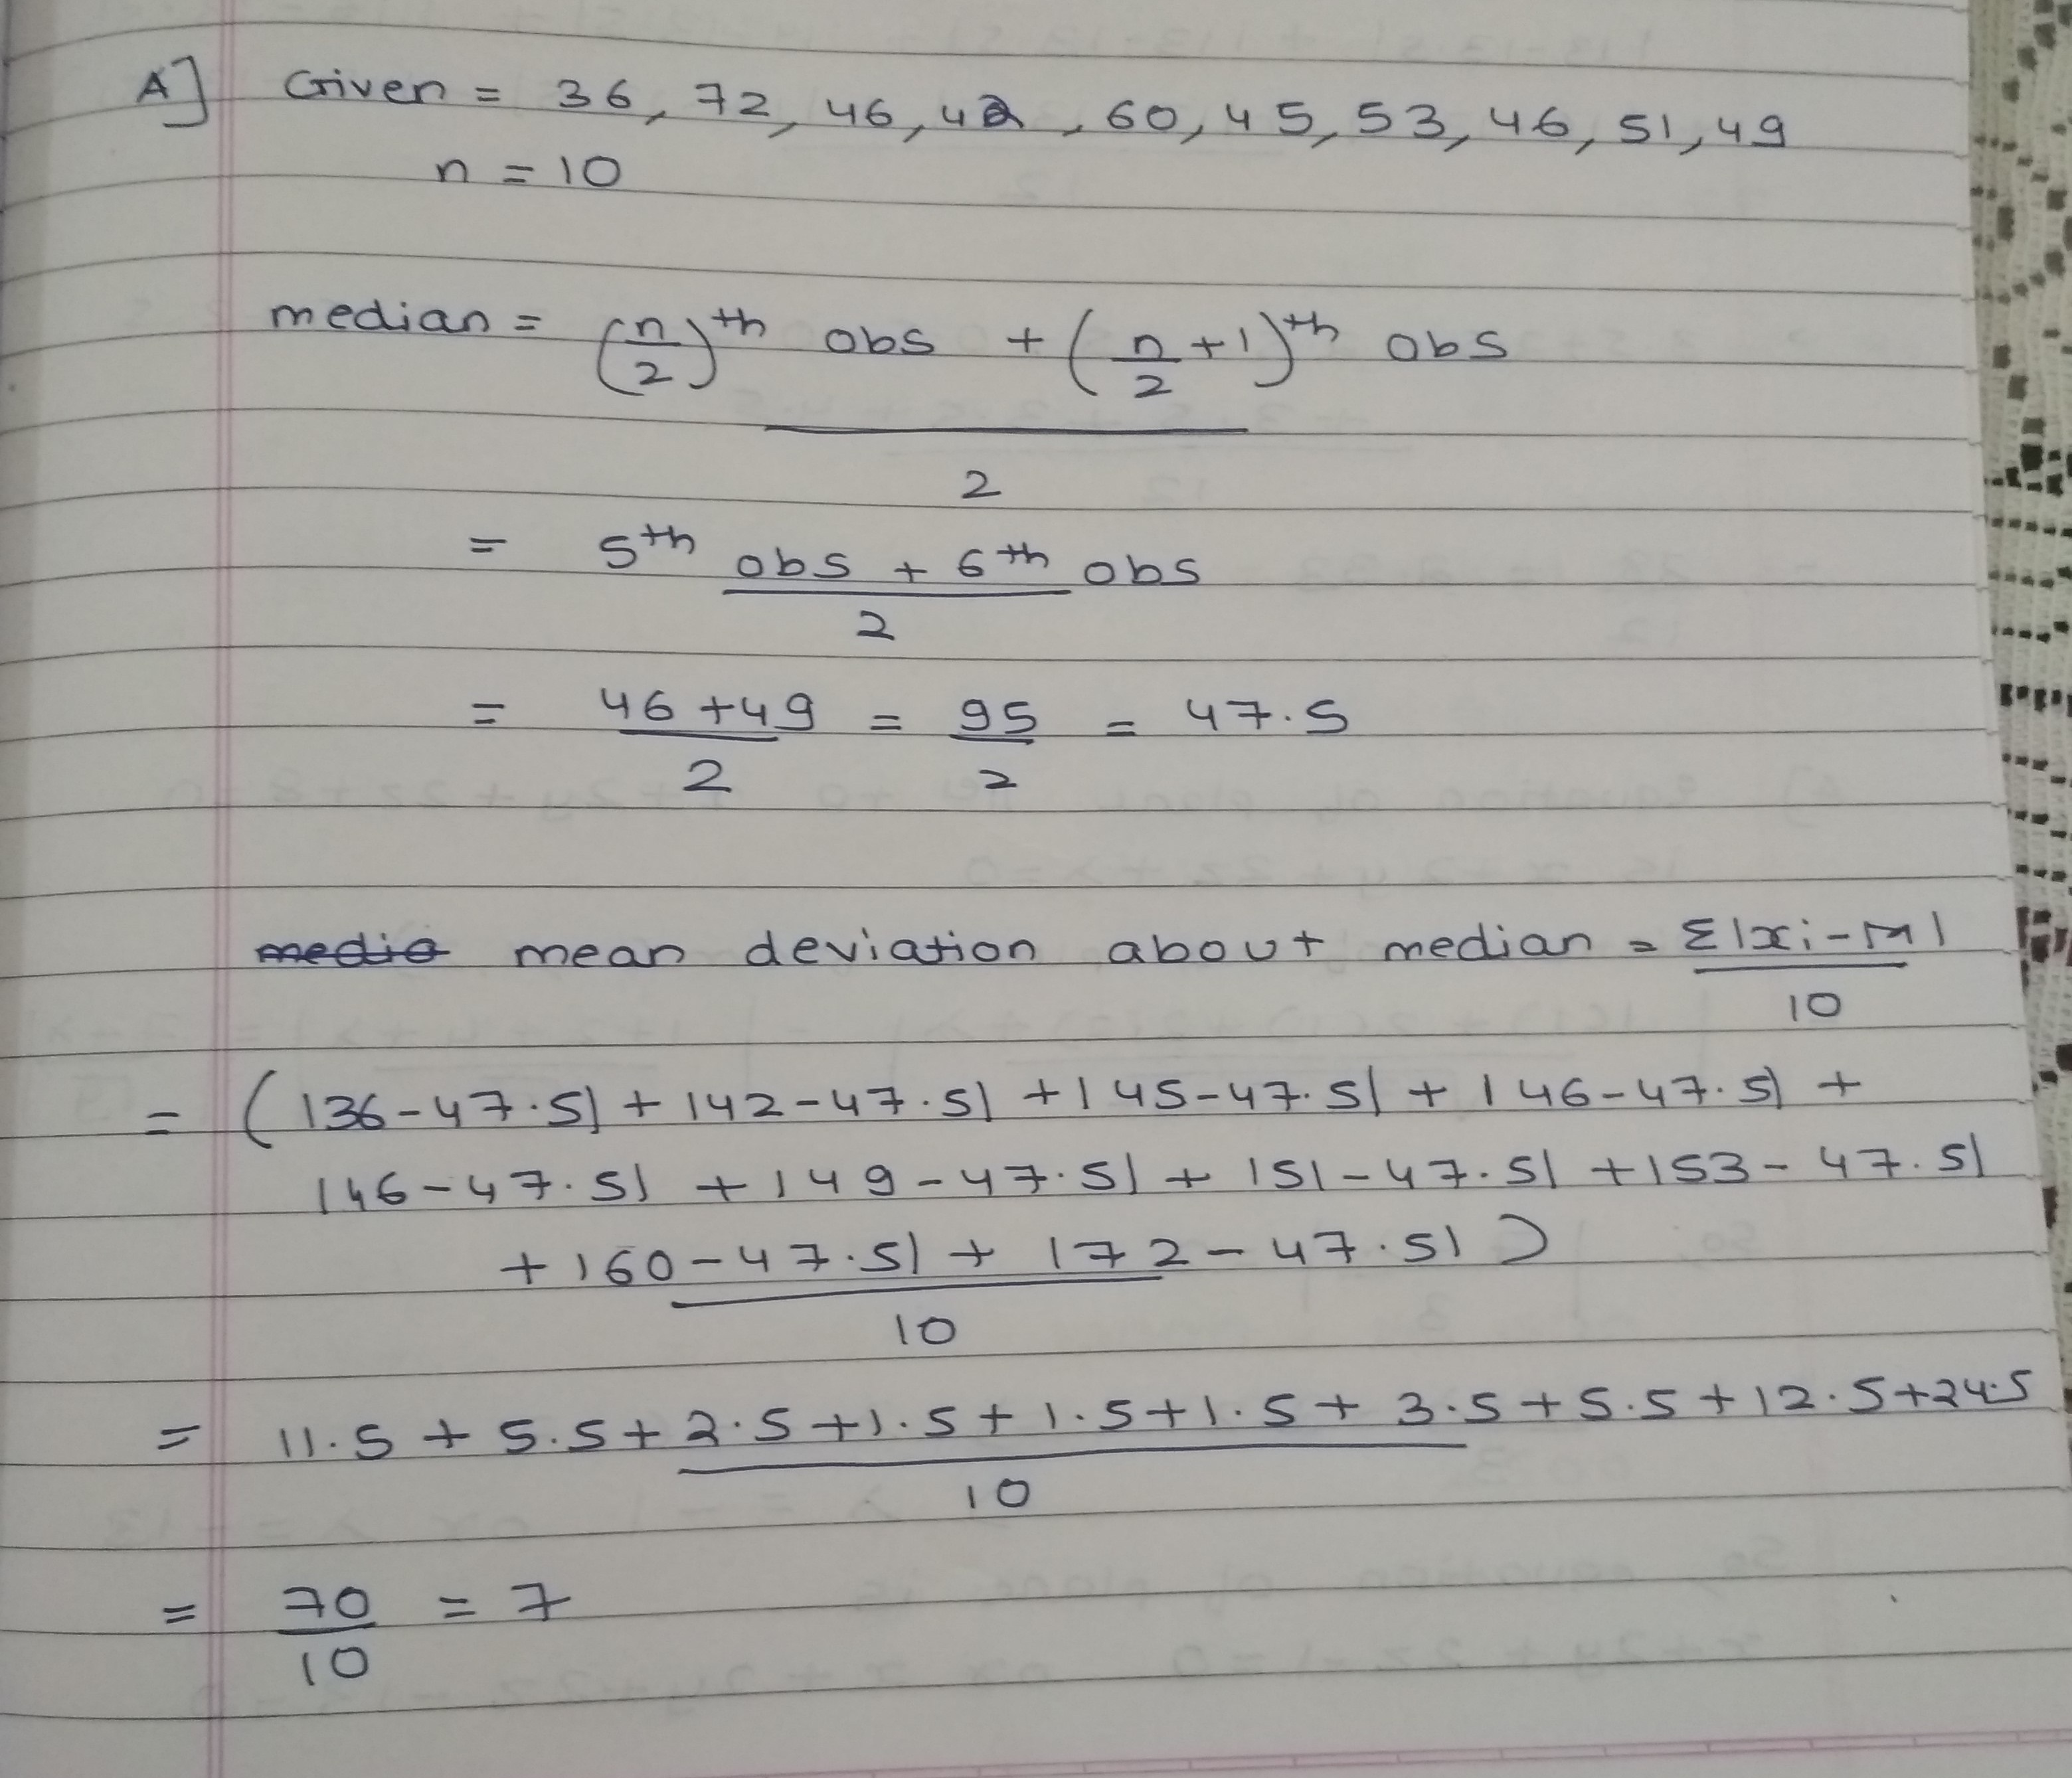
Find the mean deviation about the median for the data
$$36,72,46,42,60,45,53,46,51,49$$
A random variable X has the following probability distribution.
| X=x | -2 | -1 | 0 | 1 | 2 | 3 |
| P(X=x) | 0.1 | k | 0.2 | 2k | 0.3 | k |
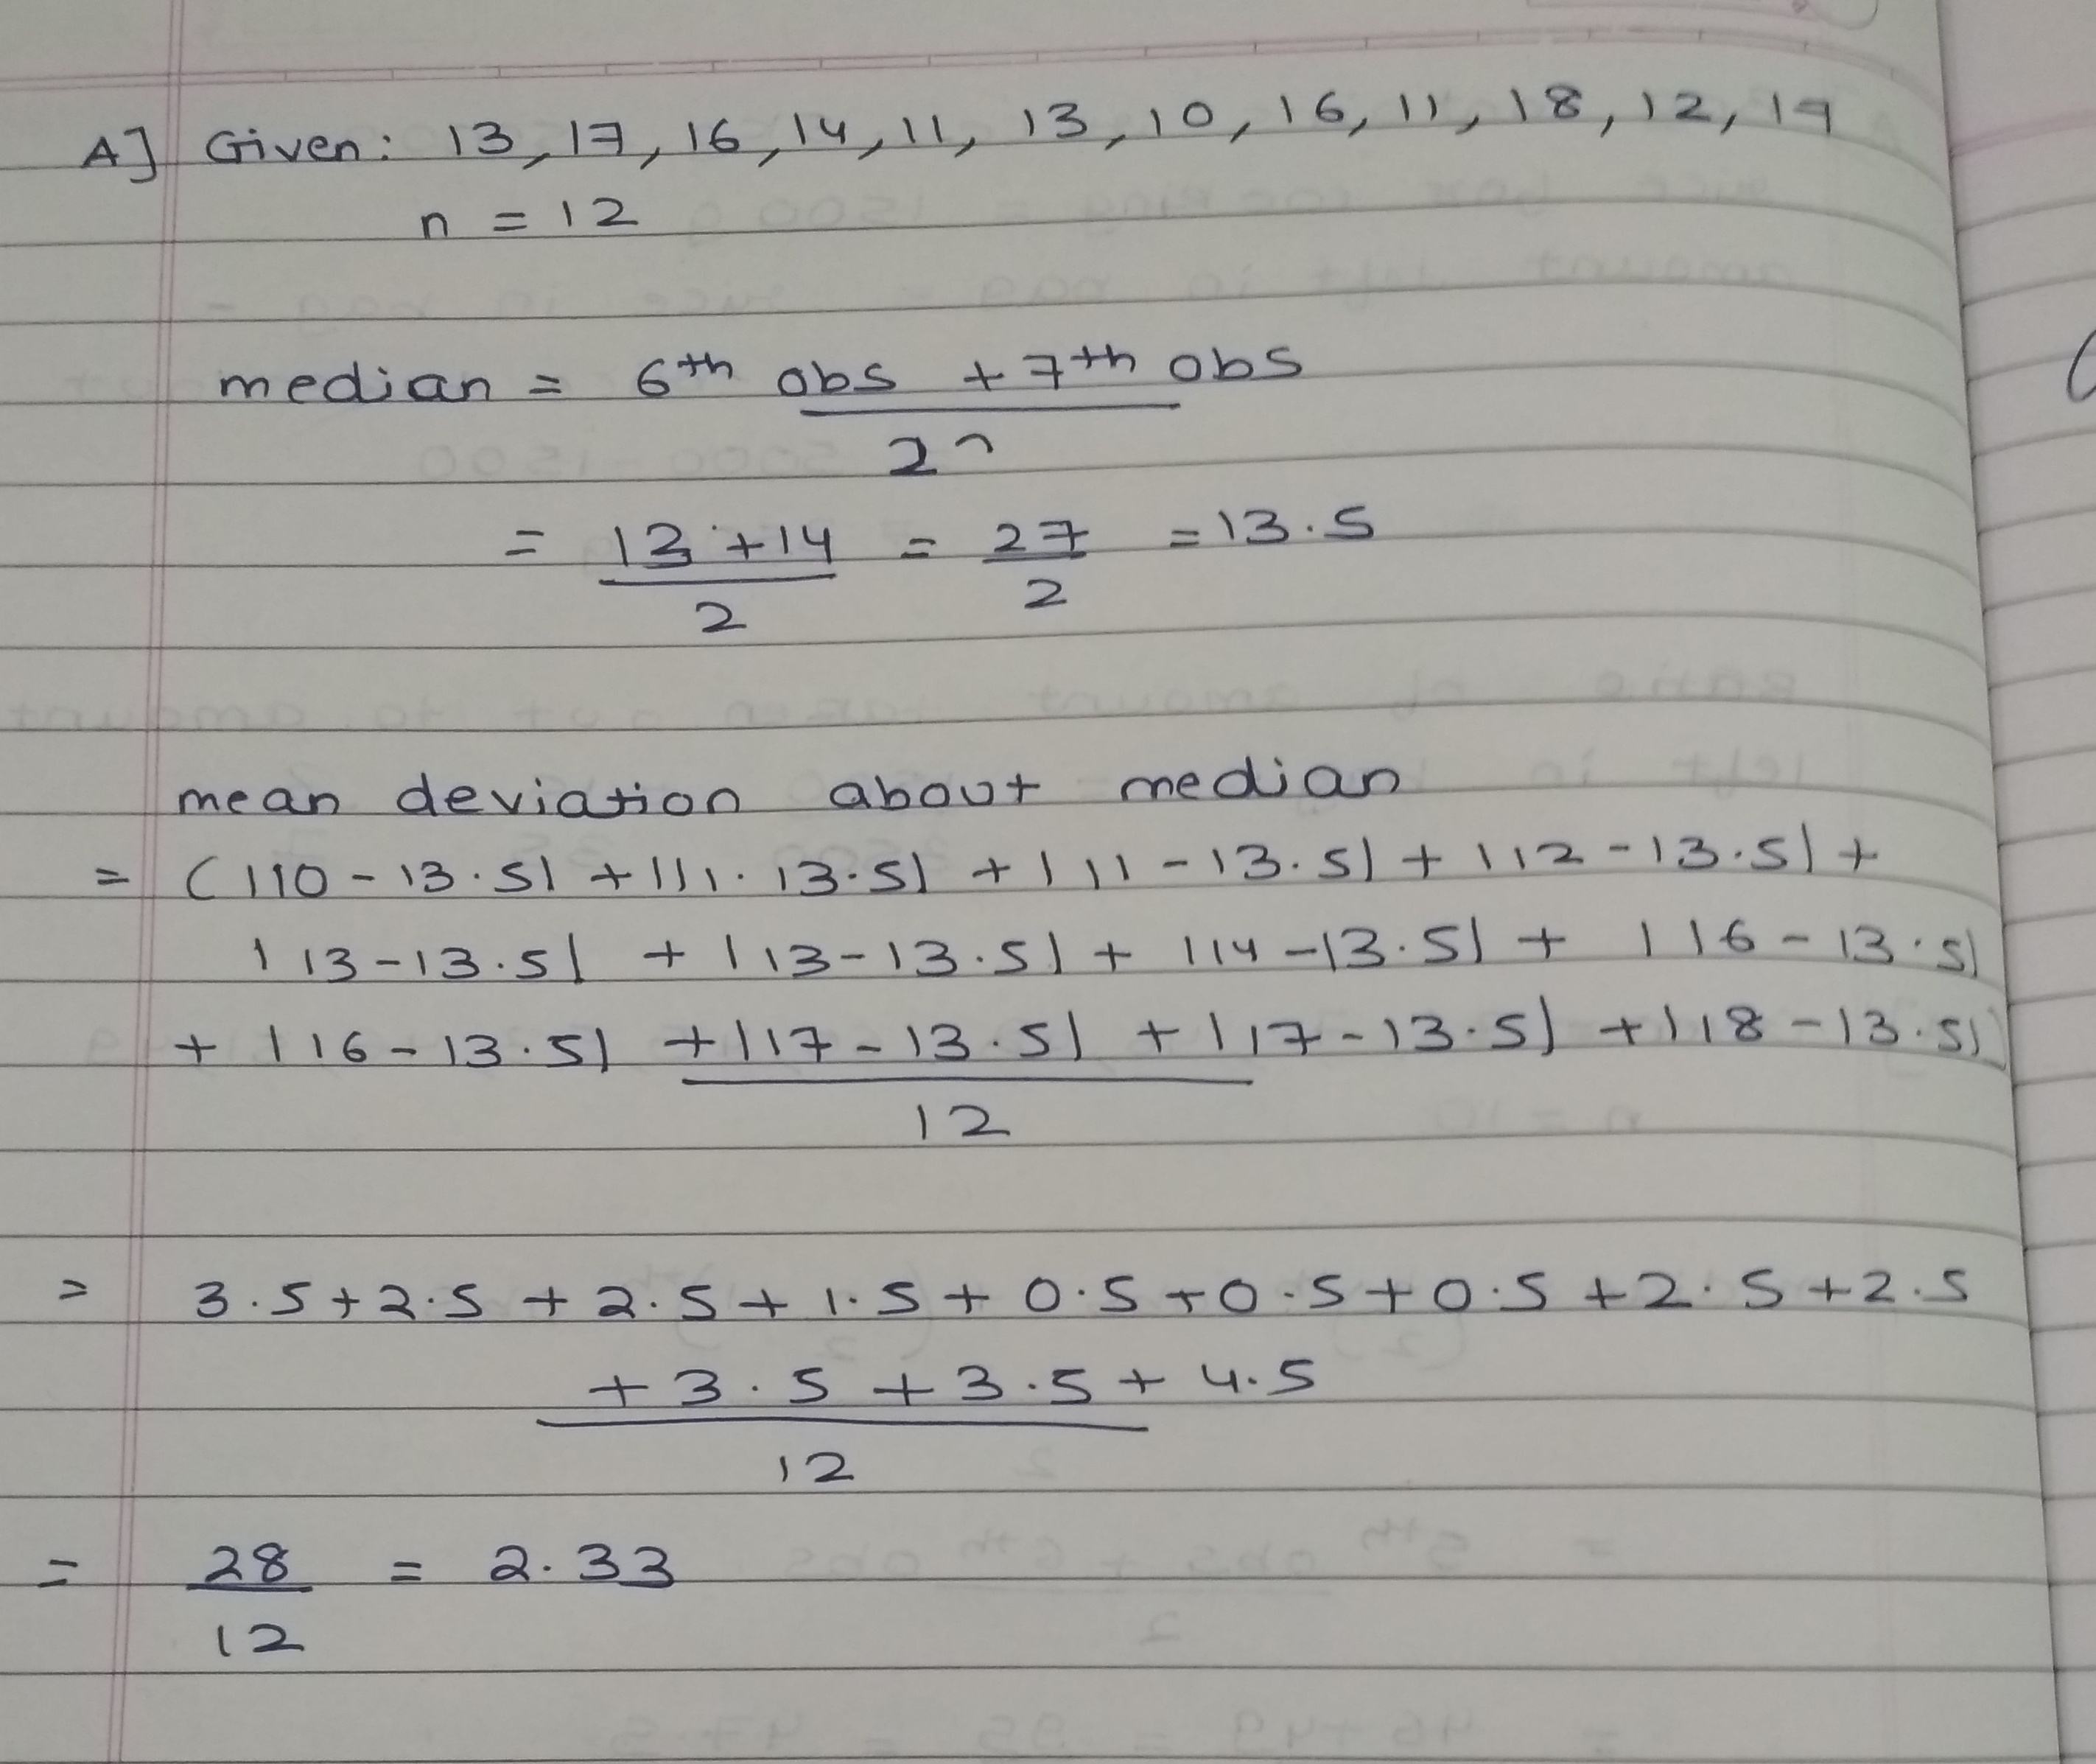
Find the mean deviation about the median for the data
$$13,17,16,14,11,13,10,16,11,18,12,17$$
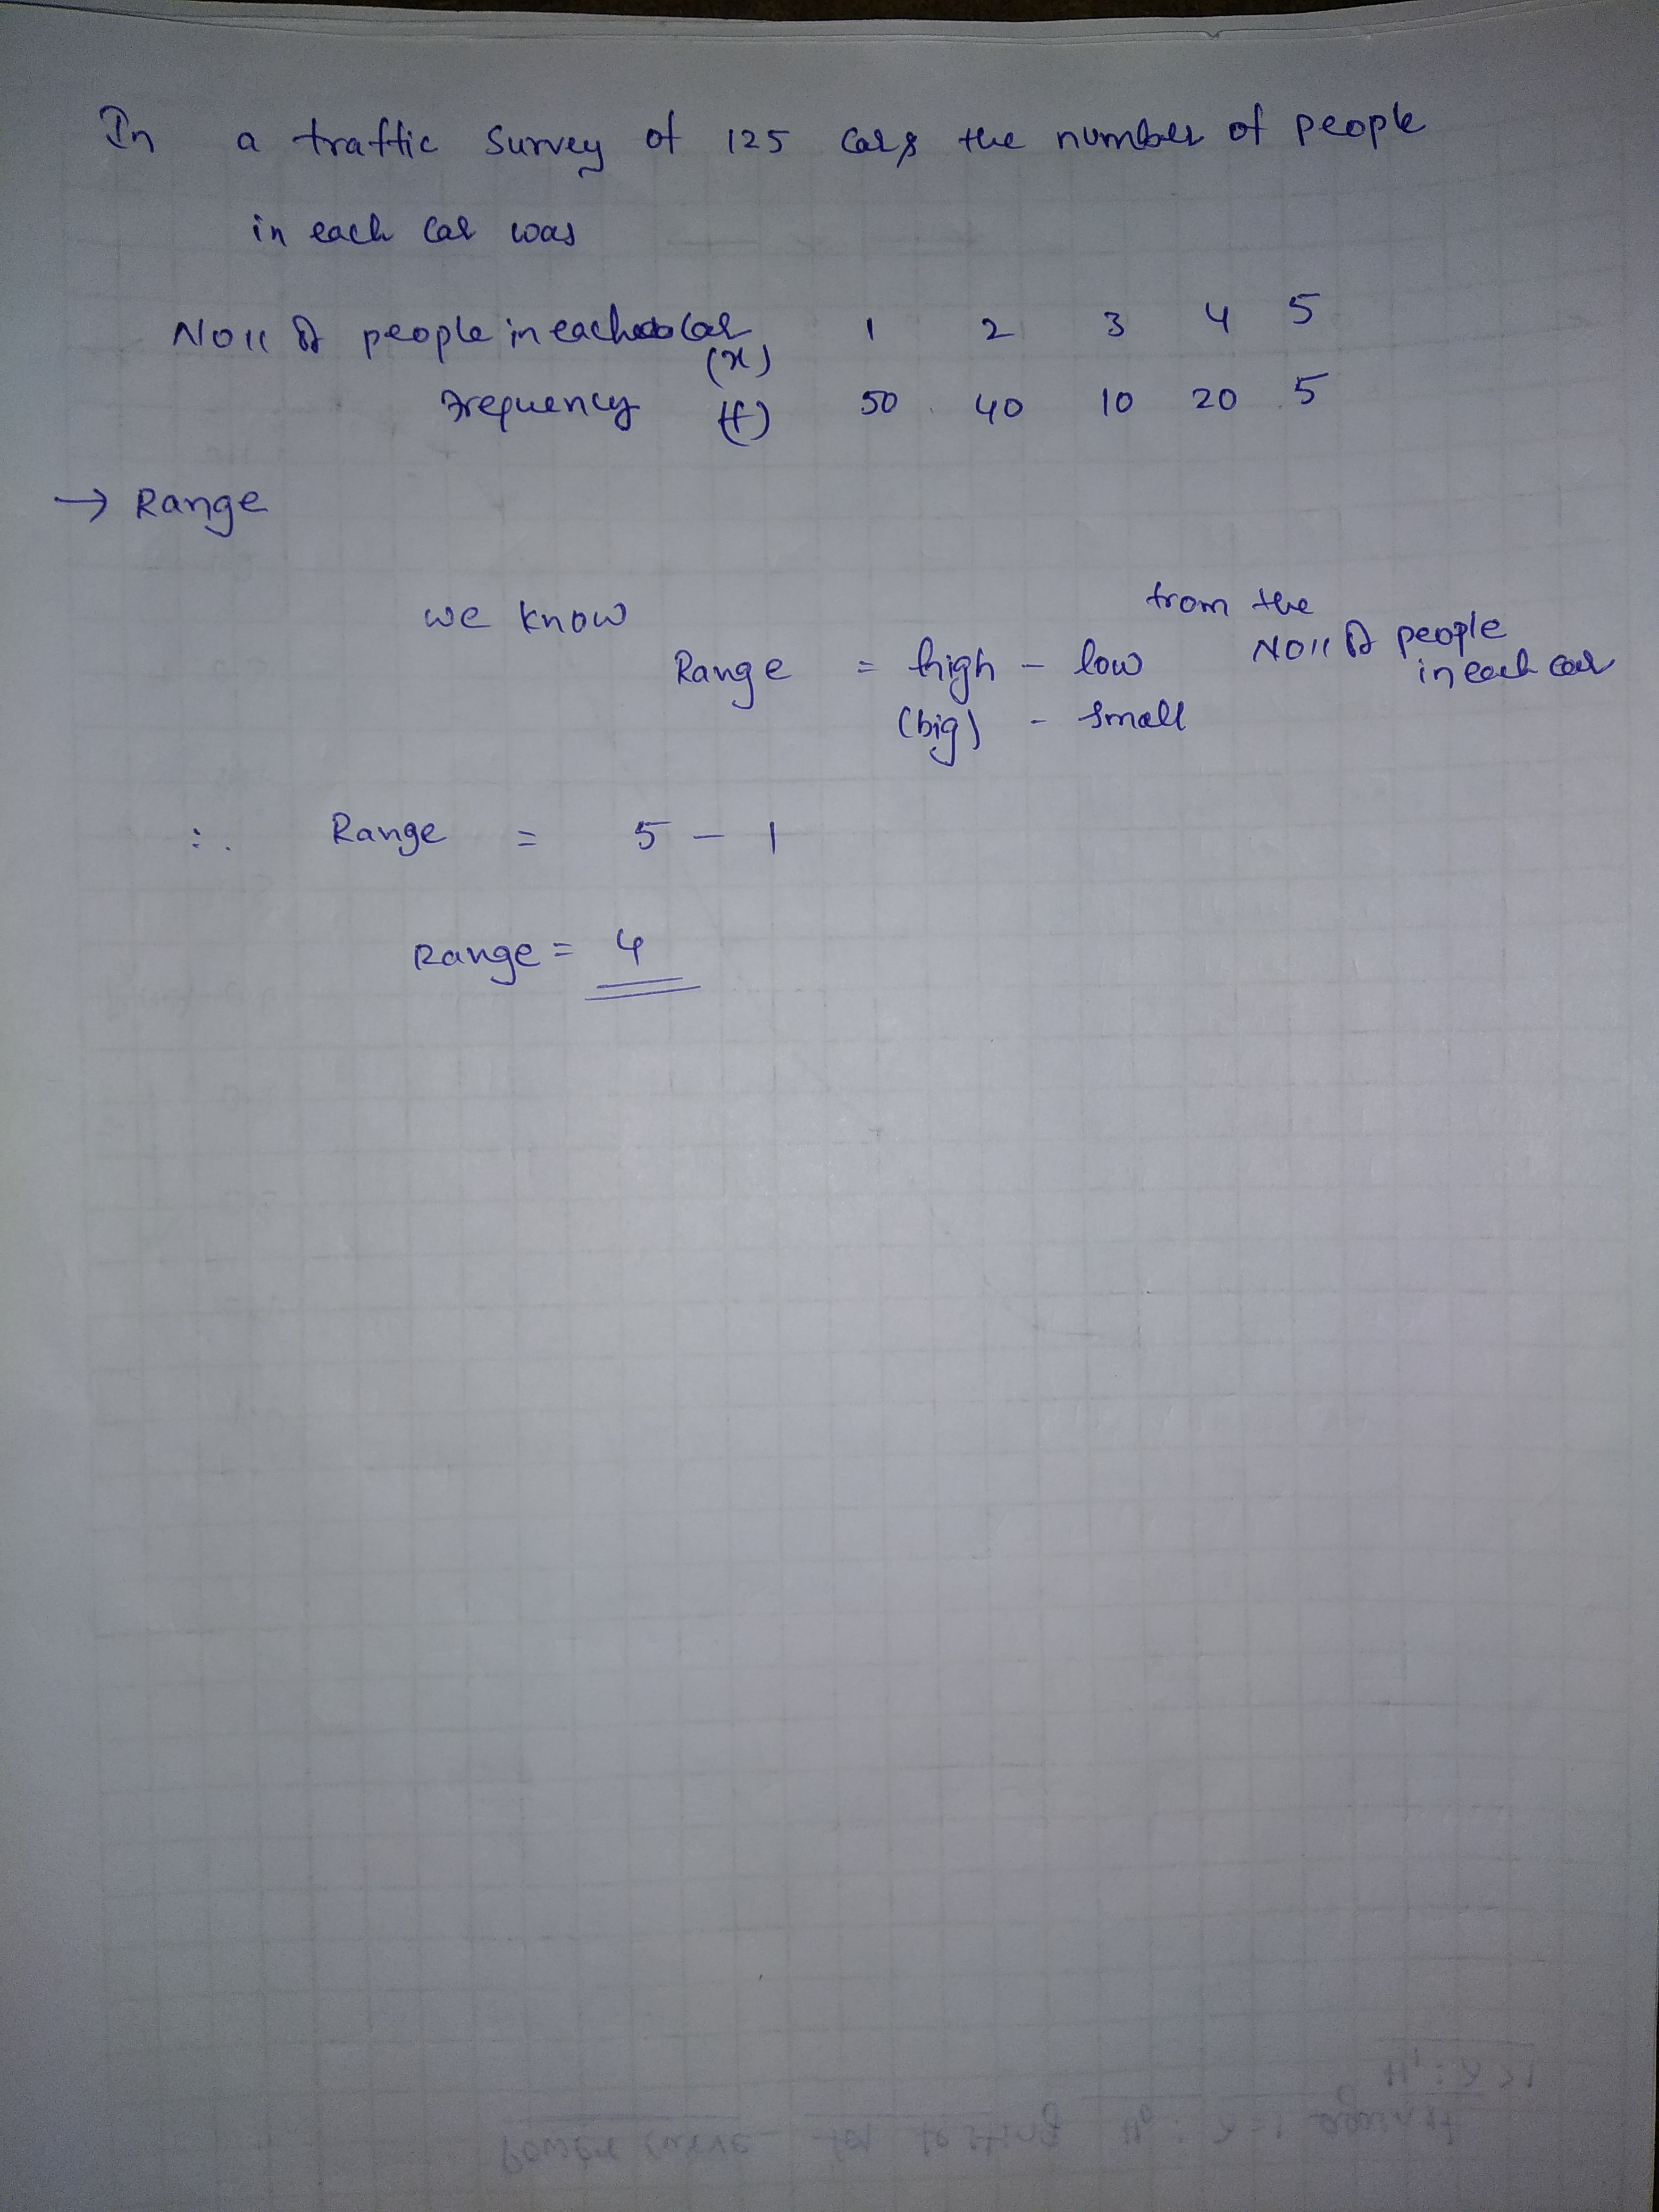
In a traffic survey of $$125$$ cars, the number of people in each car was recorded.
| Number of people in each car | $$1$$ | $$2$$ | $$3$$ | $$4$$ | $$5$$ |
| Frequency | $$50$$ | $$40$$ | $$10$$ | $$20$$ | $$5$$ |
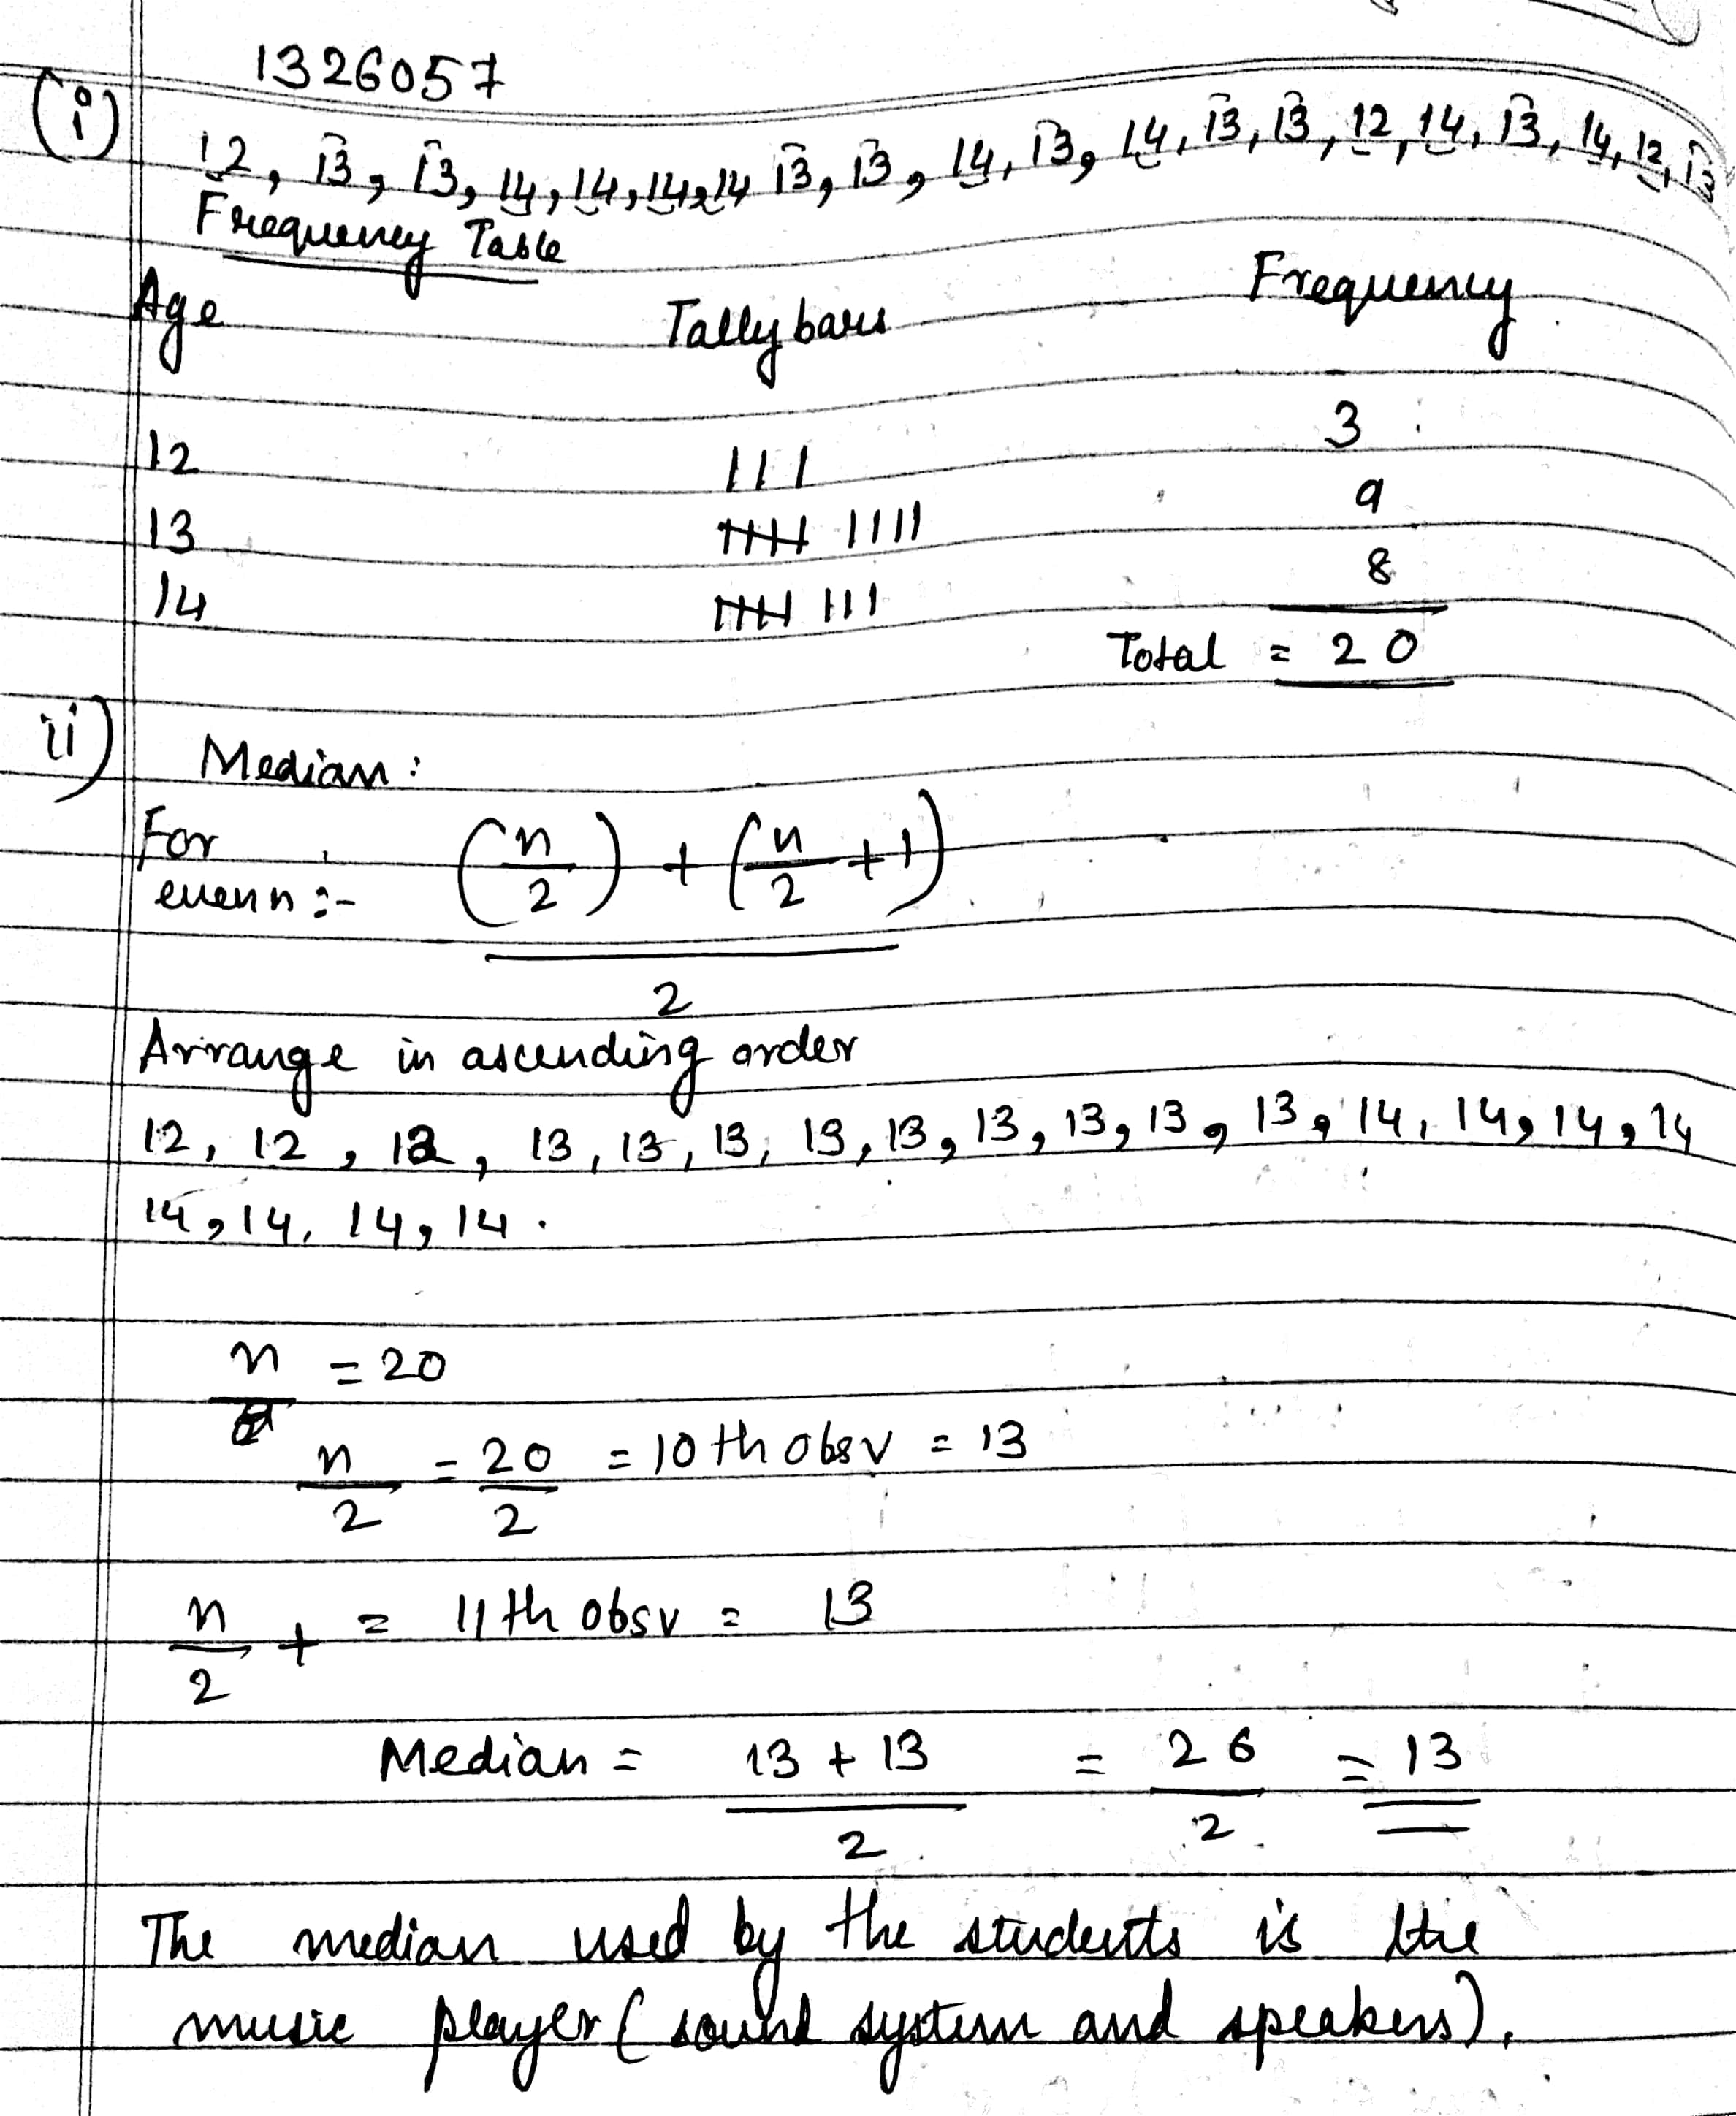
Make a frequency table each of the following sets of data.
(i) Ages of students in years in class VI B of a school:
12,13,13,14,14,14,14,13,13,14,13,14,13,13,12,14,13,14,12,13
(ii) The median used by students of class VI B of a school to listen to music:
If the mean is $$54$$ and mode $$52$$, find the median.
On the annual day of school age-wise participation of students is given in the following frequency distribution table. Find the median of the students
Find the median of variants $$5, 7, 8, 11, 13, 17$$ with frequencies $$3, 7, 7, 12, 13, 10$$ respectively.
Find the median of the following data:
$$3, 1, 5, 6, 3, 4, 5$$
Find the median of the following data:
$$3, 1, 5, 6, 3, 4, 5, 6$$
The mean and standard deviation of $$50$$ items were found to be $$75$$ and $$10$$ respectively. At the time of checking it was found that one item $$65$$ was incorrect. Calculate the mean and standard deviation, if the wrong item is omitted.
Write the first $$10$$ prime numbers and find their median.
Is the mode always at the center of data?
The median of $$43,75,15,86,30$$ is
Find the median of the observations:$$59, 75, 68, 70, 74, 75, 80$$.
Find the mean deviation about the mean for the data:$$4,7,8,9,10,12,13,17$$
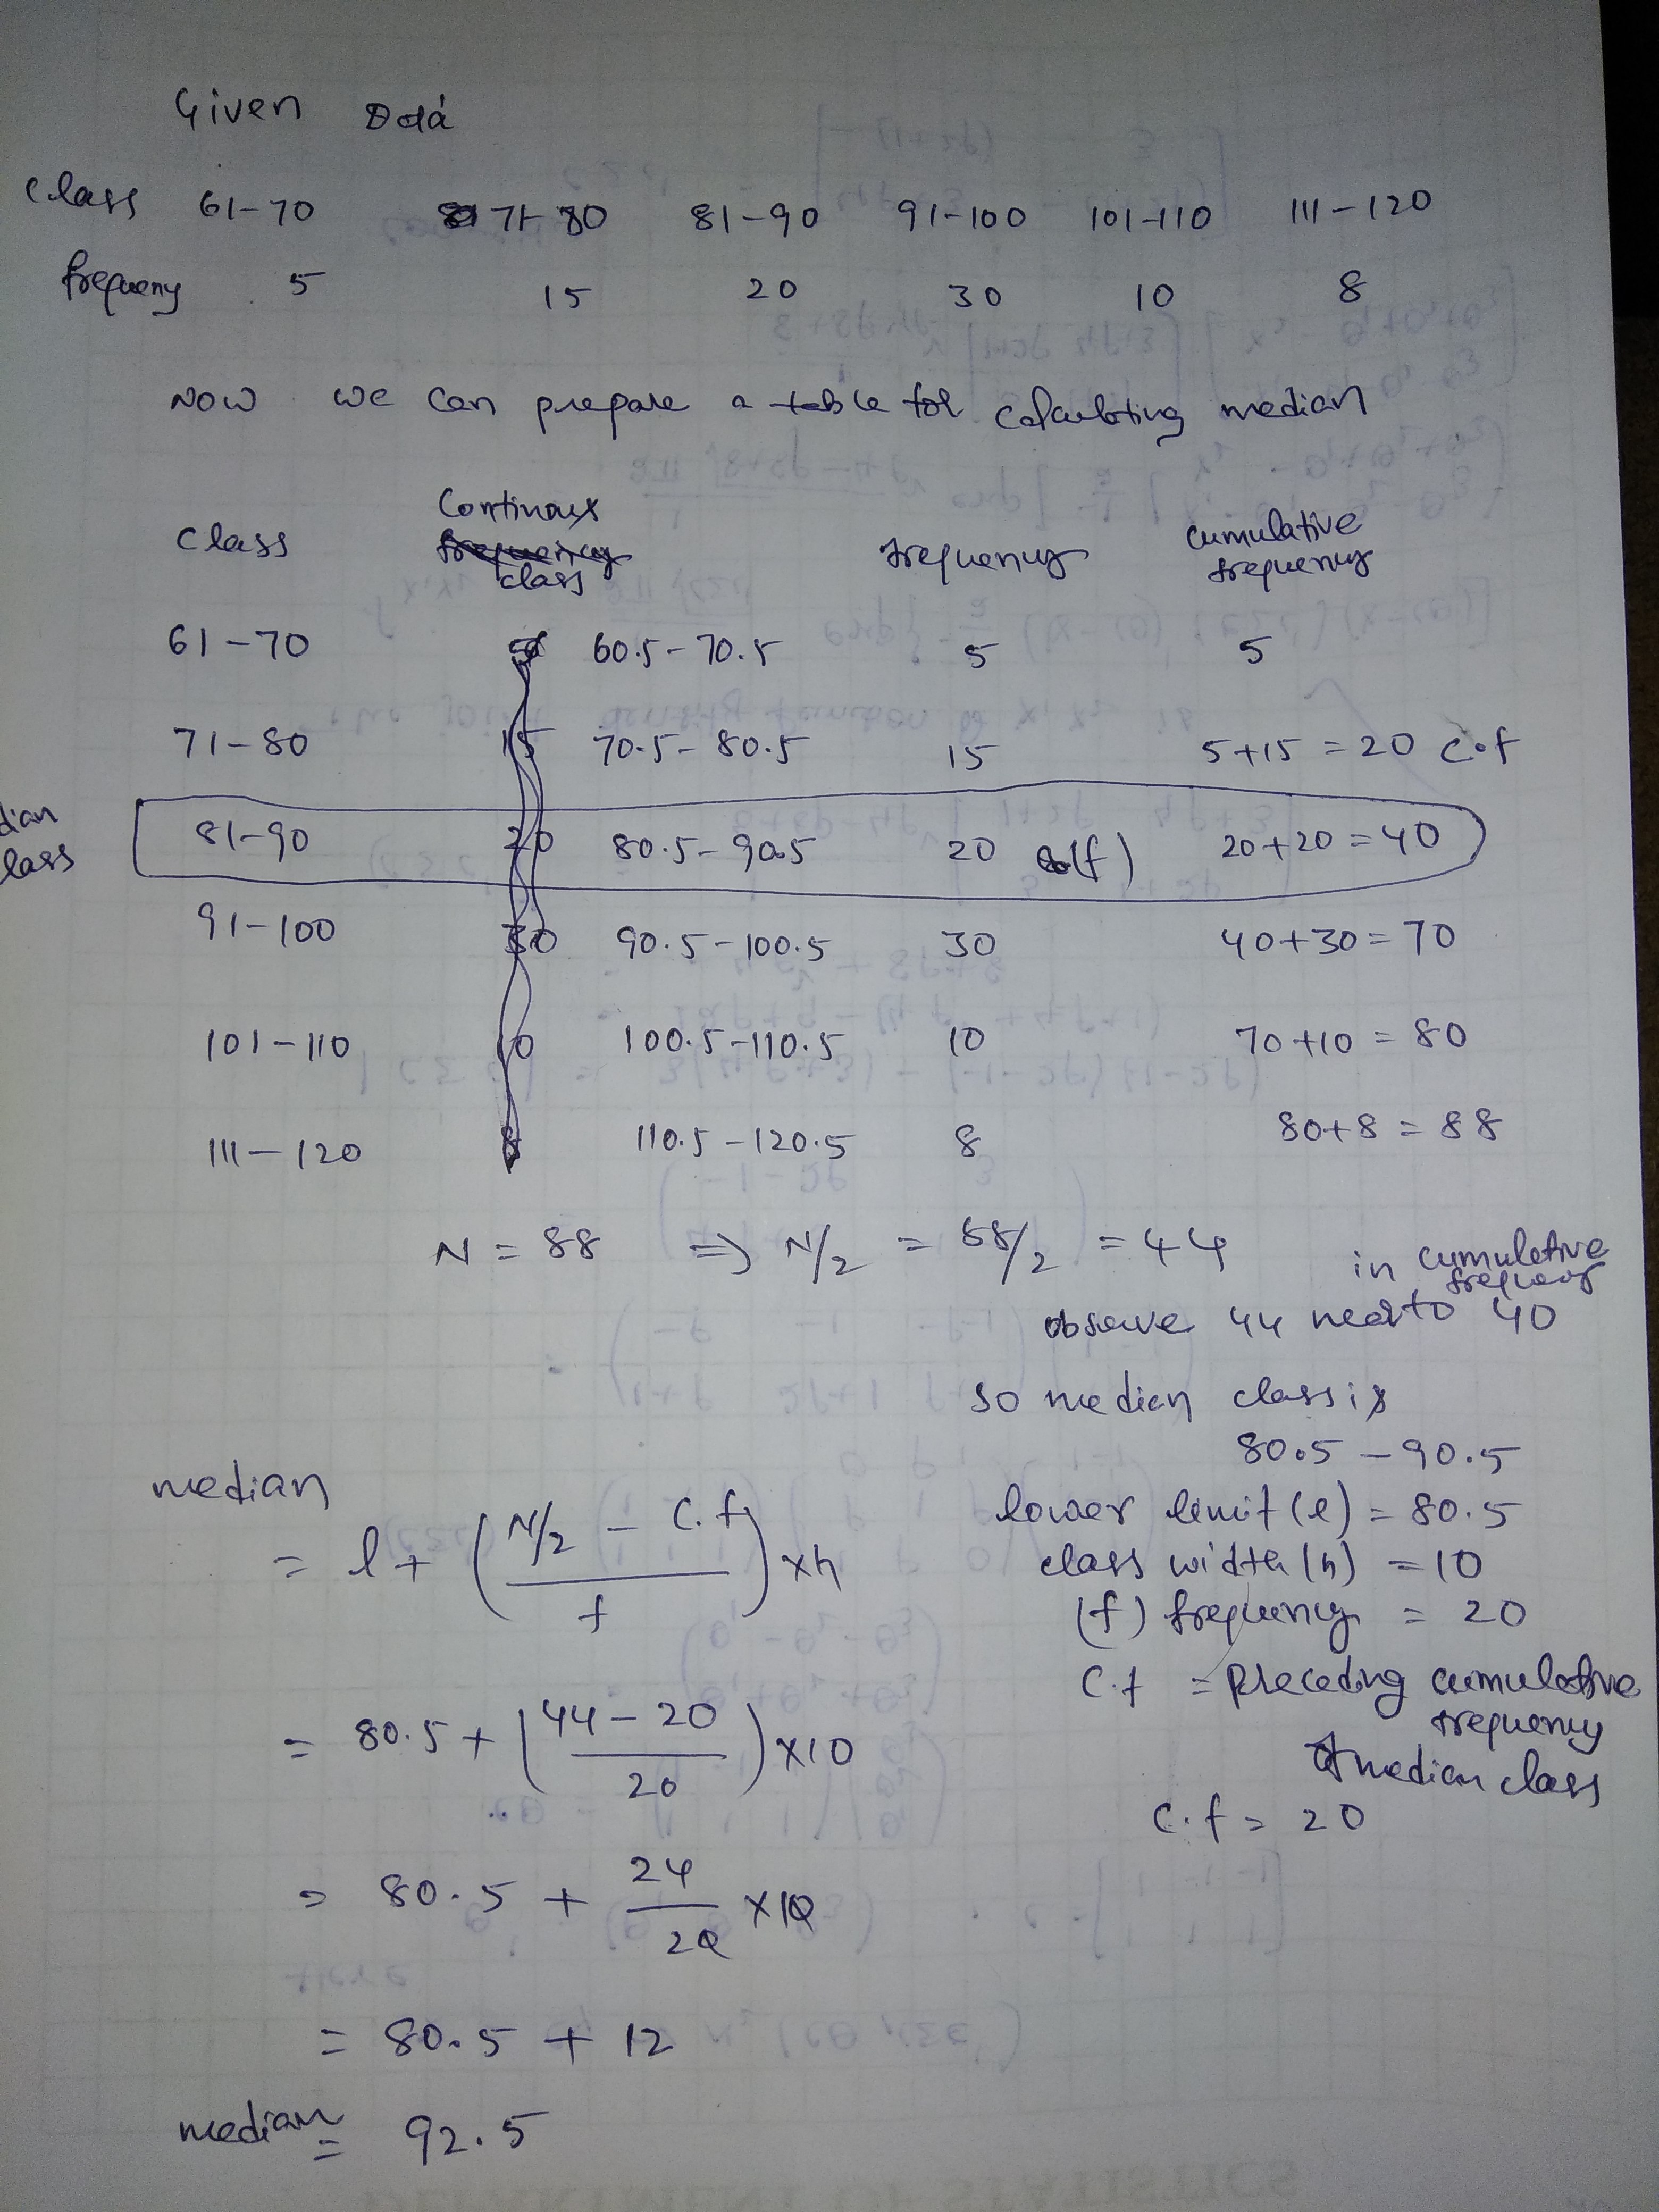
Find the median
| 61-70 | 5 |
| 81-80 | 15 |
| 81-90 | 20 |
| 91-100 | 30 |
| 101-110 | 10 |
| 111-120 | 8 |
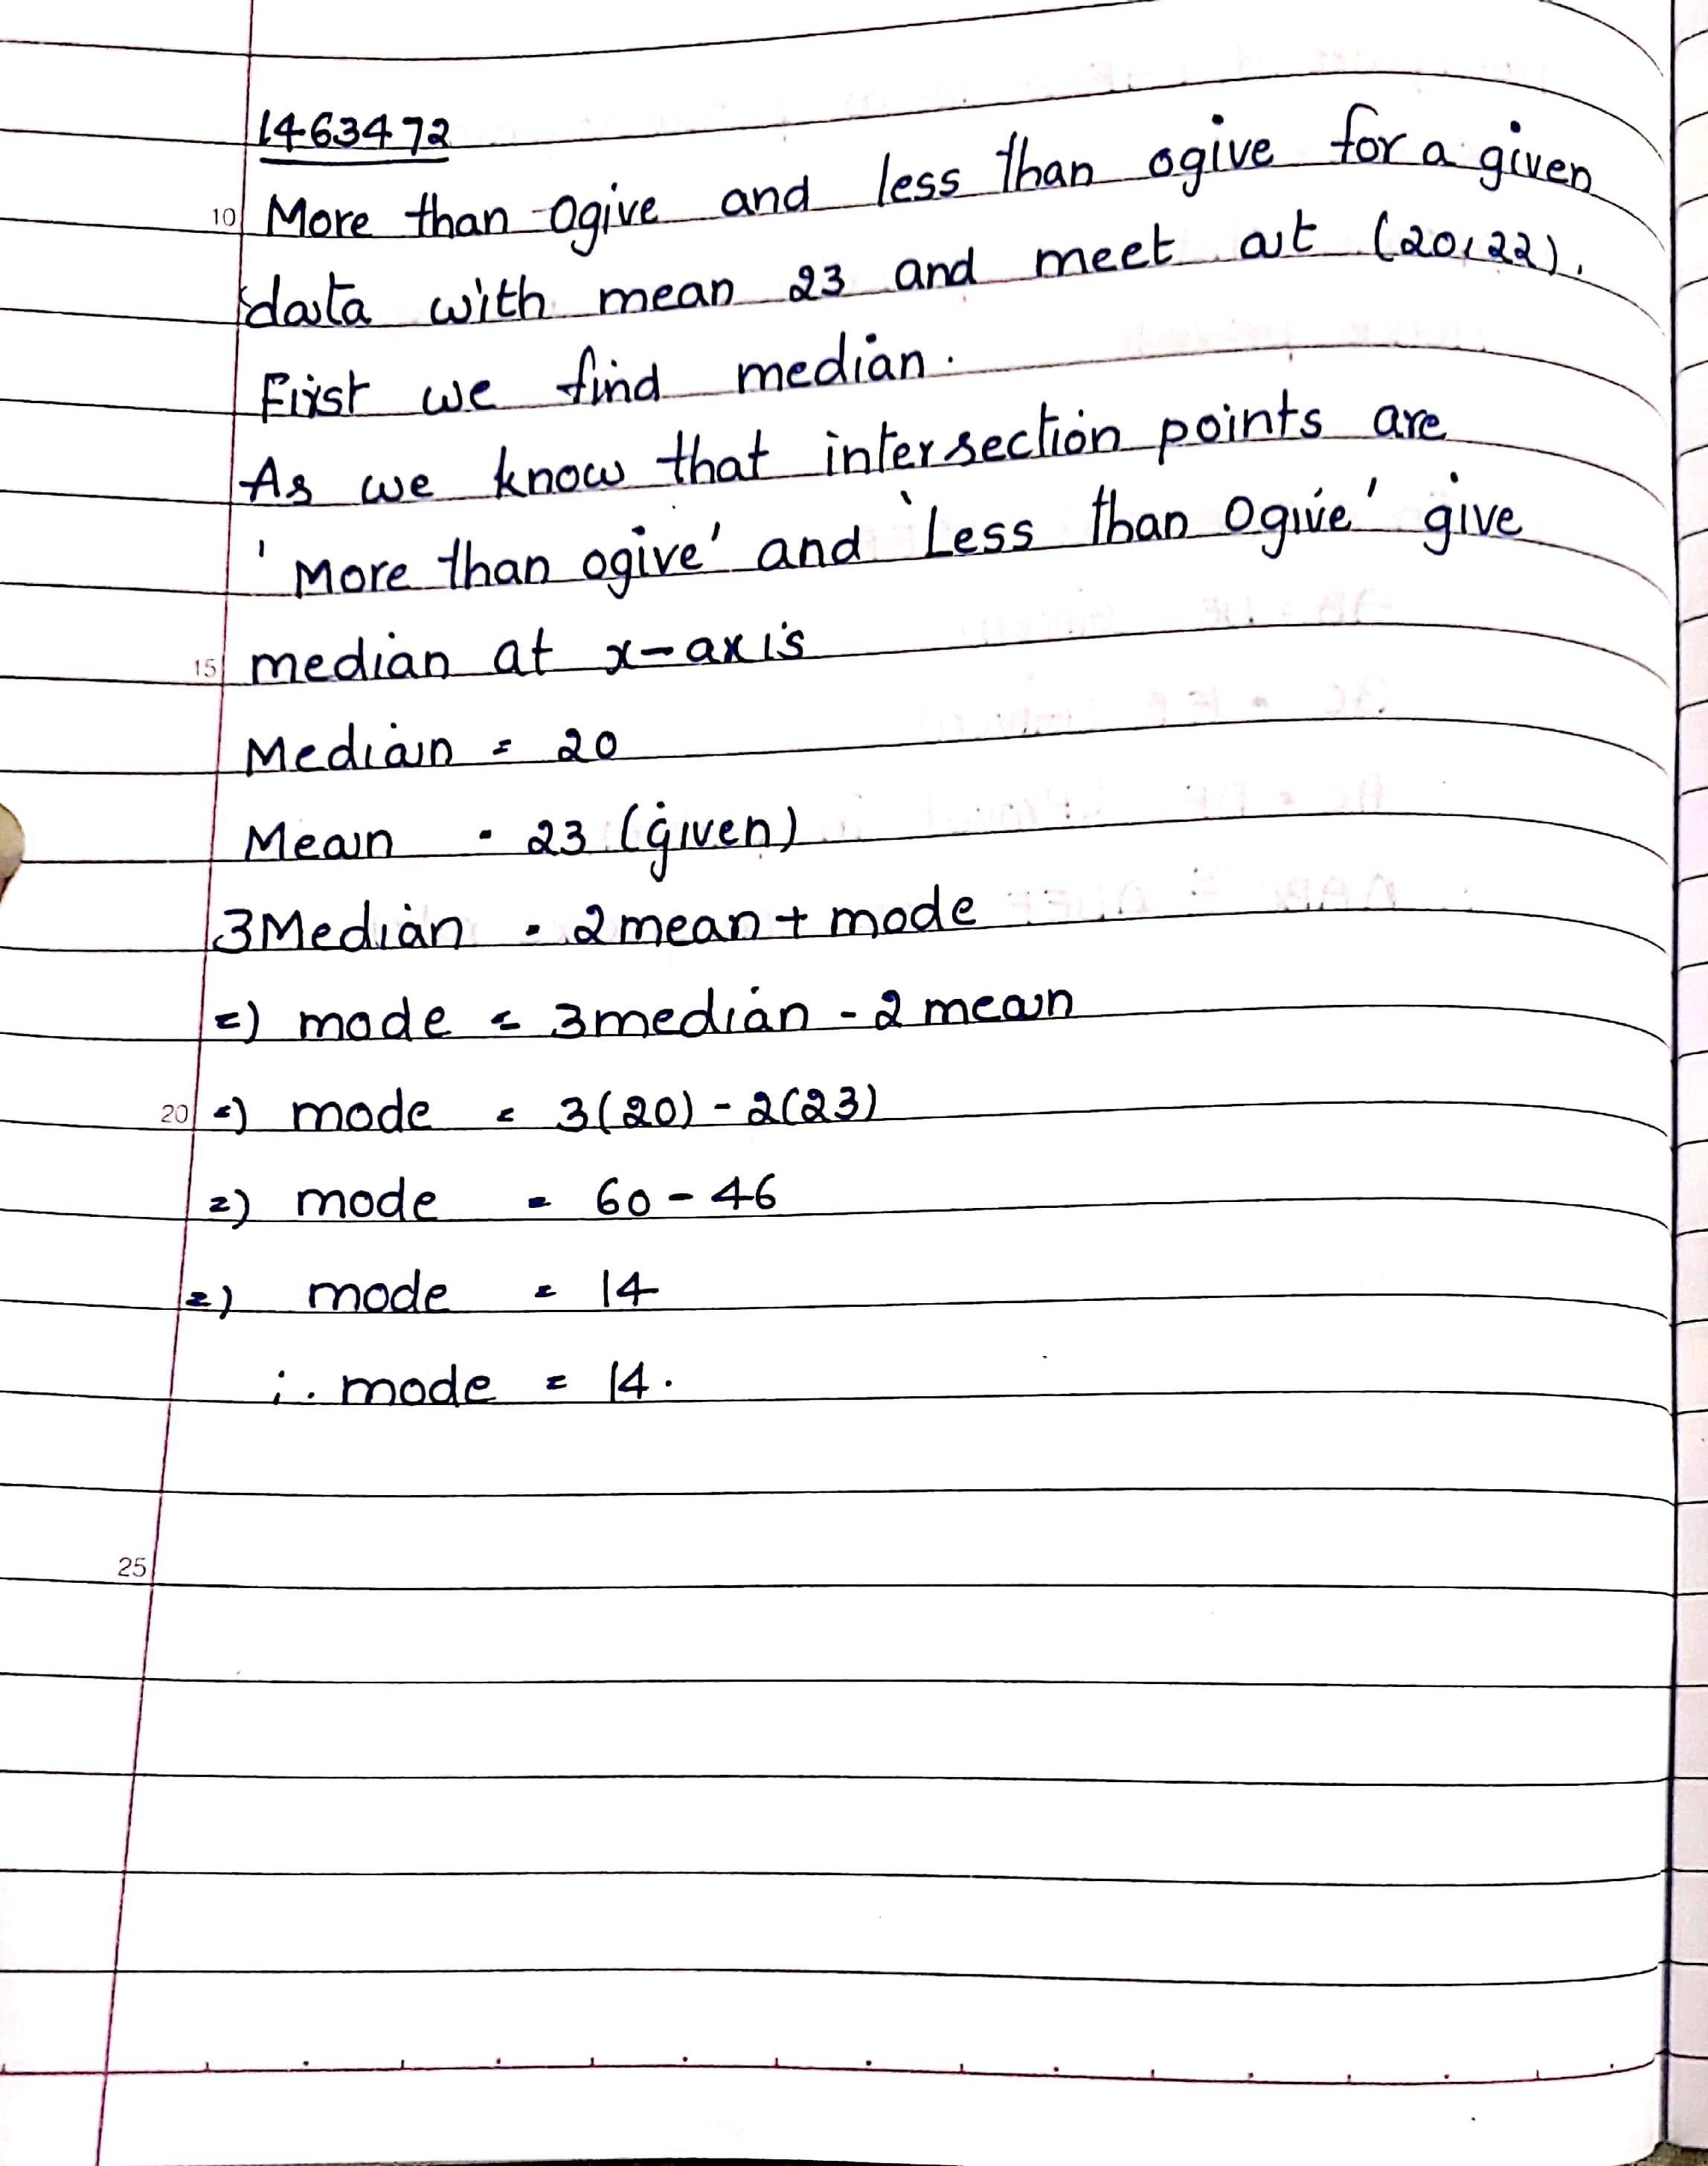
More than ogive and less than ogive for a given data with mean $$23$$ meet at $$(20,22)$$. find its mode.
The marks obtained by $$11$$ students of a class in a test are given below:-
$$23,2,15,38,21,19,23,23,26,34,23$$
Find the mode of the above data.
Find the mode for the following data:
$$7.5, 7.3, 7.2, 7.2, 7.4, 7.7, 7.7, 7.5, 7.3, 7.2, 7.6, 7.2$$
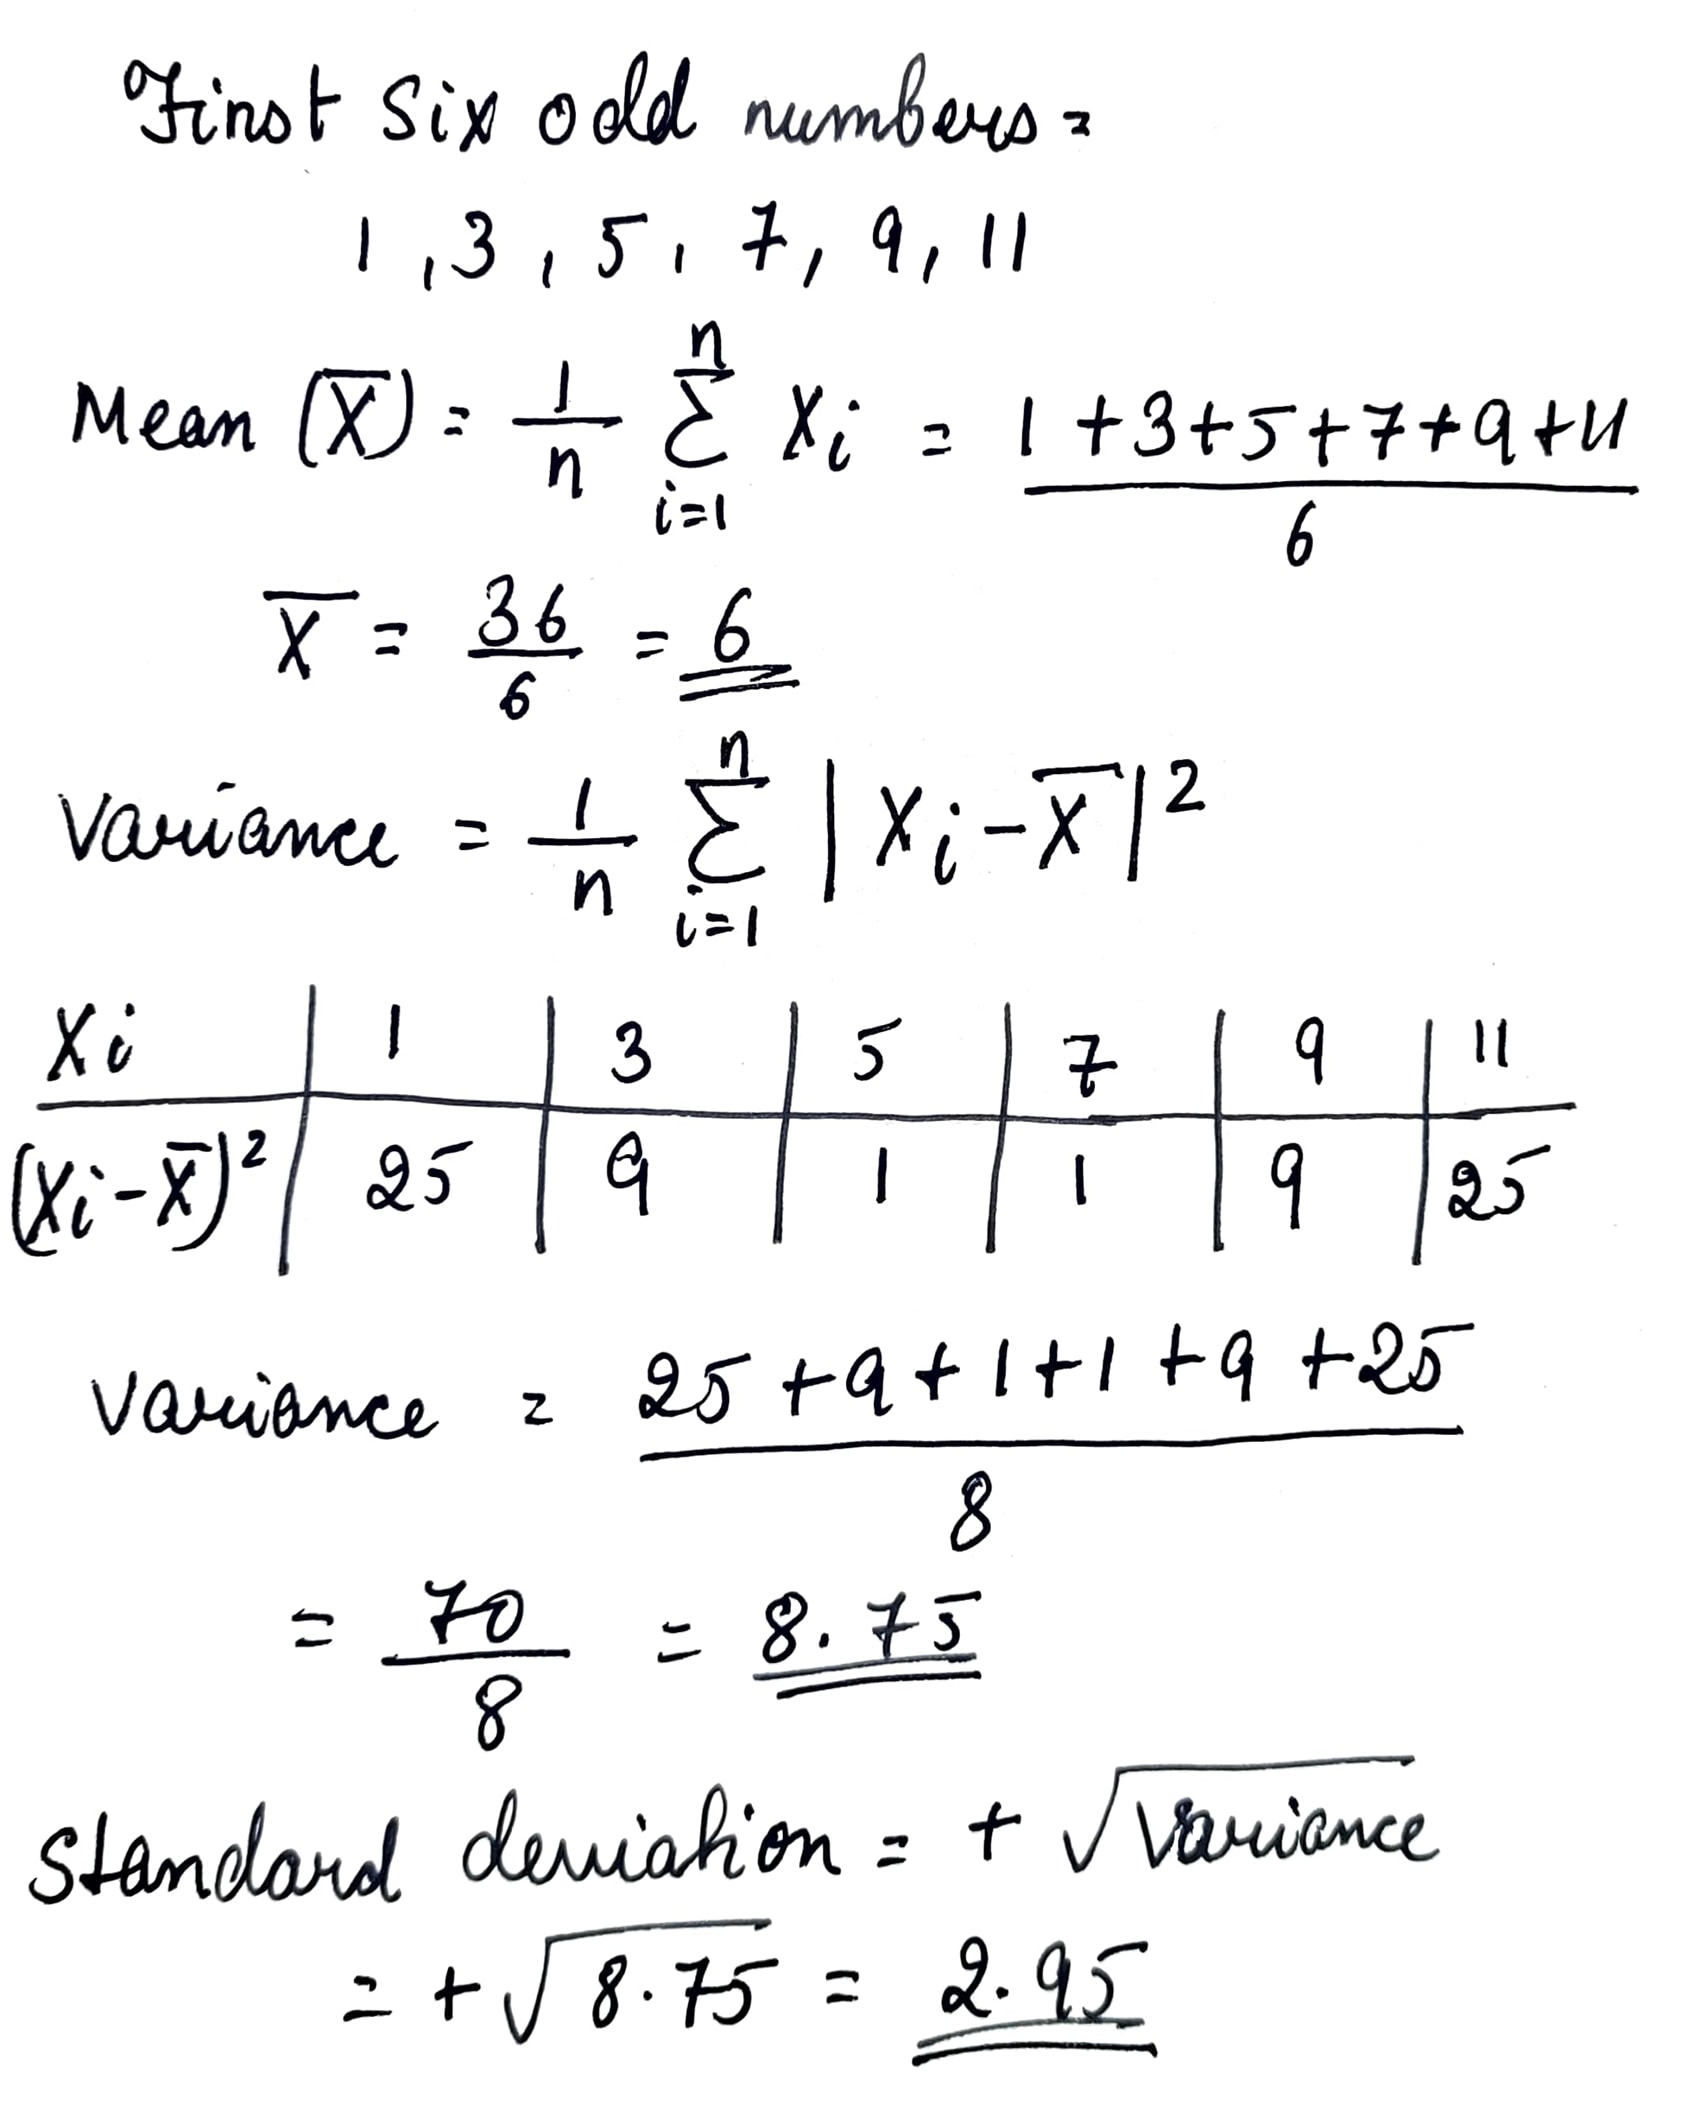
Find the mean, variance and standard deviation for first six odd natural numbers.
Find the median of:
$$3, 11, 7, 2, 5, 9, 9, 2, 10$$
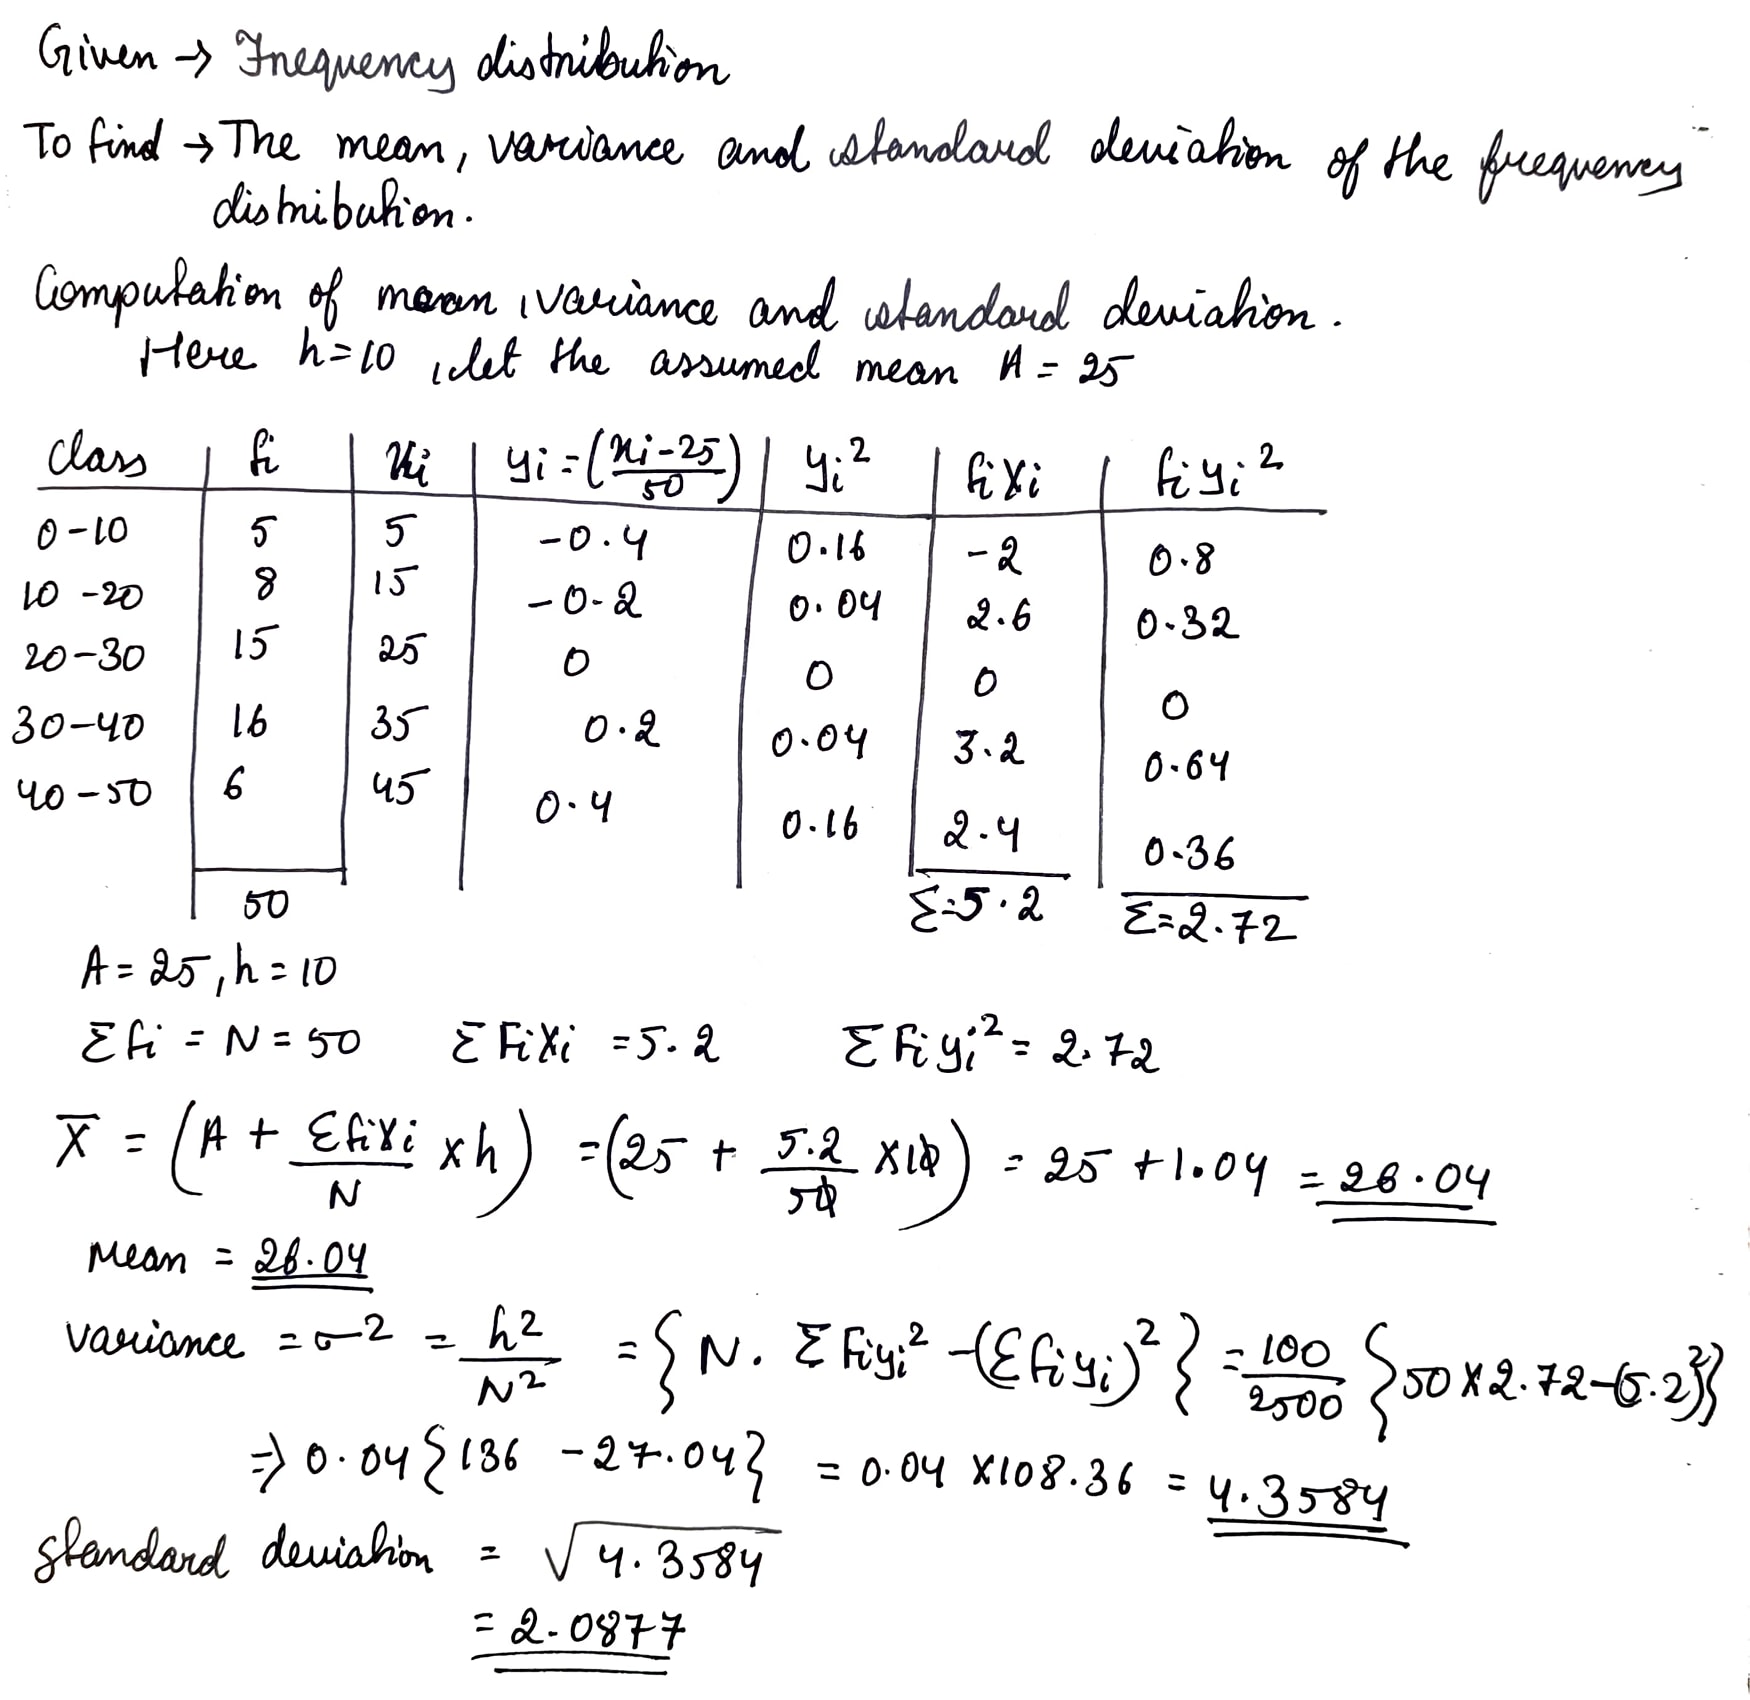
Using short ad method.find the mean, variance and standard deviation for the data: Class 30-40 40-50 50-60 60-70 70-80 80-90 90-100 Frequency 3 7 12 15 8 3 2
| Class | 30-40 | 40-50 | 50-60 | 60-70 | 70-80 | 80-90 | 90-100 |
| Frequency | 3 | 7 | 12 | 15 | 8 | 3 | 2 |
Find the median of:
$$21, 15, 6, 25, 18, 13, 20, 9, 16, 8, 22$$
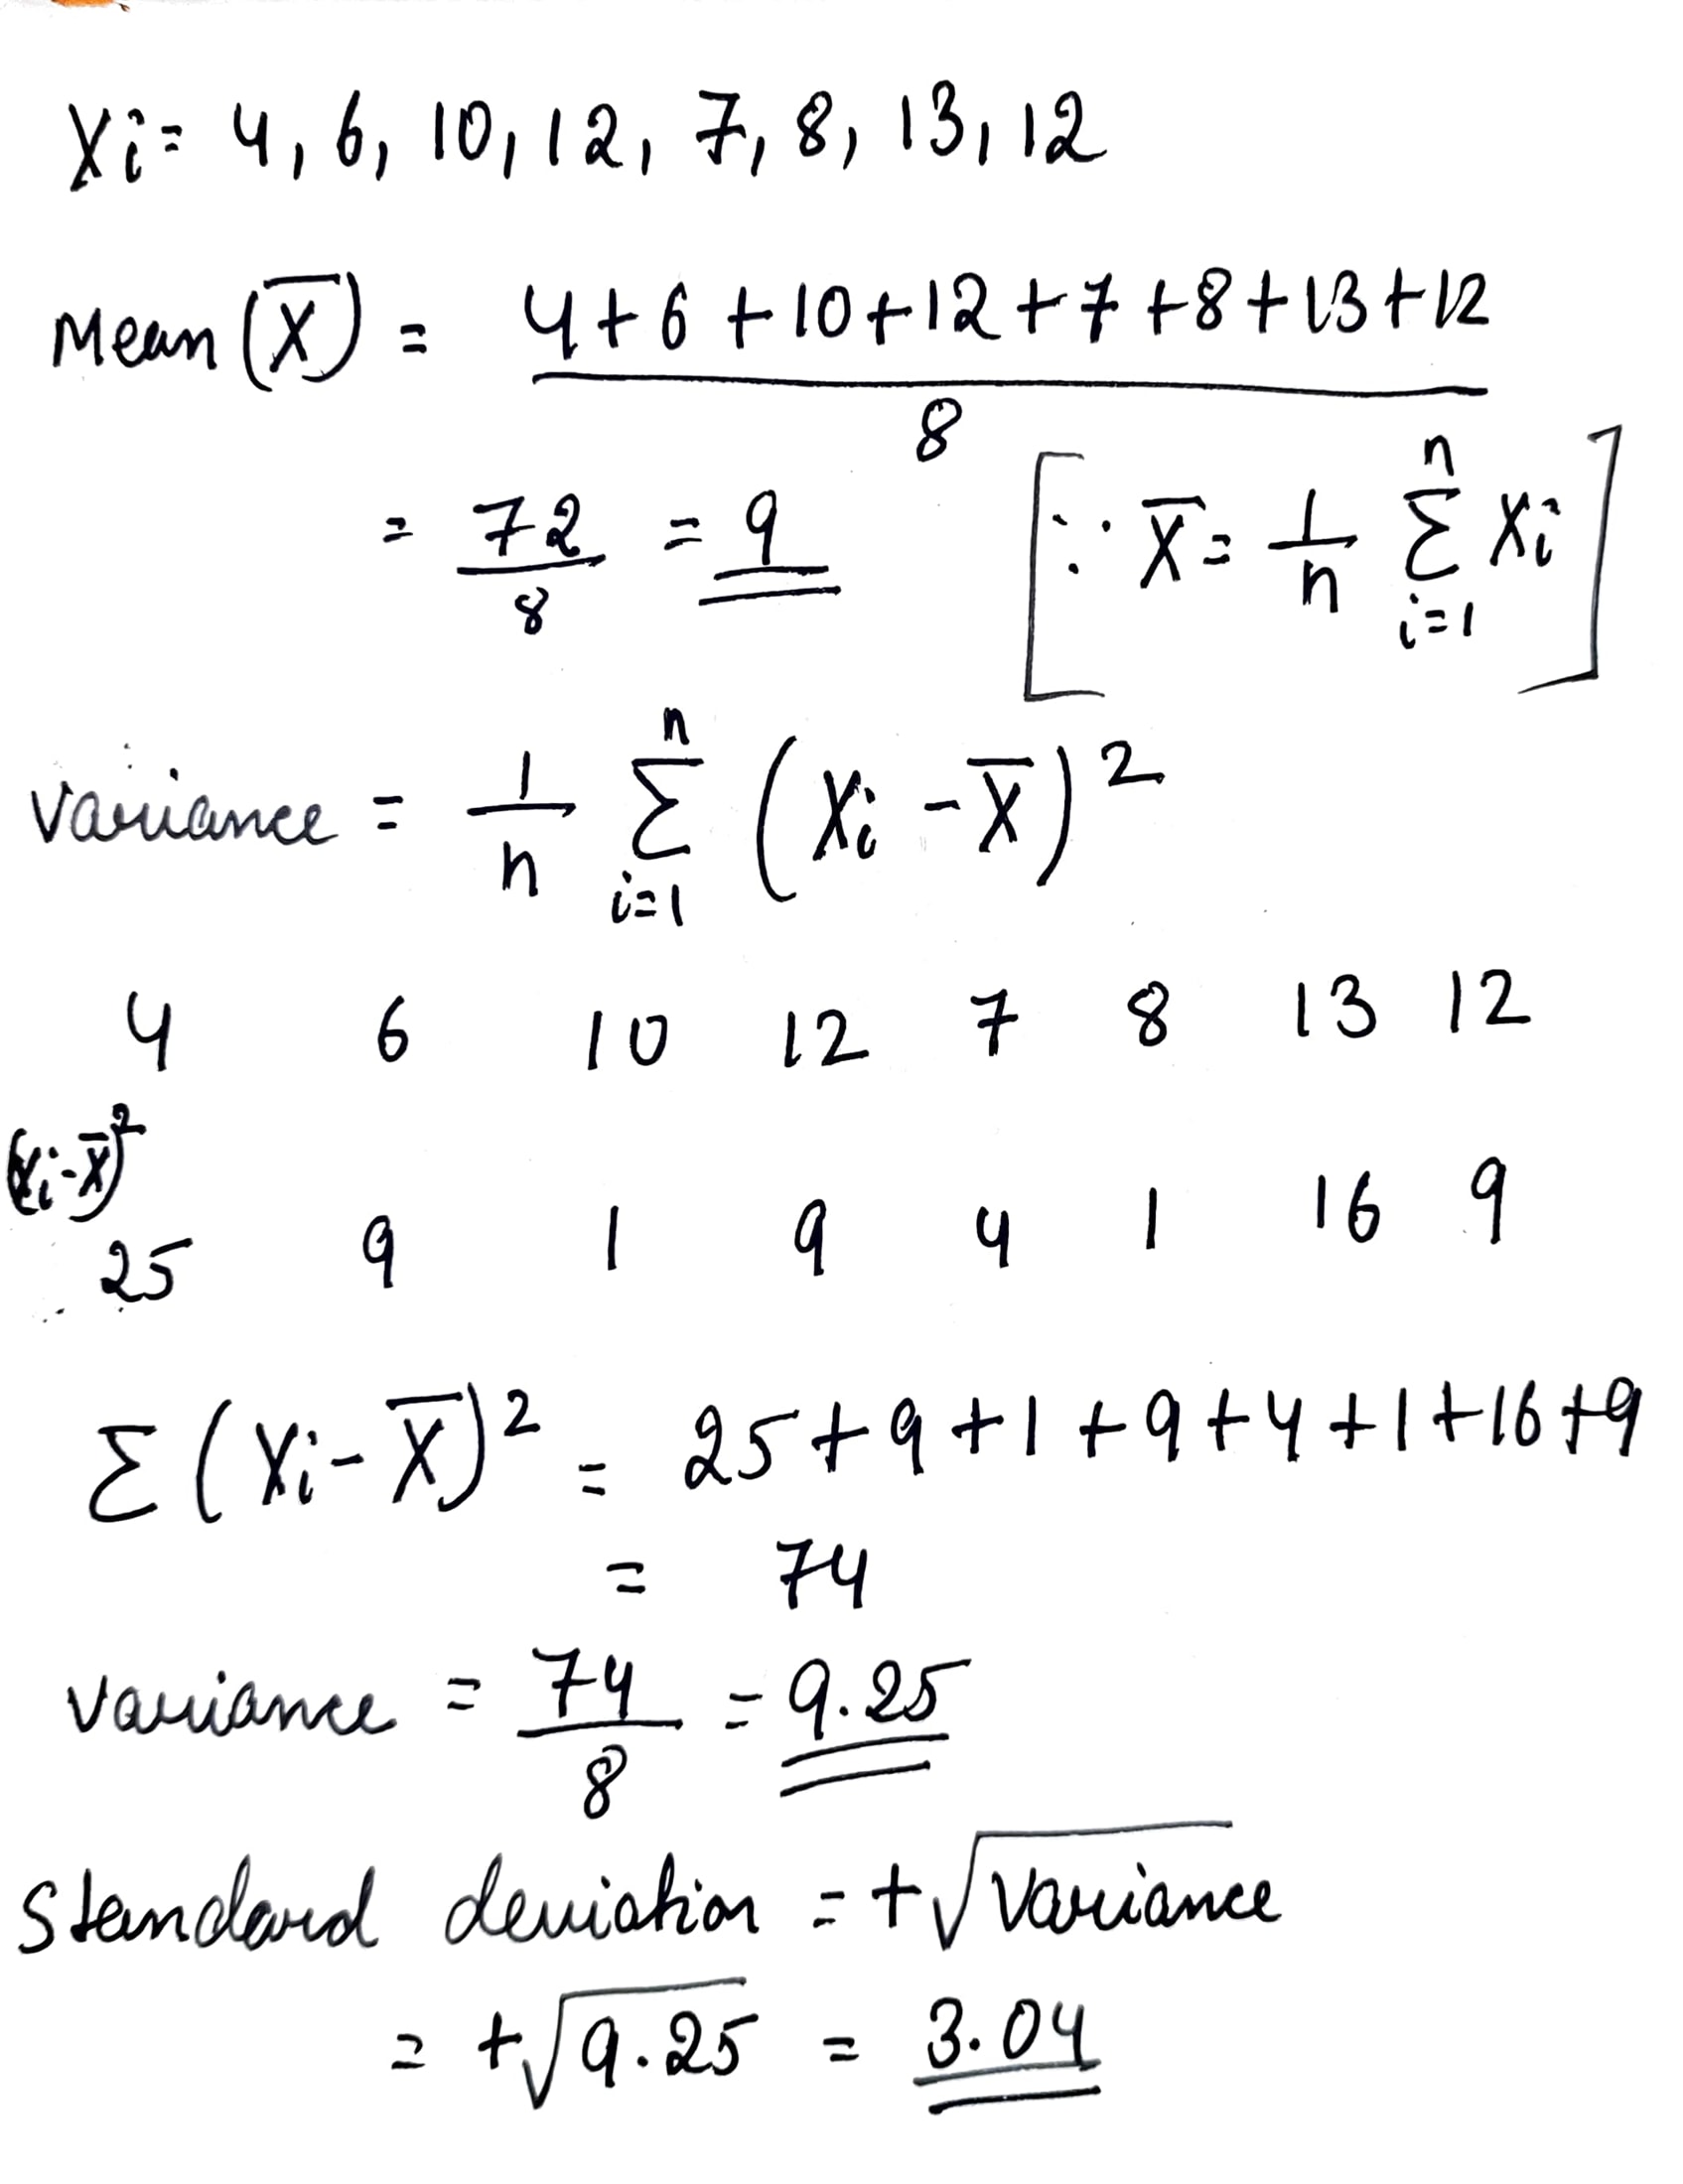
Find the mean, variance and standard deviation for the numbers 4, 6, 10, 12, 7, 8, 13, 12.
Find the median of:
$$10, 32, 17, 19, 21, 22, 9, 35$$
Using short ad method.find the man, variance and standard deviation for the data:
| $$x_i$$ | 6 | 10 | 14 | 18 | 24 | 28 | 30 |
| $$f_i$$ | 2 | 4 | 7 | 12 | 8 | 4 | 3 |
Using short ad method.find the man, variance and standard deviation for the data:
| $$x_i$$ | 4 | 8 | 11 | 17 | 20 | 24 | 32 |
| $$f_i$$ | 3 | 5 | 9 | 5 | 4 | 3 | 1 |
Find the median of first $$15$$ odd numbers.
The age (in years) of $$11$$ cricket players are given below:
$$28, 34, 32, 41, 36, 32, 32, 38, 32, 40, 31$$
Find the mode of the ages.
Find the median for the following distribution:
Wages per day in Rs. $$38$$ $$45$$ $$48$$ $$55$$ $$62$$ $$65$$ No. of workers $$14$$ $$8$$ $$7$$ $$10$$ $$6$$ $$2$$
| Wages per day in Rs. | $$38$$ | $$45$$ | $$48$$ | $$55$$ | $$62$$ | $$65$$ |
| No. of workers | $$14$$ | $$8$$ | $$7$$ | $$10$$ | $$6$$ | $$2$$ |
For the following set of numbers, find the median: $$10, 75, 3, 81, 17, 27, 4, 48, 12, 47, 9, 15$$.
Find the median of first $$50$$ whole numbers.
A student scored the following marks in $$11$$ questions of a question paper: $$3, 4, 7, 2, 5, 6, 1, 8, 2, 5, 7$$ Find the median marks.
Find the median of:
$$55, 60, 35, 51, 29, 63, 72, 91, 85, 82$$
Find the mode of the data:
$$27, 23, 39, 18, 27, 21, 27, 27, 40, 36, 27$$
Find the mode of the data:
$$10, 8, 4, 7, 8, 11, 15, 8, 6, 8$$
Find the median of the following set of numbers: $$9, 0, 2, 8, 5, 3, 5, 4, 1, 5, 2, 7$$.
At a shooting competition, the scores of a competitor were as given below :
Score | 0 | 1 | 2 | 3 | 4 | 5 |
No. of shots | 0 | 3 | 6 | 4 | 7 | 5 |
Marks obtained by $$70$$ students are given below:
Marks | 20 | 70 | 50 | 60 | 75 | 90 | 40 |
No. of students | 8 | 12 | 18 | 6 | 9 | 5 | 12 |
Find the mode of the following observations$$5, 7, 6, 8, 9, 0, 6, 8, 1, 8$$
Find the mode of the following sets of numbers:$$3, 2, 0, 1, 2, 3, 5, 3$$.
Find the median for the following distribution.
Marks | 35 | 45 | 50 | 64 | 70 | 72 |
No. of students | 3 | 5 | 8 | 10 | 5 | 5 |
The daily wages in (rupees of) $$19$$ workers are
$$41, 21, 38, 27, 31, 45, 23, 26, 29, 30, 28, 25, 35, 42, 47, 53, 29, 31, 35$$.
Find the median?
A boy scored the following marks in various class tests during a term each test being marked out of $$20$$: $$15, 17, 16, 7, 10, 12, 14, 16, 19, 12, 16$$. What are his median marks?
Find the mode of the following sets of numbers: $$9, 0, 2, 8, 5, 3, 5, 4, 1, 5, 2, 7$$
Find the median of first nine even natural numbers.
Find the
mean deviation about the median for the data
| $$x_i$$ | 5 | 7 | 9 | 10 | 12 | 15 |
| $$f_i$$ | 8 | 6 | 2 | 2 | 2 | 6 |
Enter 1 if it is true else enter 0.In a set of observations, the observation that occurs the most often is called Mode.
Enter 1 if it is true else enter 0.In a given data, arranged in ascending or descending order, the middle most observation is called Median.
Observe the data and answer the questions that follow:
$$16,15,16,16,8,15,17$$
(a) Which data value can be put in the data so that the mode remains the same?
(b) At least how many and which value(s) must be put in to change the mode to 15?
(c) What is the least number of data values that must be put in to change the mode to 17? Name them.
Enter 1 if it is true else enter 0.Mean, Median, Mode are the measures of Central tendency.
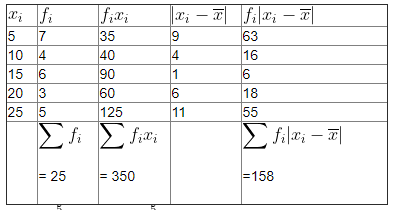
Find the mean deviation about the mean for the data.
| $$x$$ | 5 | 10 | 15 | 20 | 25 |
| $$f_{i}$$ | 7 | 4 | 6 | 3 | 5 |
Find the mode of the given data:
$$10,8,4,7,8,11,15,8,4,2,3,6,8$$
Age (in years) of 6 children of two groups are recorded as below:
| Group A | Group B |
| 7 | 7 |
| 7 | 9 |
| 9 | 11 |
| 8 | 12 |
| 10 | 12 |
| 10 | 12 |
(b) Find the range and mode if the two groups are combined together
Find the median of
$$26,33,41,18,30,22,36,45,$$ and $$24$$
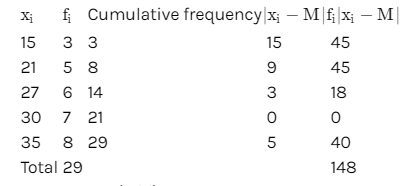
Find the mean deviation about the median for the data
| $$\mathrm{x_i}$$ | 15 | 21 | 27 | 30 | 35 |
| $$\mathrm{f}_{\mathrm{i}}$$ | 3 | 5 | 6 | 7 | 8 |
A student got the following marks in $$9$$ questions of a question paper.
$$3, 5, 7, 3, 8, 0, 1, 4$$ and $$6.$$
Find the median of these marks.
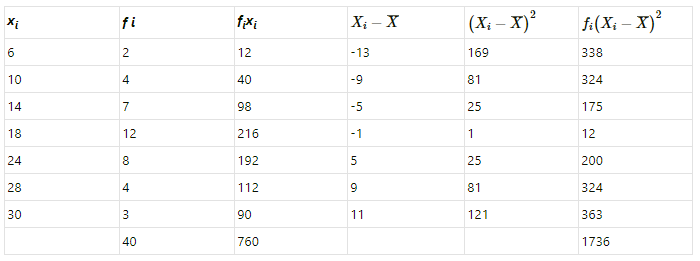
Find the mean and variance for the data
| $$x_i$$ | 6 | 10 | 14 | 18 | 24 | 28 | 30 |
| $$f_i$$ | 2 | 4 | 7 | 12 | 8 | 4 | 3 |
Find the mean and variance for the data
| $$x_i$$ | 92 | 93 | 97 | 98 | 102 | 104 | 109 |
| $$f_i$$ | 3 | 2 | 3 | 2 | 6 | 3 | 3 |
Find the mean and variance for the first n natural numbers
Find the mean and the median of :
$$2,4,5,8,10,13$$ and $$14$$
Find the mode of the following distribution:
| Marks | 0-10 | 10-20 | 20-30 | 30-40 | 40-50 | 50-60 | 60-70 | 70-80 |
| Number of students | 15 | 20 | 24 | 24 | 12 | 31 | 71 | 52 |
Fill in the blanks:
A data arranged in ascending or descending order is called an........ data.
Find the mode of the following data: $$9, 11, 8, 11, 16, 9, 11, 5, 3, 11, 17$$ and $$8$$
From the following data, find: Median
$$25, 10, 40, 88, 45, 60, 77, 36, 18, 95, 56, 65, 7, 0, 38$$ and $$83$$
The marks obtained by $$19$$ students of a class are given below:
$$27, 36, 22, 31, 25, 26, 33, 24, 37, 32, 29, 28, 36, 35, 27, 26, 32, 35$$ and $$28$$. Find: median
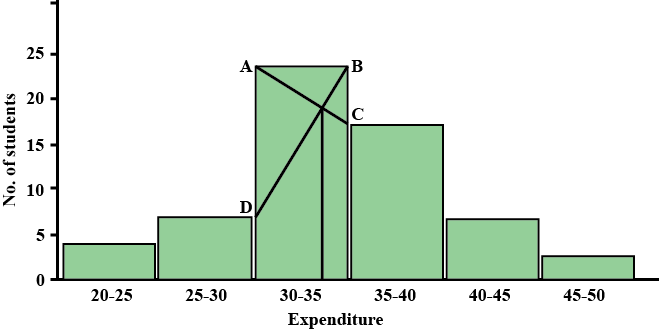
The following table shows the expenditure of $$60$$ boys on books. Find the mode of their expenditure:
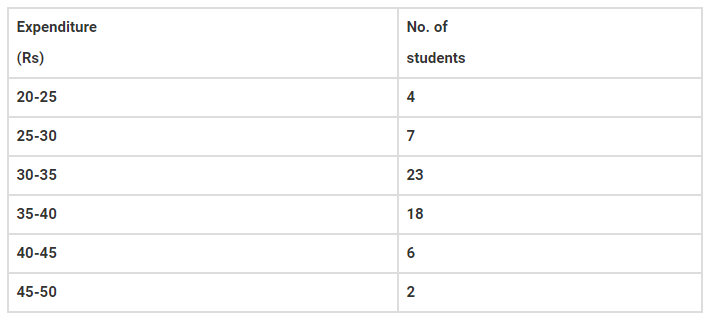
Mode is in $$30-35$$ because it has the maximum frequency.
241, 243, 347, 350, 327, 299, 261, 292, 271, 258 and 257.
63, 17, 50, 9, 25, 43, 21, 50, 14 and 34.
Find the mode of the following data: $$7, 9, 8, 7, 7, 6, 8, 10, 7$$ and $$6$$.
Out of 10 students, who appeared in a test, three secured less than 30 marks and 3 secured more than 75 marks. The marks secured by the remaining 4 students are 35, 48, 66 andFind the median score of the whole group.
233, 173, 189, 208, 194, 204, 194, 185, 200 and 220.
The weights (in kg) of $$10$$ students of a class are given below:
$$21, 28.5, 20.5, 24, 25.5, 22, 27.5, 28, 21$$ and $$24.$$
Find the median of their weights.
Grouped frequency distribution of supply of milk to hotels and the number of hotels is given in the following table. Find the mode of the supply of milk.
| Milk (litre) | 1 - 3 | 3 - 5 | 5 - 7 | 7 - 9 | 9 - 11 | 11 - 13 |
| No. of hotels | 7 | 5 | 15 | 20 | 35 | 18 |
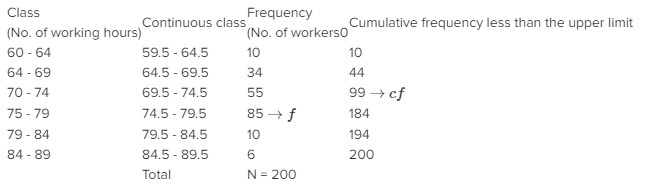
The following table shows the classification of number of vehicles and their speeds on Mumbai-Pune express way. Find the median of the data.
| Average Speed of vehicles (km/hr) | 60 - 64 | 64 - 69 | 70 - 74 | 75 - 79 | 79 - 84 | 84 - 89 |
| No. of vehicles | 10 | 34 | 55 | 85 | 10 | 6 |
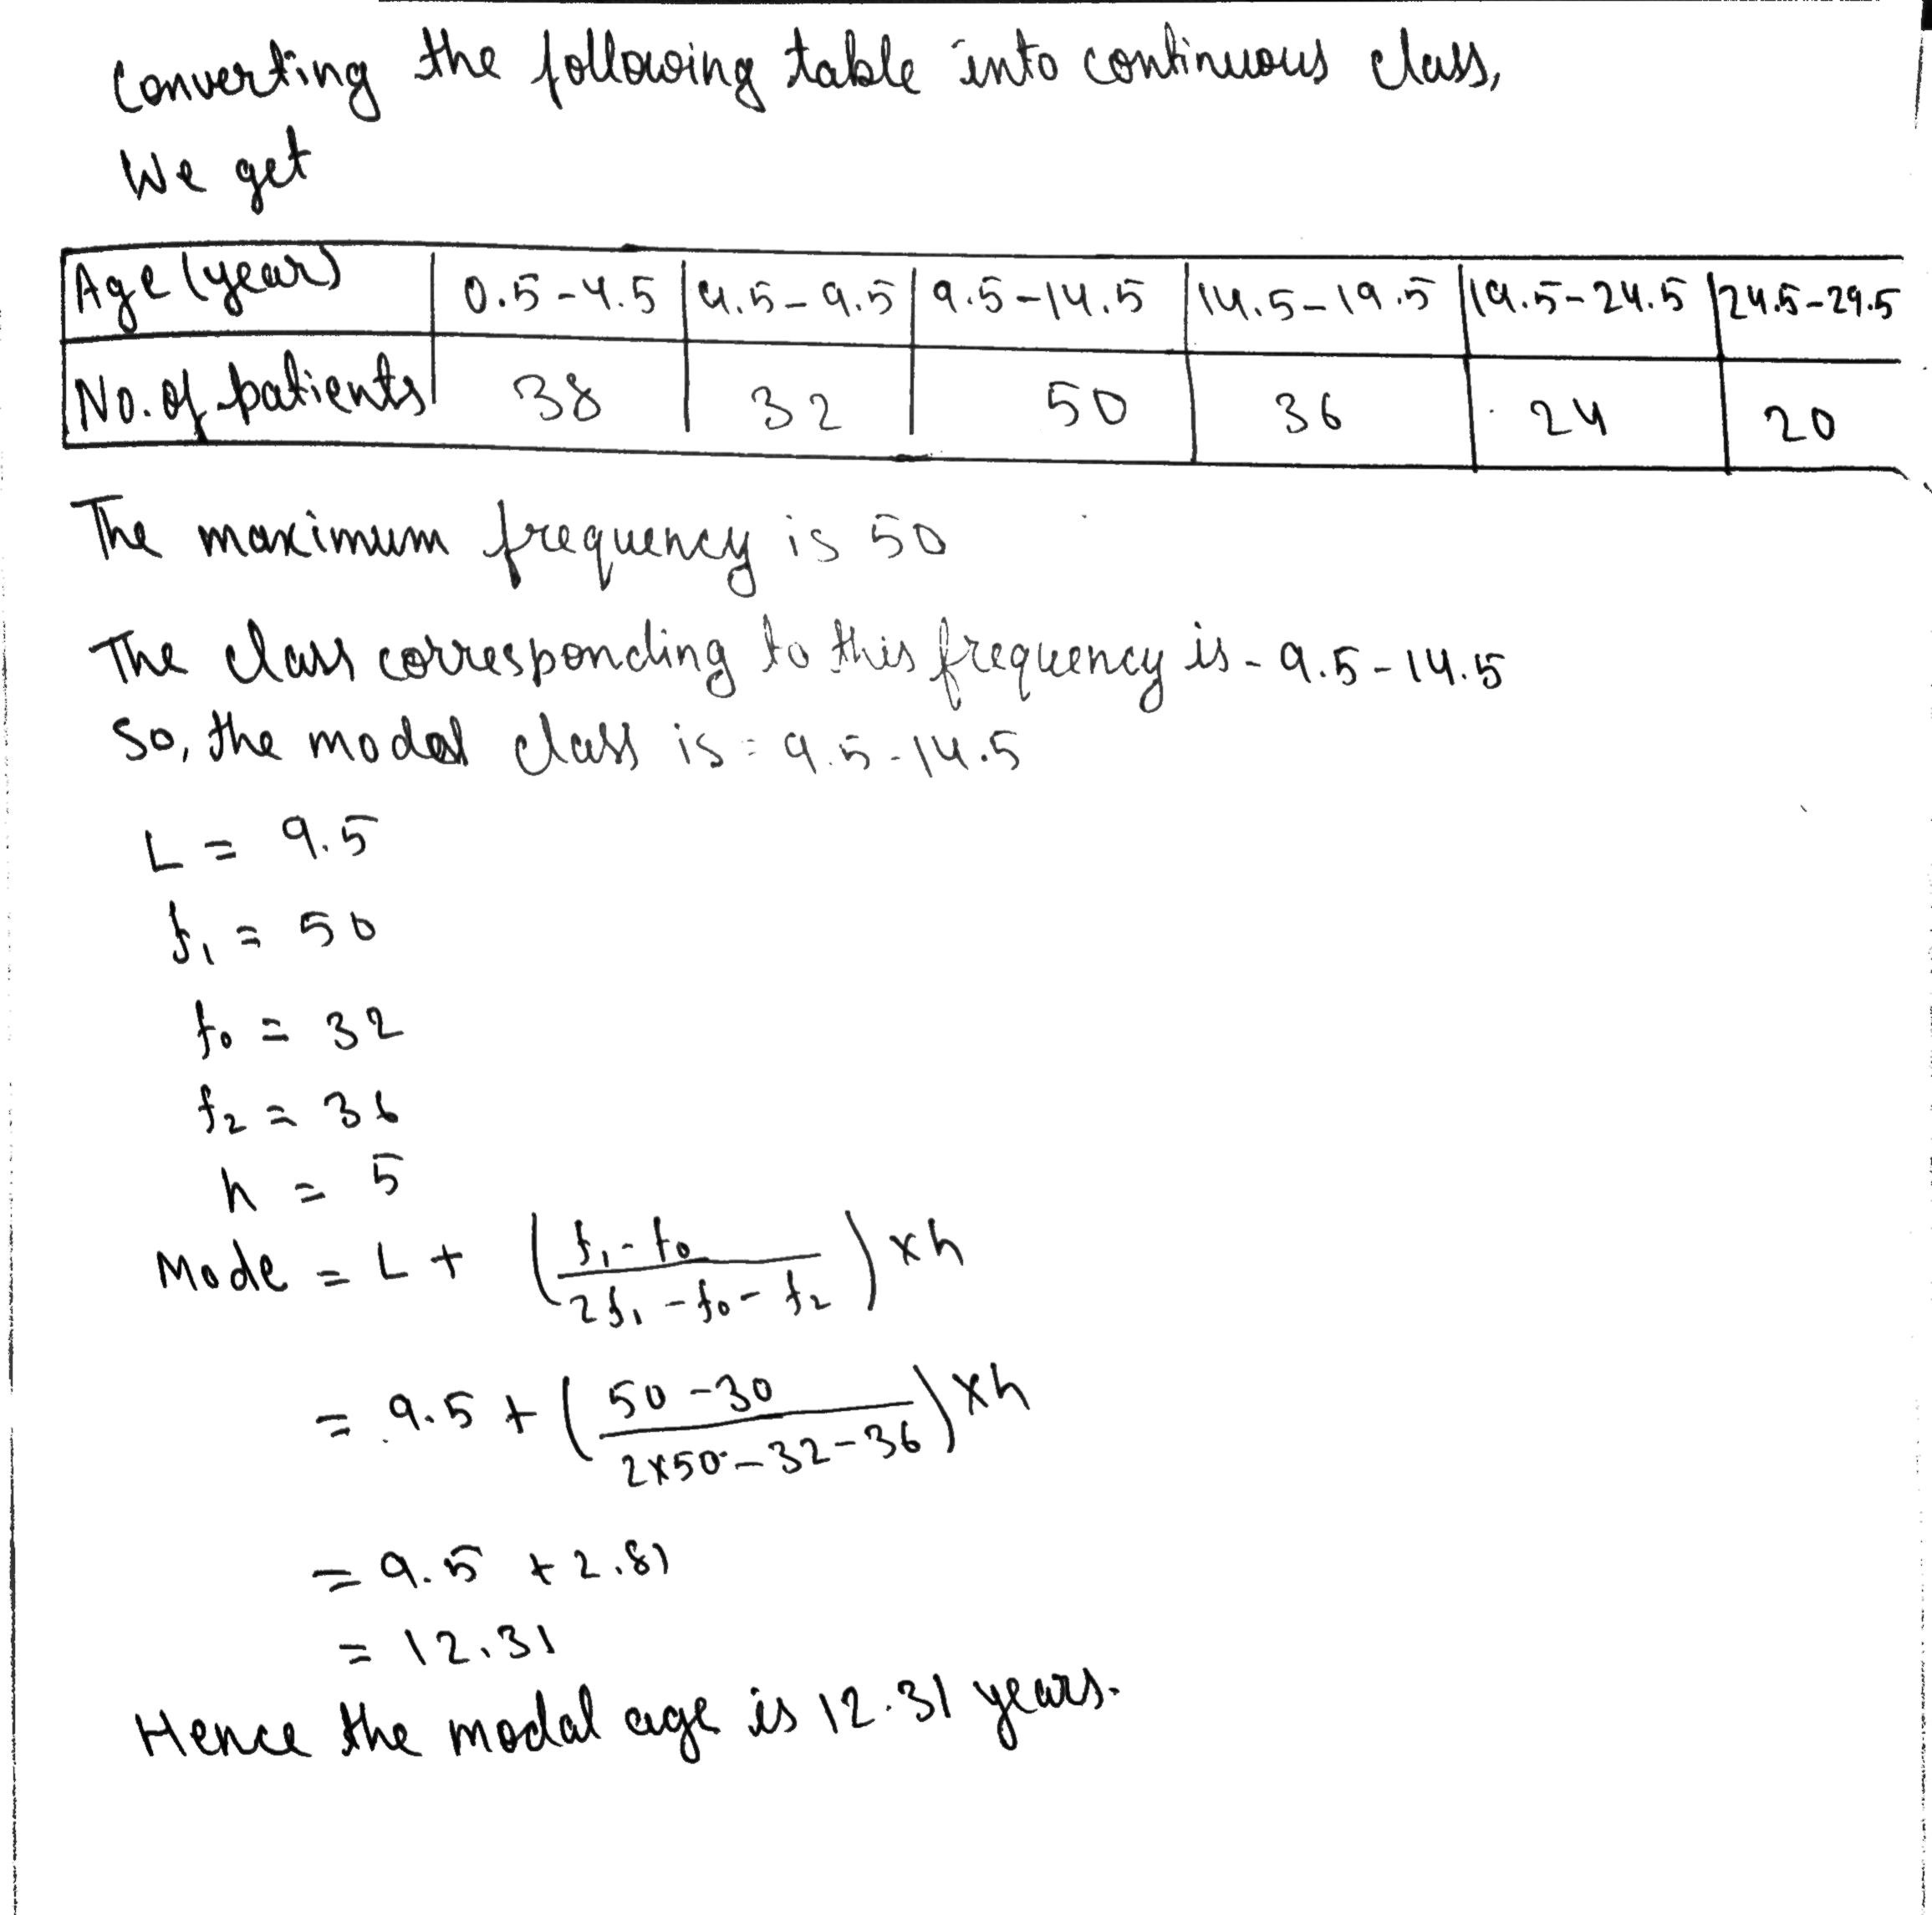
Grouped frequency distribution of supply of milk to hotels and the number of hotels is given in the following table. Find the mode of the supply of mik.
| Age (years) | :ess than 5 | 5 - 9 | 10 - 14 | 15 - 19 | 20 - 24 | 25 - 29 |
| No. of patients | 38 | 32 | 50 | 36 | 24 | 20 |
Electricity used by some families is shown in the following table. Find the mode for use of electricity.
| Use of electricity (Unit) | $$0 - 20$$ | $$20 - 40$$ | $$40 - 60$$ | $$60 - 80$$ | $$80 - 100$$ | $$100 - 120$$ |
| No of families | $$13$$ | $$50$$ | $$70$$ | $$100$$ | $$80$$ | $$17$$ |
In a basket, there are $$10$$ tomatoes. The weight of each of these tomatoes in grams is as follows:
$$60, 70, 90, 95, 50, 65, 70, 80, 85, 95$$.Find the median of the weights of tomatoes.
The following table shows the information regarding the milk collected from farmers on a milk collection centre and the content of fat in the milk, measured by a lactometer. find the mode of fat content.
| Content of Fat (%) | 2 - 3 | 3 - 4 | 4 - 5 | 5 - 6 | 6 - 7 |
| Milk collected (liter) | 30 | 70 | 80 | 60 | 20 |
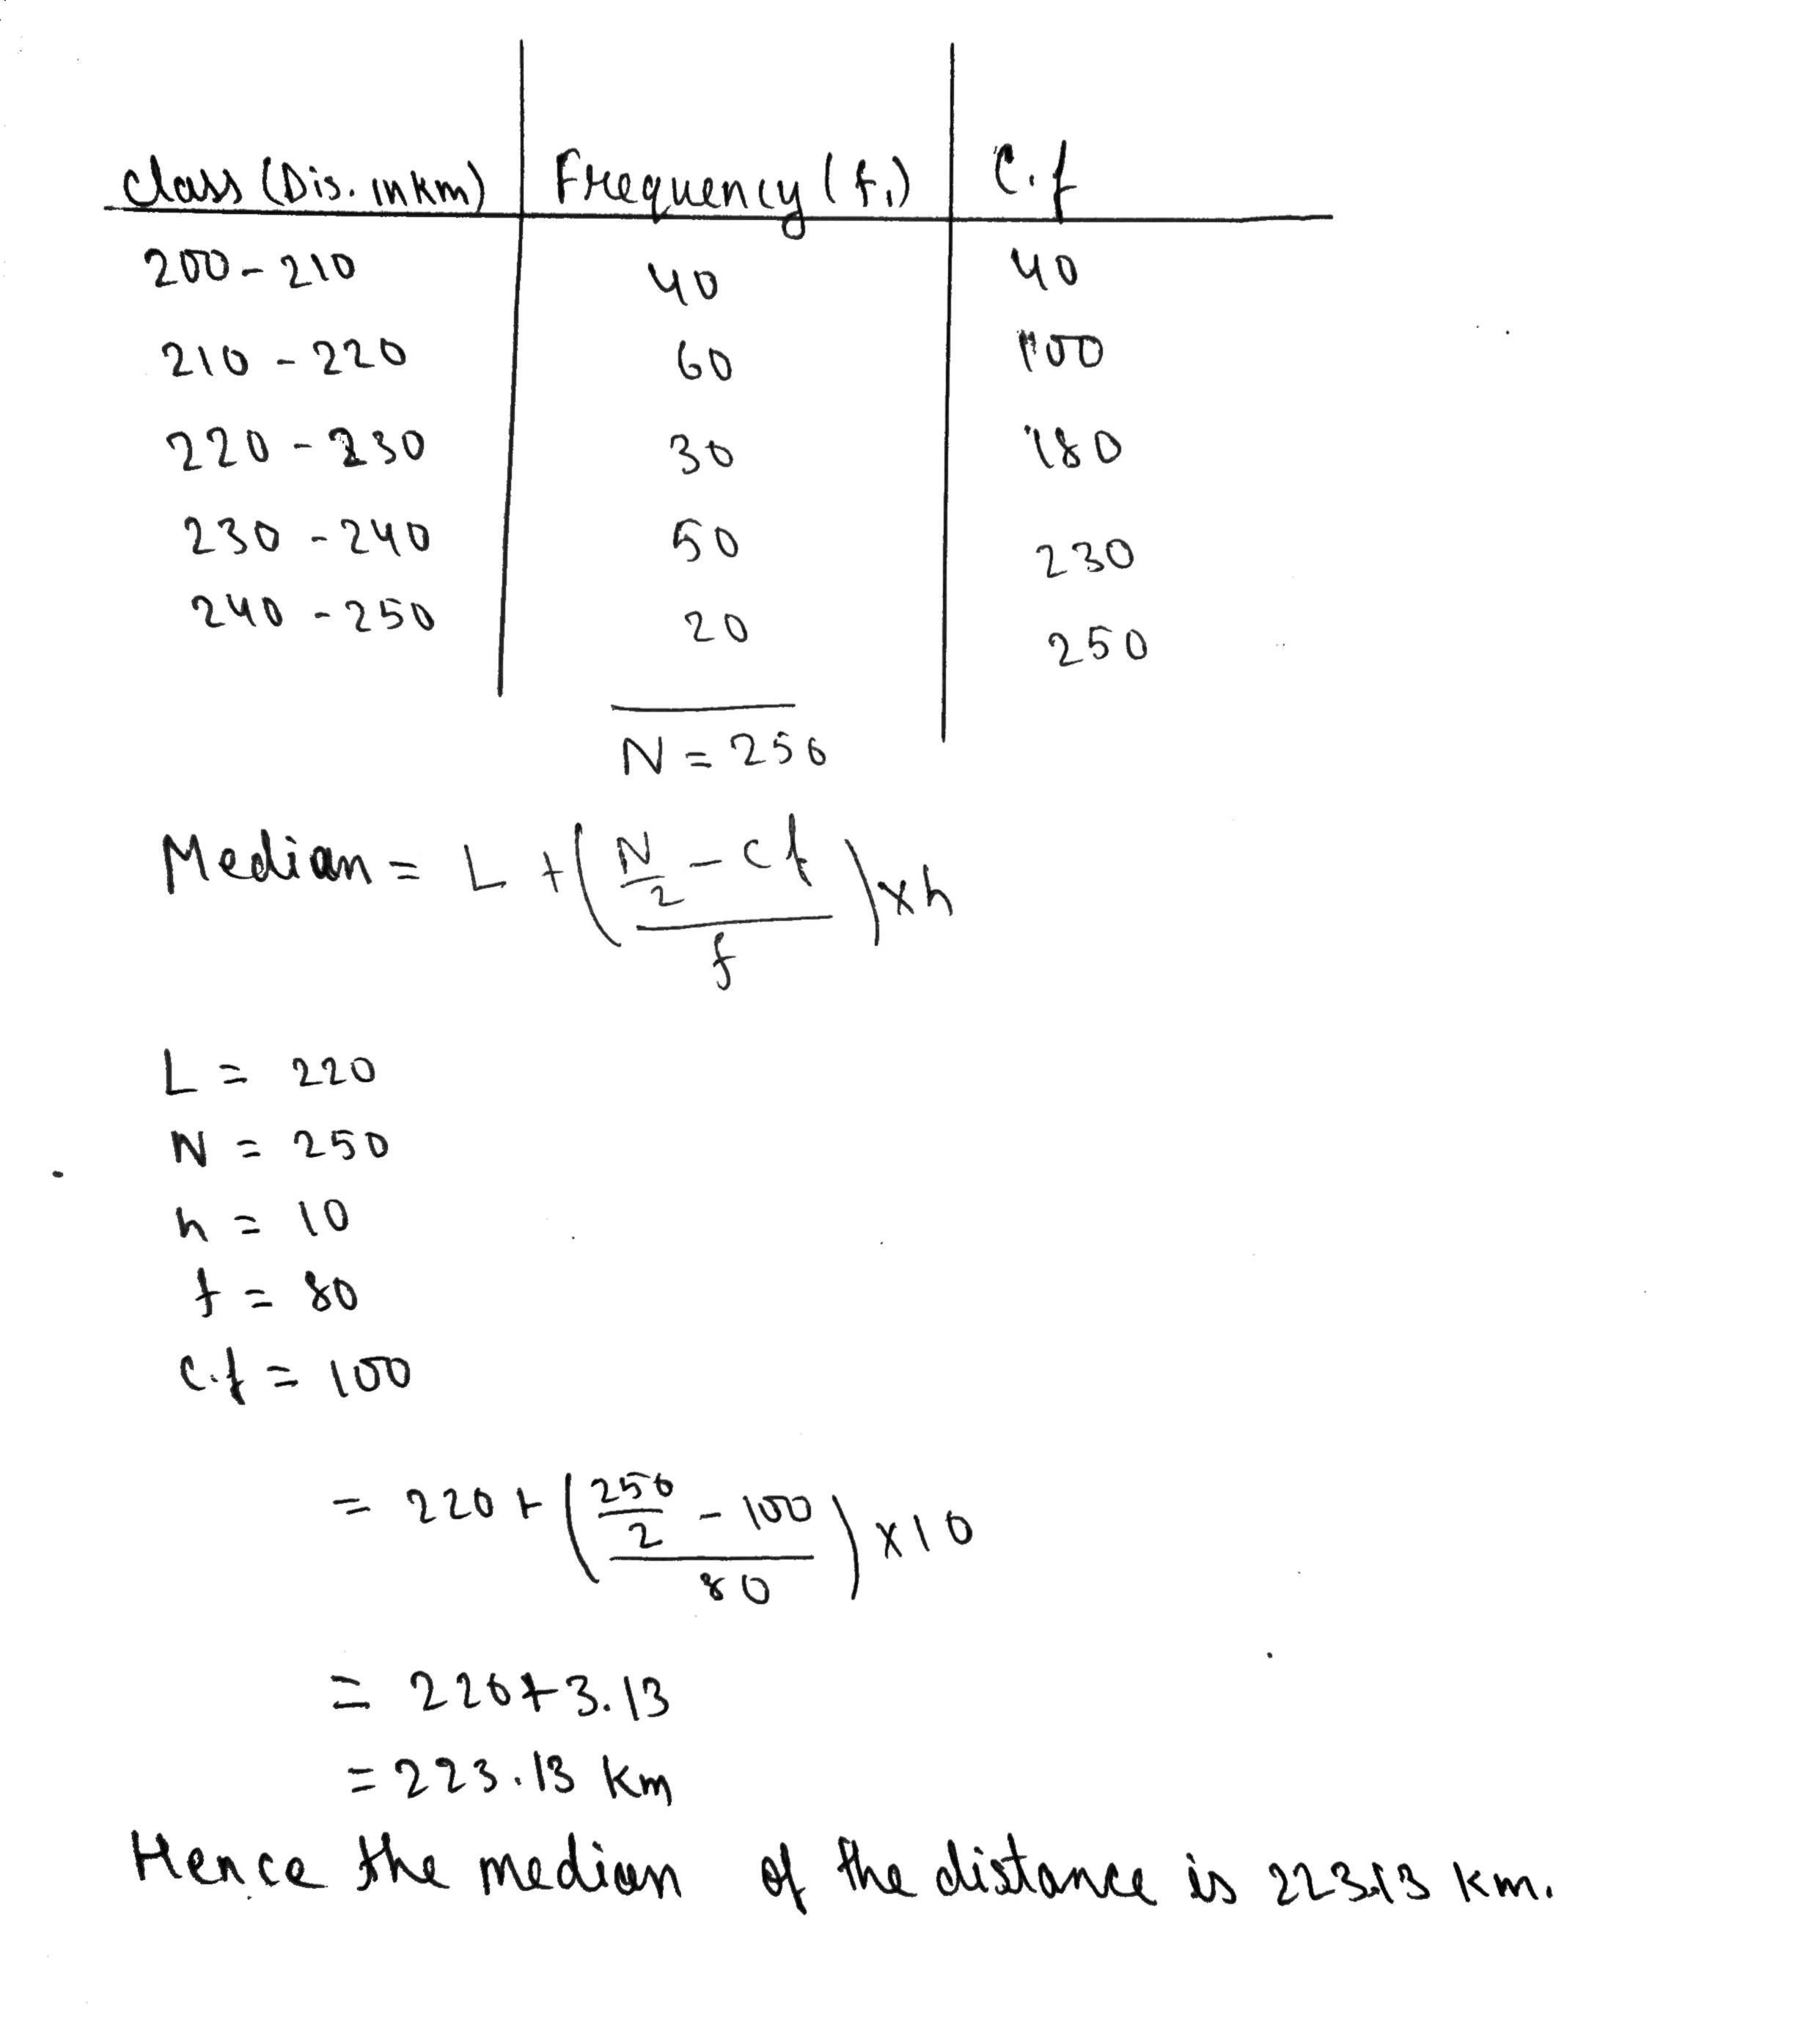
The distance covered by 250 public transport buses in a day is shown in the following frequency distribution table. Find the median of the distance.
| Distance (km) | 200-210 | 210-220 | 220-230 | 230-240 | 240-250 |
| No. of buses | 40 | 60 | 80 | 50 | 20 |
The heights (in cm) of the volley-ball players from team A and team B were recorded as:
Team A: 180, 178, 176, 181, 190, 175, 187
Team B: 174, 175, 190, 179, 178, 185, 177
Find the median of team A and team B.
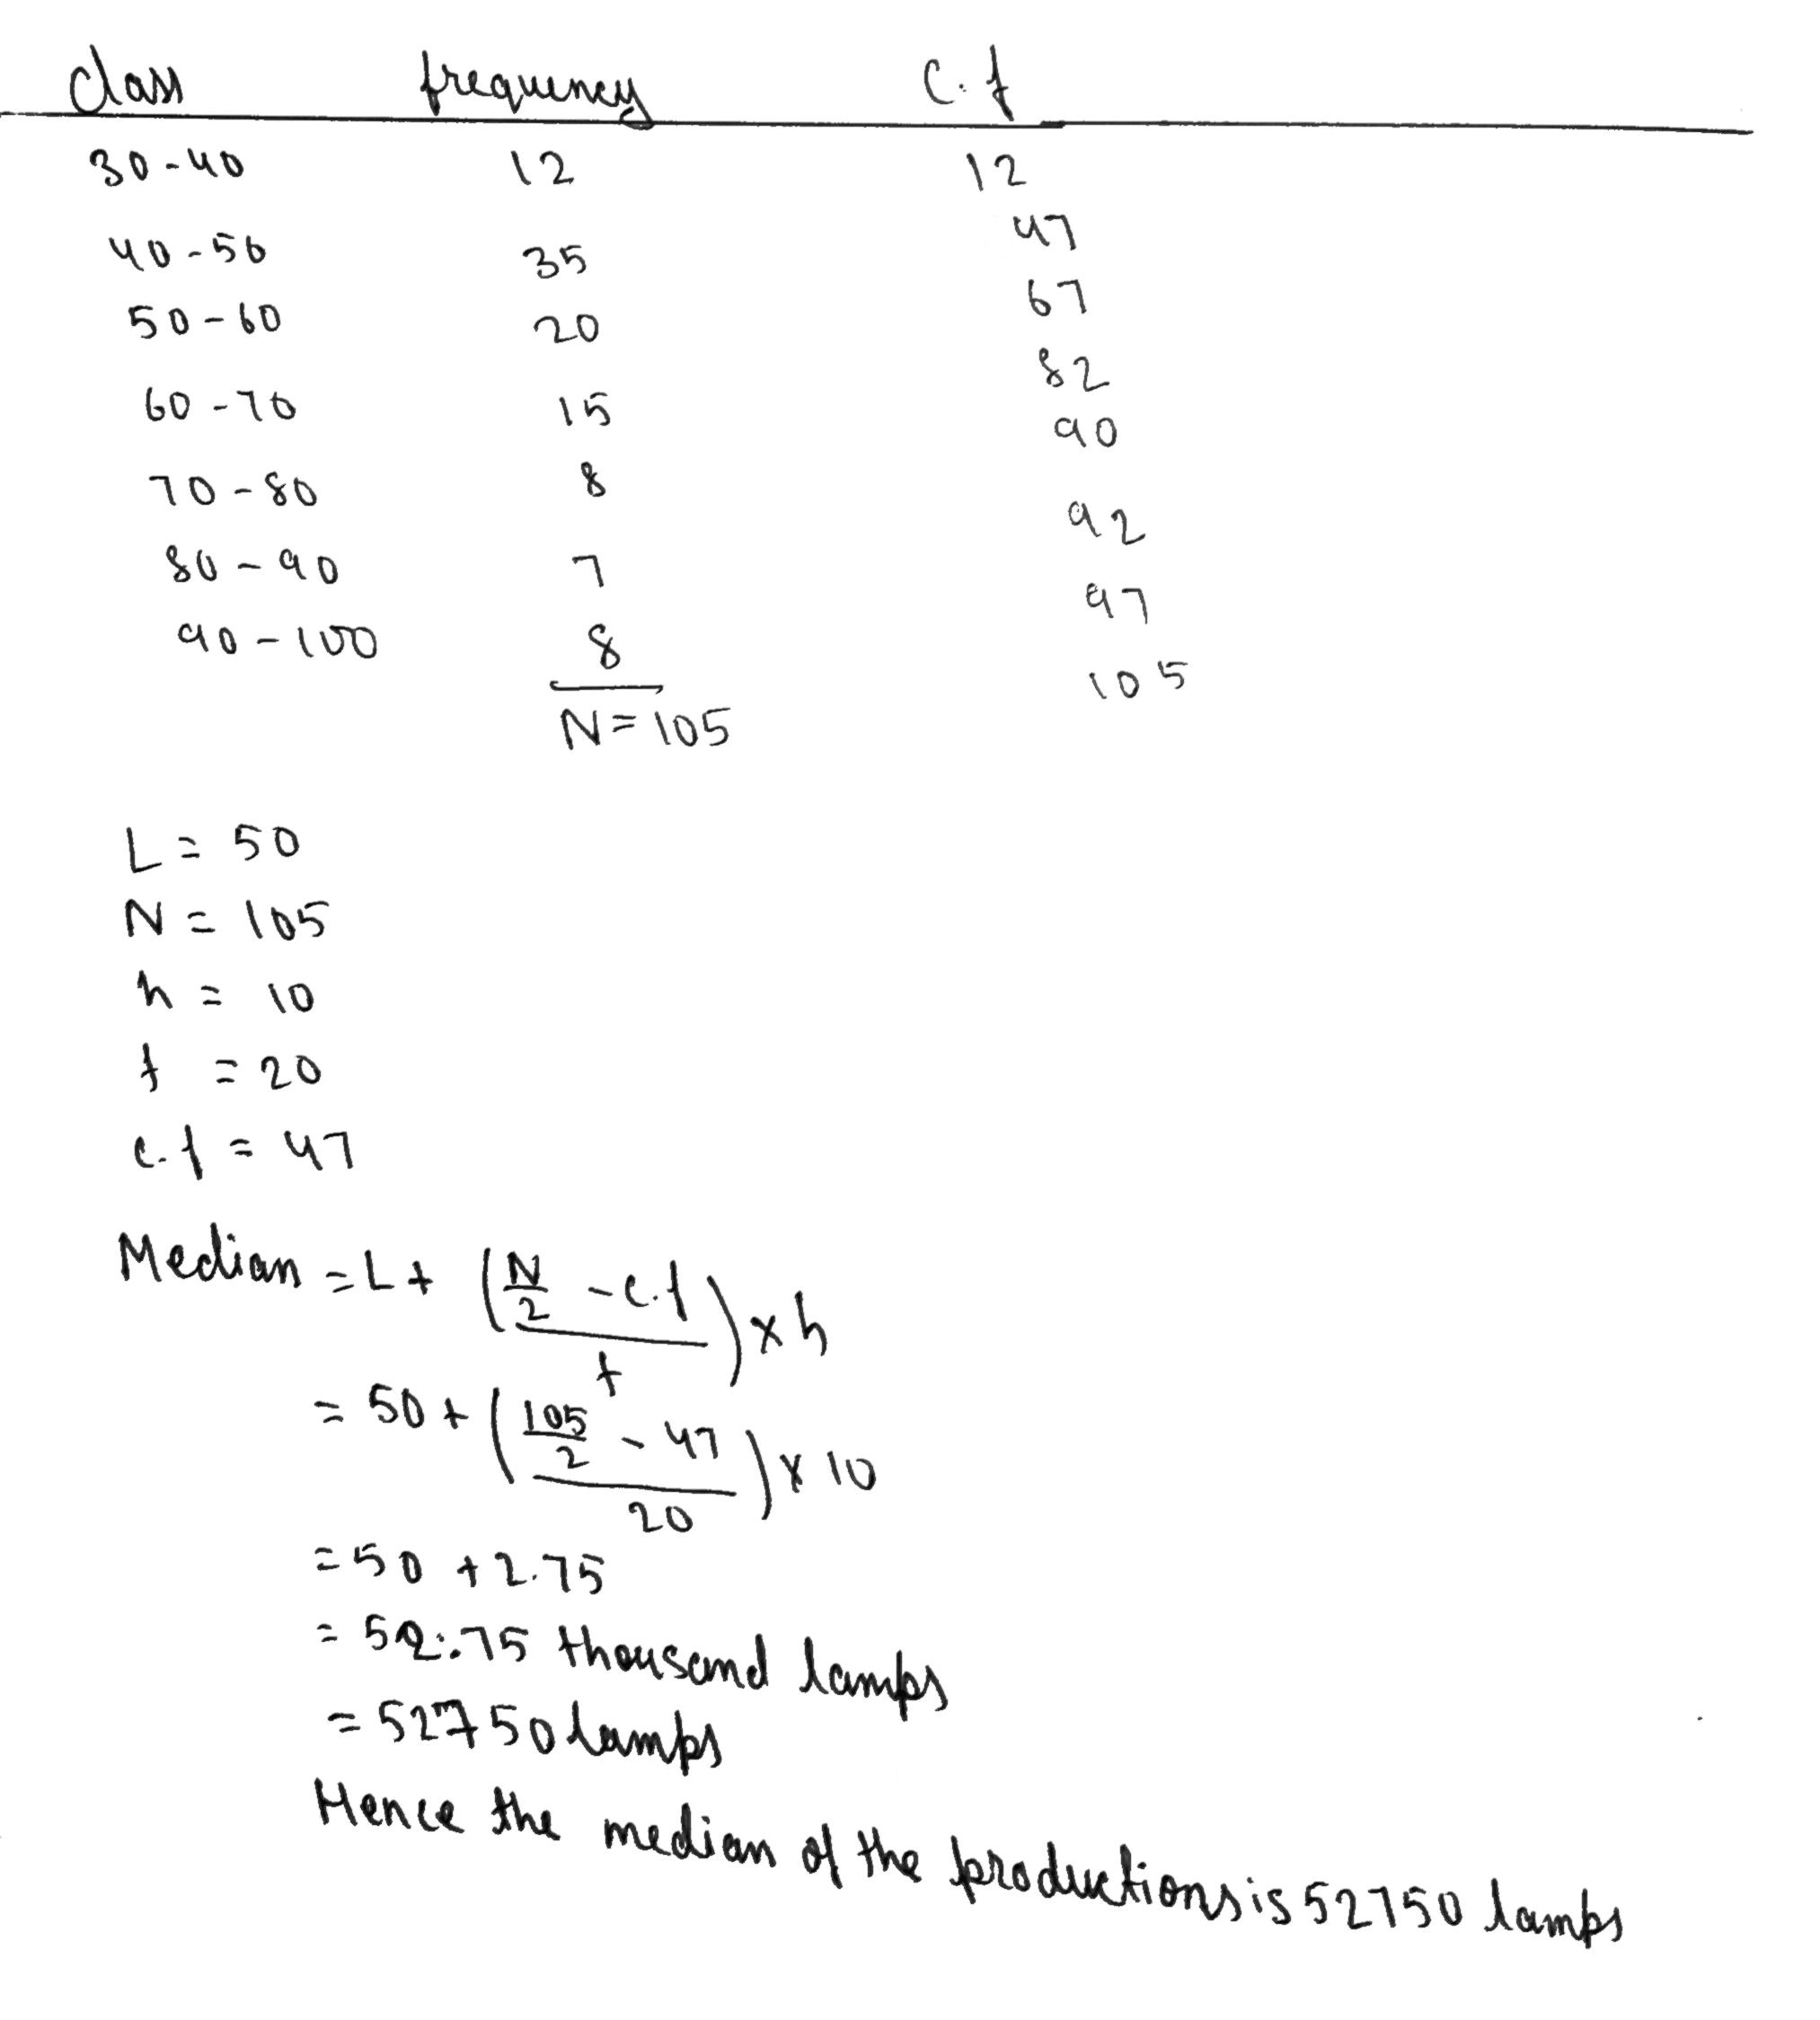
The production of electric bulbs in different factories is shown in the following table. Find the median of the productions.
| No. of bulbs produced (Thousands) | 30 - 40 | 40 - 50 | 50 - 60 | 60 - 70 | 70 - 80 | 80 - 90 | 90 - 100 |
| No. of factories | 12 | 35 | 20 | 15 | 8 | 7 | 8 |
A student noted the number of cars passing through a spot on a road for 100 periods each of 3 minutes and summarised it in the table given below. Find the mode of the data:
| No. of Cars | 0 - 10 | 10 - 20 | 20 - 30 | 30 - 40 | 40 - 50 | 50 - 60 | 60 - 70 | 70 - 80 |
| Frequency | 7 | 14 | 13 | 12 | 20 | 11 | 15 | 8 |
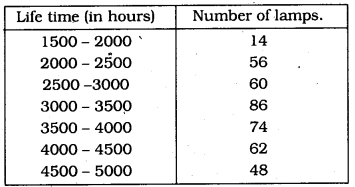
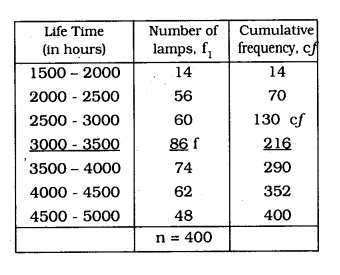
The following table gives the distribution of lifetime of 400 neon lamps:
Find the median lifetime of the lamp.
Write the formula to find median for grouped data.
The given distribution shows the number of runs scored by some top batsmen of the world in one-day international cricket matches.
| Runs scored | Number of batsmen |
| 3000 - 4000 | 4 |
| 4000 - 5000 | 18 |
| 5000 - 6000 | 9 |
| 6000 - 7000 | 7 |
| 7000 - 8000 | 6 |
| 8000 - 9000 | 3 |
| 9000 - 10000 | 1 |
| 10000 - 11,000 | 1 |
Find the median of the data 15, 22 , 9 , 20 , 6, 18 , 11 ,25 ,14.
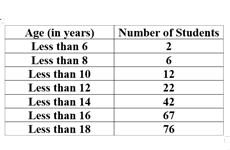
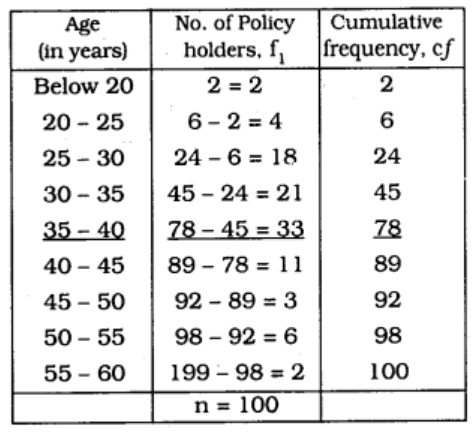
A life insurance agent found the following data for the distribution of ages of 100 policyholders. Calculate the median age, if policies are given only to persons having age 18 years onwards bu less than 60 years
| Age (in years) | No. of policy holders |
| Below 20 | 2 |
| Below 25 | 6 |
| Below 30 | 24 |
| Below 35 | 45 |
| Below 40 | 78 |
| Below 45 | 89 |
| Below 50 | 92 |
| Below 55 | 98 |
| Below 60 | 100 |
Median in which C.I. is (35 - 40)
$$ l = 35, n =100, f = 33, cf = 45, h = 5 $$
$$ \therefore \mathbf{Median} = l + \left [ \dfrac{\dfrac{n}{2} - cf}{f} \right ] \times h $$
$$ = 35 + \left ( \dfrac{50 - 45}{33} \right ) \times 5 $$
$$ = 35 + \dfrac{25}{33} $$
$$ = 35 + 0.76 $$
$$ \therefore \mathbf{Median} = 35.76 $$ years
Find the median for the following frequency distribution table.
| Class interval | 0 - 5 | 5 - 10 | 10 - 15 | 15 - 20 | 20 - 25 | 25 - 30 |
| Frequency | 5 | 3 | 9 | 10 | 8 | 5 |
A life insurance agent found the following data for the distribution of ages of 100 policyholders. Calculate the median age, if policies are given only to persons having age 18 years onwards but lets than 60 years.
| Age (in years) | No. of policyholders (cf) |
| Below 20 | 2 |
| Below 25 | 6 |
| Below 30 | 24 |
| Below 35 | 45 |
| Below 40 | 78 |
| Below 45 | 89 |
| Below 50 | 92 |
| Below 55 | 98 |
| Below 60 | 100 |
Find the median of the data 22 , 28 ,34 , 49 , 44 , 57 , 18 , 10 , 33 ,41 , 66 , 59
The lengths of 40 leaves of a plant are measured correct to the nearest millimetre, and the data obtained is represented in the following table:
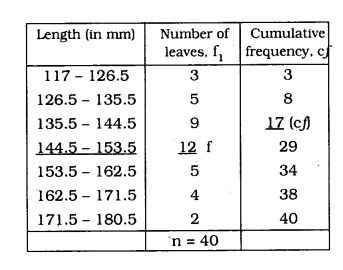
Find the median length of the leaves. (Hint: The data needs to be converted to continuous classes for finding the median since the formula assumes continuous classes. The classes then change to $$ 117.5-126.5,126.5-135.5 $$ $$ 171.5-180.5) $$
$$\text{l=144.5, n=40, f=12, cf=17, h=9}$$
$$ \begin{aligned} \therefore \quad \text { Median } &=l+\left[\dfrac{\dfrac{\mathrm{n}}{2}-\mathrm{c} f}{\mathrm{f}}\right] \times \mathrm{h} \\ &=144.5+\left(\dfrac{20-17}{12}\right) \times 9 \\ &=144.5+\left(\dfrac{20-17}{12}\right) \times 9 \\ &=144.5+\dfrac{3}{12} \times 9 \\ &=144.5+\dfrac{9}{4} \\ &=14.5+2.25 \\ \therefore \text { Median }=& 146.75 \mathrm{mm} \end{aligned} $$
Find the coefficient of range of the following data -
| Size | 10 - 15 | 15 - 20 | 20 - 25 | 25 - 30 |
| Frequency | 2 | 4 | 6 | 8 |
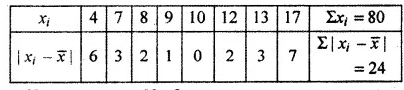
Find the mean deviation from mean for the data
$$4, 7, 8, 9, 10, 12, 13, 17 $$
Mean $$(\bar{x}) = \dfrac{\sum \ x_{1} - \bar{x}}{N} $$
$$= \dfrac{24}{8} = 3 $$
Find the mean deviation from mode for the data
$$2, 2, 2.5, 2.1, 2.9, 2.8, 2.5, 2.3$$
Find the mean deviation from mode for the data
$$2, 4, 6, 4, 8, 6, 4, 10, 4, 8 $$
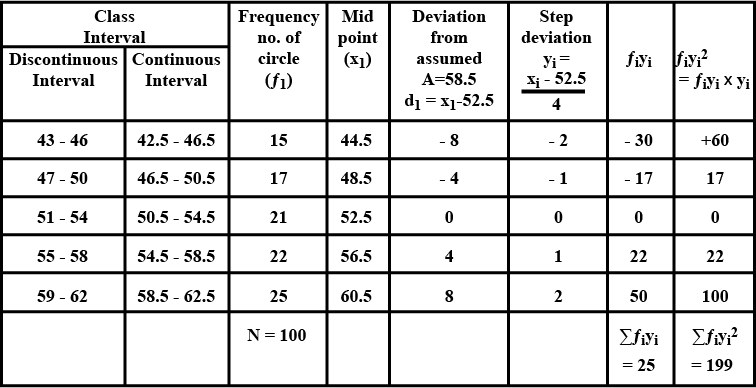
Find the mean deviation of circles in given table .
| Diameter (mm) | 43-46 | 47-50 | 51-54 | 55-58 | 59-62 |
| Number of circles | 15 | 17 | 21 | 22 | 25 |
Calculate table for mean deviation and mean diameter
Mean deviation $$(\bar{x}) = A + \dfrac{\sum f_{i} y _{i}}{N} h = 52.5 + \dfrac{25}{100} \times 4 = 52.5 + 1 = 53.5 mm $$
Find mean and variance for the data
| $$x_{i}$$ | 6 | 10 | 14 | 18 | 24 | 28 | 30 |
| $$f_{i}$$ | 2 | 4 | 7 | 12 | 8 | 4 | 3 |
Find the mode for the following data .
22 , 36 , 18 , 22 , 20 , 34 , 22 , 42, 46 , 42
Find the mode for the following data .
4 , 3 , 1 , 5 , 3 , 7 , 9 , 6
Find the mean deviation from mean for the data
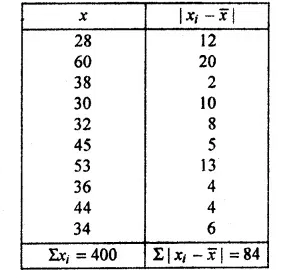
$$ 28, 60, 38, 30, 32, 45, 53, 36, 44, 34 $$
Mean $$(\bar{x}) = \dfrac{\sum x_{1}}{N} = \dfrac{400}{10} = 40 $$
Mean deviation $$ = \dfrac{\sum |x_{1} - \bar{x}}{N} = \dfrac{84}{10} = 8.4$$
Find the mean deviation imaginary mean 35 for following distribution.
$$ 35, 25, 33, 50, 37, 33, 37, 30 $$
If value of all value terms of a series are same, then find value of dispersion
Find median of the following variables values
25,34,33,13,20,26,36, 28,19,34
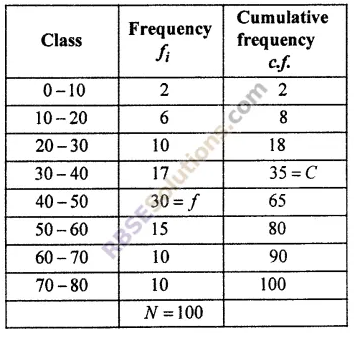
Find median from the following frequency distribution
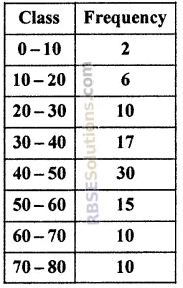
Cumulative frequency just above 50 is 65 whose corresponding class-interval is 40 - 50.
Thus, median class = 40 - 50
$$\because$$ I = 40, f = 30, C = 35, h = 10
Median $$= l + \frac{(\frac{N}{2} - C)}{f} \times h$$
$$= 40 + (\frac{50 - 35}{30}) \times 10 = 40 + \frac{150}{30}$$
$$= 40 + 5 = 45$$
Thus, median class = 45
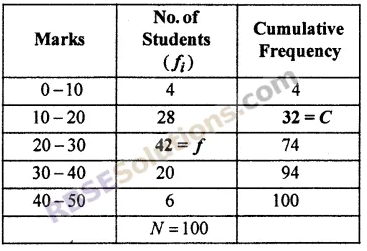
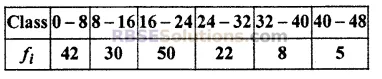
Marks obtained by student of a class are given in the frequency distribution table. Find their median.
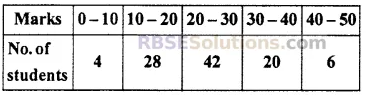
Here $$\frac{N}{2} = \frac{100}{2} = 50$$
Cumulative frequency just above 50 is 74 whose corresponding class-interval is 20 - 30.
Thus, median class = 20 - 30
$$\because$$ I = 20, f = 42, C = 32, h = 10
Median $$= l + \frac{(\frac{N}{2} - C)}{f} \times h$$
$$= 20 + (\frac{50 - 32}{42}) \times 10 = 20 + \frac{180}{42}$$
$$= 20 + 4.29 = 24.29$$
Thus, median class = 24.29
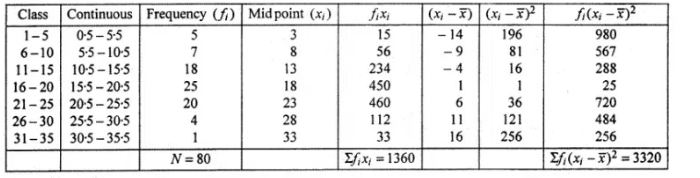
Find the mean and standard deviation of the following frequency distribution by step deviation method.
| Class | 1-5 | 6-10 | 11-15 | 16-20 | 21-25 | 26-30 | 31-35 |
| Frequency | 5 | 7 | 18 | 25 | 20 | 4 | 1 |
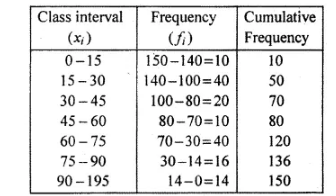
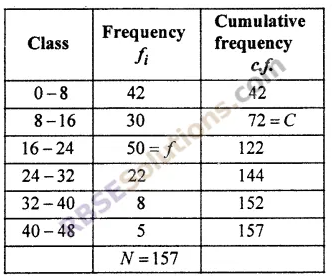
Find median from the frequency distribution table
Cumulative frequency just above 78.5 is 122 whose corresponding class-interval is 16 - 24.
Thus, median class = 16 - 24
$$\because$$ I = 16, f = 50, C = 72, h = 8
Median $$= l + \frac{(\frac{N}{2} - C)}{f} \times h$$
$$= 16 + (\frac{78.5 - 72}{50}) \times 8 = 16 + \frac{6.5 \times 8}{50}$$
$$= 16 + \frac{52}{50} = 16 + 1.04 = 17.04$$
Thus, median class = 17.04
Find the mean deviation about mode and its coefficient from the following data-
| Central size | 6 | 7 | 8 | 9 | 10 | 11 | 12 |
| Frequency | 3 | 6 | 9 | 13 | 8 | 5 | 4 |
$$\therefore $$mode (z) = 9
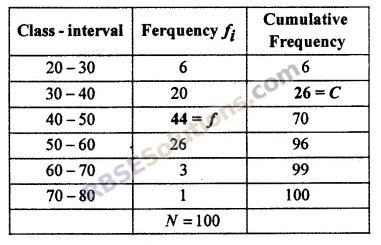
Marks obtained by 100 students are given in the table. Find their median.
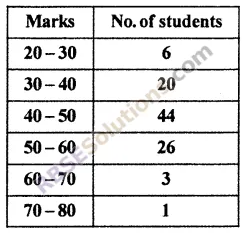
Here $$\frac{N}{2} = 50$$
Cumulative frequency just above 50 is 70 whose corresponding class-interval is 40 - 50.
Thus, median class = 40 - 50
$$\because$$ I = 40, f = 44, C = 26, h = 10
Median $$= l + \frac{(\frac{N}{2} - C)}{f} \times h$$
$$= 40 + (\frac{50 - 26}{44}) \times 10 = 40 + \frac{240}{44}$$
$$= 40 + 5.45 = 45.45$$
Find the formula to find standard deviation in individual series
Find the median of the data
19, 25, 59, 48, 35, 31, 30, 32, 51.
If 25 is replaces by 52 then find new median.
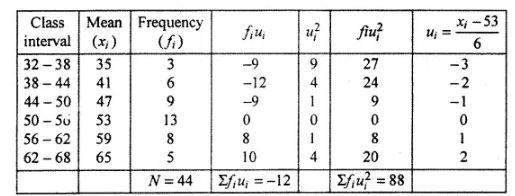
Find the dispersion of the following data centred size -
| Central size | 32--38 | 38-44 | 44-50 | 50-56 | 56-62 | 62-68 |
| No. of student | 3 | 6 | 9 | 13 | 8 | 5 |
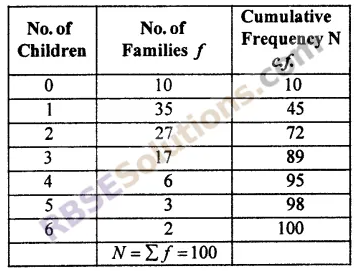
Number of children in 100 families are shown in the table.
Find their median.
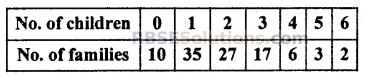
C.F. just above 50 is 72 whose corresponding variable value is 2.
$$\therefore$$ Required median = 2
Find mode of the following distribution:
| Class | 0 - 10 | 10 - 20 | 20 - 30 | 30 - 40 | 40 - 50 |
| Frequency | 4 | 7 | 13 | 9 | 3 |
Write importance of median.
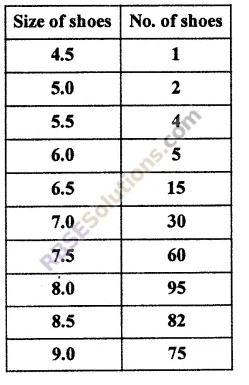
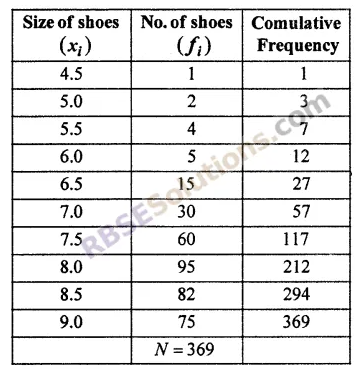
Cumulative frequency just above 184.5 is 212 whose corresponding is variable value is 8.0
Thus, median = 8.0
Find mode of the following distribution:
| Class | 0 - 20 | 20 - 40 | 40 - 60 | 60 - 80 | 80 - 100 |
| Frequency | 3 | 15 | 24 | 8 | 5 |
| x | 0.1 | 0.2 | 0.3 | 0.4 | 0.5 | 0.6 | 0.7 |
| f | 30 | 60 | 20 | 40 | 10 | 50 | 35 |
Cumulative frequency just above 122.5 is 150 whose corresponding is variable value is 0.4
Thus, median = 0.4
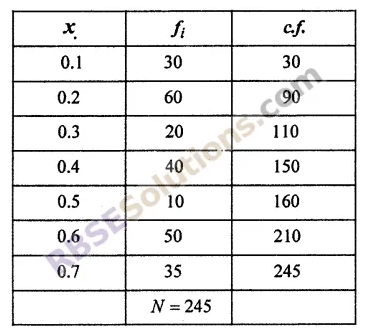
Find the median of the frequency distribution:
Write the formula to find median by grouped frequency distribution.
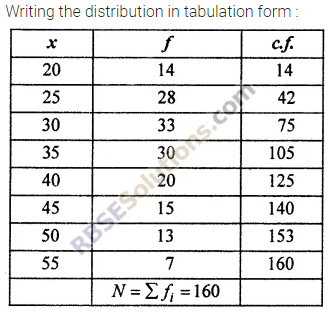
Marks obtained by students in a class are given in the table. Find median
$$\frac{N}{2} = \frac{99}{2} = 49.5$$
C.F. just above 49.5 is 52 whose corresponding variable value is 30.
$$\therefore$$ Required median = 30
Find mode of the following frequency distribution
| Class | Frequency |
| 10 - 15 | 3 |
| 15 - 20 | 7 |
| 20 - 25 | 16 |
| 25 - 30 | 12 |
| 30 - 35 | 9 |
| 35 - 40 | 5 |
| 40 - 45 | 3 |
Find mode of the following data :
| Class-interval | 0-20 | 20-40 | 40-60 | 60-80 | 80-100 | 100-120 | 120-140 |
| Frequency | 6 | 8 | 10 | 12 | 6 | 5 | 3 |
Following data represents life period observations of electrical instruments.
| Life period (in hrs) | 0-20 | 20-40 | 40-60 | 60-80 | 80-100 | 100-120 |
| Frequency | 100 | 35 | 52 | 61 | 38 | 29 |
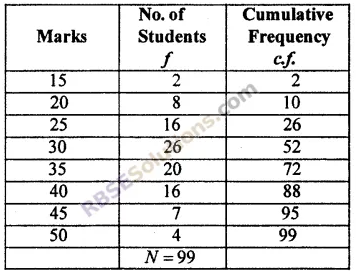
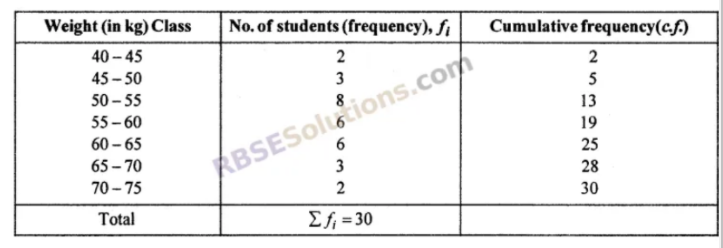
Following distribution represents weight of 30 students in a class. Find median weight of students.
| Weight (in kg) | 40-45 | 45-50 | 50-55 | 55-60 | 60-65 | 65-70 | 70-75 |
| No. of students | 2 | 3 | 8 | 6 | 6 | 3 | 2 |
$$ \therefore $$ median class = 55 - 60
$$ \therefore l = 55, \frac{N}{2} = 15, C = 13, f = 6 \;and \;h = 5 $$
$$ \displaystyle Median = l + \left( \frac{\frac{N}{2}-C}{f} \right ) \times h = 55 + \left ( \frac{15 - 13}{6} \right ) \times 5 $$
$$ 55 + \frac{2}{6} \times 5 = 55 + \frac{5}{3} = 55 + 1.67 = 56.67 kg (approx) $$
Thus, median weight of students = 56.67 kg (approx)
If median of 17, 26, 60, 45, 33 is 33 and if 17 is replaced by 27 then what will be new median?
Find mode of the following frequency distribution
| Height (in cm) | 52 - 55 | 55 - 58 | 58 - 61 | 61 - 64 |
| No. of students | 10 | 20 | 25 | 10 |
Find mode of the following frequency distribution
| Marks | 20 - 30 | 30 - 40 | 40 - 50 | 50 - 60 | 60 - 70 |
| No. of students | 4 | 28 | 42 | 20 | 6 |
Find mode of the following data :
| Class-interval | Frequency |
| 80-85 | 33 |
| 85-90 | 27 |
| 90-95 | 85 |
| 95-100 | 155 |
| 100-105 | 110 |
| 105-110 | 45 |
| 110-115 | 15 |
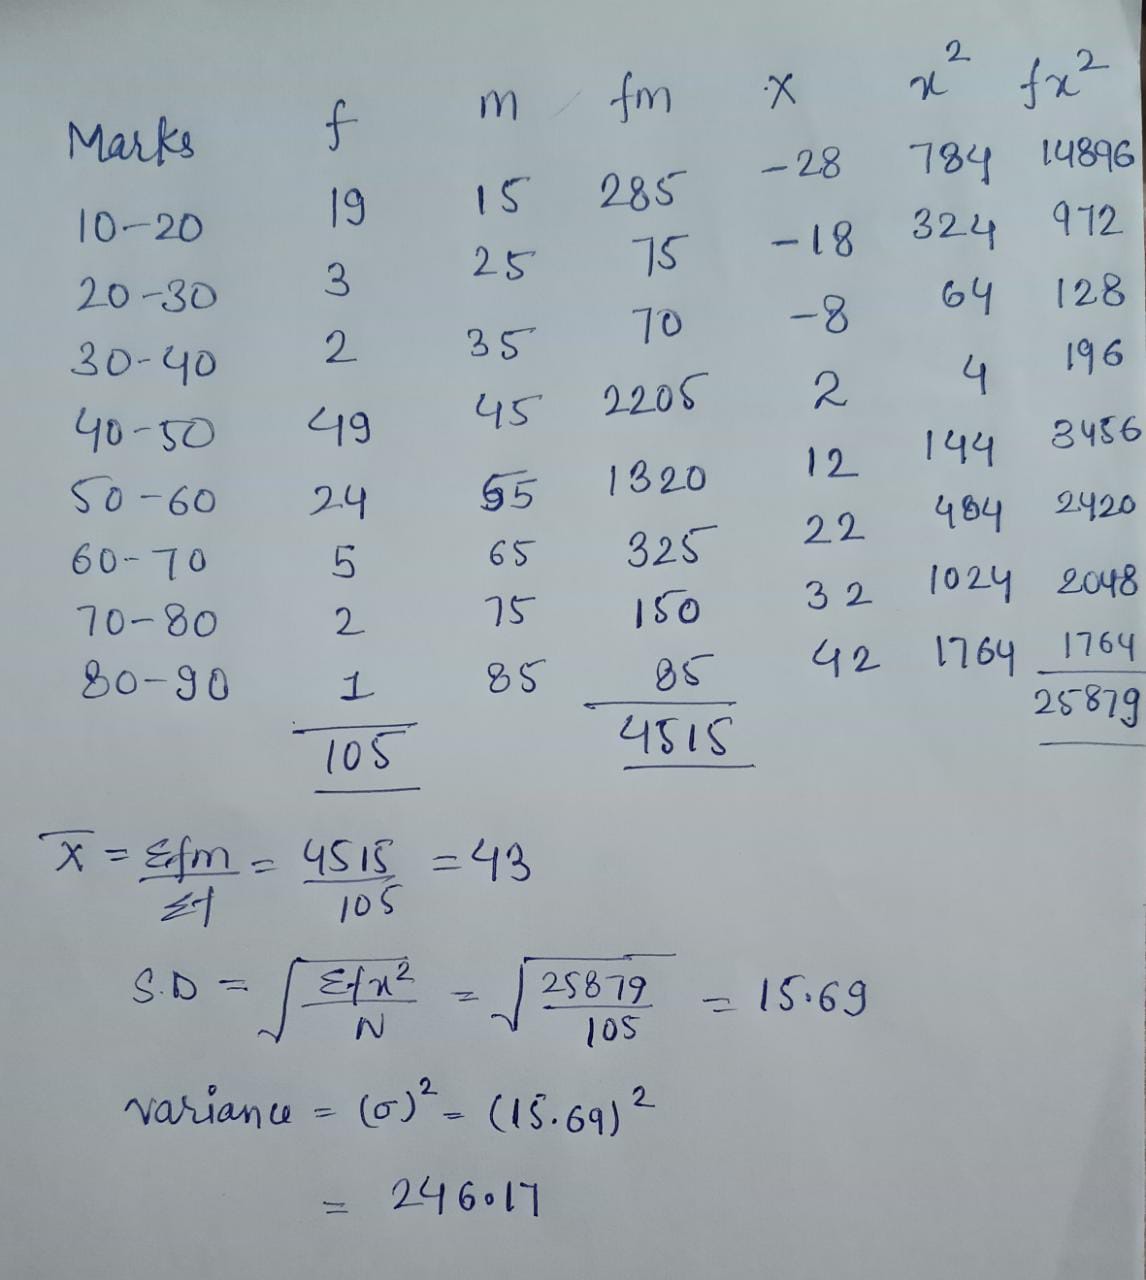
From the following data calculate standard deviation and its variability-
| Marks | 10-20 | 20-30 | 30-40 | 40-50 | 50-60 | 60-70 | 70-80 | 80-90 |
| Students | 19 | 3 | 2 | 49 | 24 | 5 | 2 | 1 |
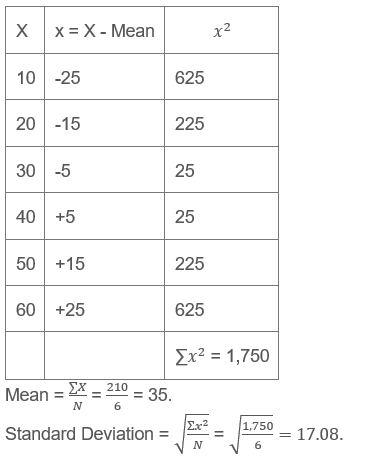
Calculate standard deviation of the following:
| X | 10 | 20 | 30 | 40 | 50 | 60 |
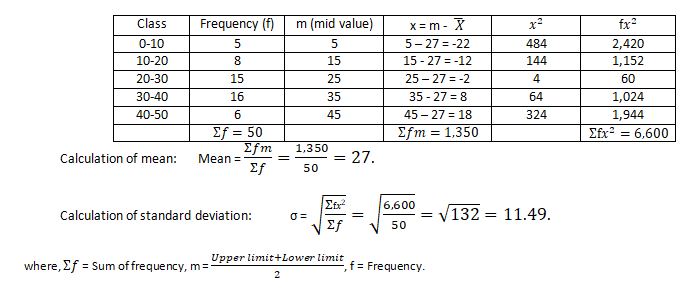
Find the standard deviation for the following distribution:
Class
Frequency (f)
0-10
5
10-20
8
20-30
15
30-40
16
40-50
6
|
Class |
Frequency (f) |
|
0-10 |
5 |
|
10-20 |
8 |
|
20-30 |
15 |
|
30-40 |
16 |
|
40-50 |
6 |
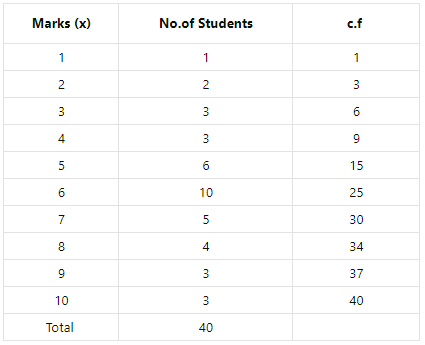
In a class of $$40$$ students, marks obtained by the students in a class test (out of $$10$$) are given below.
| Marks | 1 | 2 | 3 | 4 | 5 | 6 | 7 | 8 | 9 | 10 |
| Number of students | 1 | 2 | 3 | 3 | 6 | 10 | 5 | 4 | 3 | 3 |
Median
Marks corresponding to cumulative frequency $$20$$ is $$6$$
Thus, the required median is $$6$$
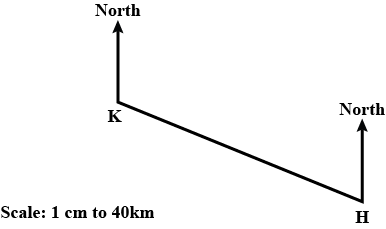
The Patel family flies from their home town, H, to Kiruna , K , in Lapland.
The Patel family has six suitcases.
The number of items in each suitcase is shown below.
$$15 $$ $$16$$ $$16$$ $$18$$ $$19$$ $$21$$
Write down the mode.

The Patel family flies from their home town, H, to Kiruna , K , in Lapland.
The Patel family has six suitcases.
The number of items in each suitcase is shown below.
$$15 $$ $$16$$ $$16$$ $$18$$ $$19$$ $$21$$
Work out the median.
The numbers $$42, 43, 44, 44, (2x + 3), 45, 45, 46, 47$$ have been put in the ascending order. If the median is $$45$$, find $$x$$. Hence, find the mode of the above data.
In a class of $$40$$ students, marks obtained by the students in a class test (out of $$10$$) are given below.
| Marks | 1 | 2 | 3 | 4 | 5 | 6 | 7 | 8 | 9 | 10 |
| Number of students | 1 | 2 | 3 | 3 | 6 | 10 | 5 | 4 | 3 | 3 |
Mode
Clearly, $$6$$ occurs $$10$$ times which is maximum.
Hence, mode is $$6$$.

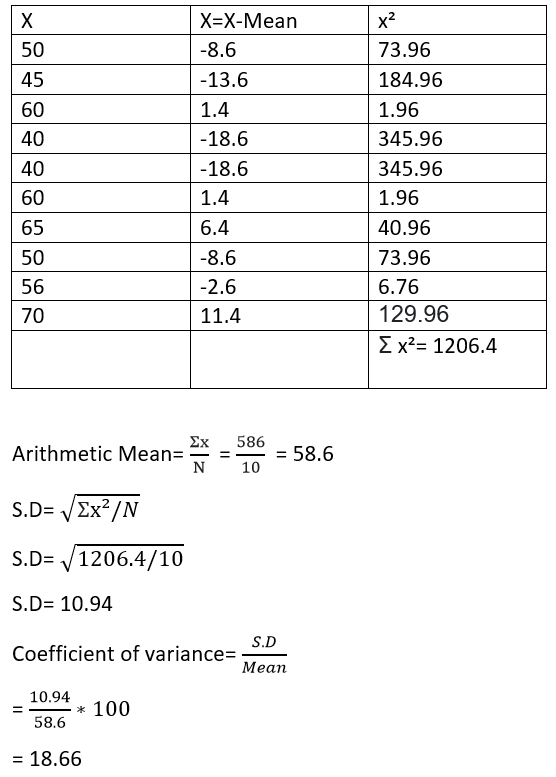
Find SD and Coefficient of variation.
| Roll No. | 1 | 2 | 3 | 4 | 5 | 6 | 7 | 8 | 9 | 10 |
| Marks | 50 | 45 | 60 | 40 | 40 | 60 | 65 | 50 | 56 | 70 |
Calculate the coefficient of variation:
Class | Frequency |
0-10 | 5 |
10-20 | 8 |
20-30 | 10 |
30-40 | 15 |
40-50 | 12 |

Which measure of dispersion is the best and how?
Find the coefficient of variation from the following data:
|
Class |
Frequency |
|
10-20 |
4 |
|
20-30 |
5 |
|
30-40 |
6 |
|
40-50 |
2 |
|
50-60 |
3 |

Calculate the standard deviation from the following data:
Class | Frequency (f) |
10-20 | 4 |
20-30 | 5 |
30-40 | 6 |
40-50 | 2 |
50-60 | 3 |

Define standard deviation and and formula.
A standard deviation is a statistic that measures the dispersion of a dataset relative to its mean.

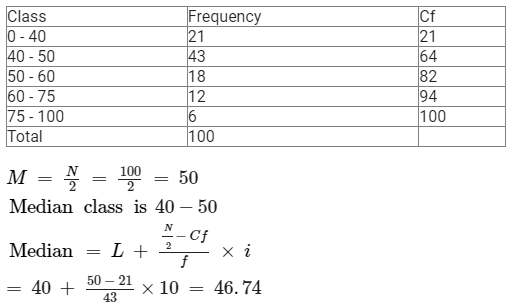
In a certain examination, there were 100 candidates of whom 21 failed, 6 secured distinction, 12 were placed in the first division, 43 were placed in the third division and 18 in the second division. It is known that at least 75% marks are required for distinction, 40% for passing, 50% for second division and 60% for first division calculate median.
Calculate the standard deviation:
Class | Frequency |
0-10 | 5 |
10-20 | 8 |
20-30 | 10 |
30-40 | 15 |
40-50 | 12 |

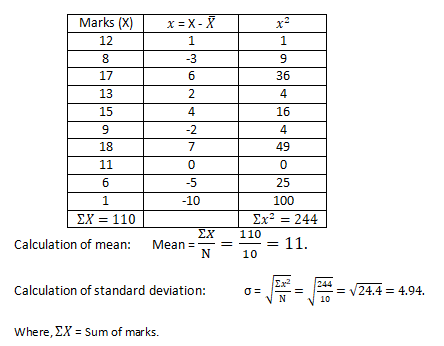
Following are the marks obtained by 10 students of a class. Calculate standard deviation and coefficient of standard deviation. Marks 12, 8, 17, 13, 15, 9, 18, 11, 6, 1.
Fill in the blank:_________________ is the value of variance when the standard deviation of a given series is 2.5.
Calculate the coefficient of variation using assumed mean method from the following information:
Weeks | COVID Patients (‘000) |
0-4 | 600 |
4-8 | 400 |
8-12 | 250 |
12-16 | 200 |
16-20 | 300 |
20-24 | 350 |
24-28 | 450 |
28-32 | 500 |
32-36 | 750 |
36-40 | 900 |

Calculate coefficient of variation from the following data:
Marks | No. Of students |
0-20 | 8 |
20-40 | 12 |
40-60 | 30 |
60-80 | 20 |
80-100 | 10 |

The number of books bought at a book fair by $$200$$ students from a school are given in the following table:
| No. of Books | $$0$$ | $$1$$ | $$2$$ | $$3$$ | $$4$$ |
| No. of Students | $$35$$ | $$64$$ | $$68$$ | $$18$$ | $$15$$ |
Calculate the standard deviation of the following data :
| $$x$$ | 3 | 8 | 13 | 18 | 23 |
| $$f$$ | 7 | 10 | 15 | 10 | 8 |
Calculate the standard deviation of the following data
| $$x$$ | $$3$$ | $$8$$ | $$13$$ | $$17$$ | $$23$$ |
| $$f$$ | $$7$$ | $$10$$ | $$15$$ | $$10$$ | $$8$$ |
Let $$a, b, c, d$$ and $$e$$ be the observations with mean $$ { m }$$ and standard deviation $$S$$. The standard deviation of the observations a $$+ { k } ,b+ { k } ,c+ { k } , d+ { k }$$ and $$e+ { k }$$ is
Standard deviation of two distribution are same and their arithmetic means are 30 and 25 respectively. If their coefficient of variation is $${ v }_{ 1 }$$ and$${ v }_{ 2 }$$, then $$6{ v }_{ 1 }-{ 5v }_{ 2 }$$ is equal to ___________________.
Find the standard deviation of 10 observations 111, 211, 311,...... 1011.
The following table gives the daily wages of workers in a factory. Compute the standard deviation and the coefficient of variation of the wages of the workers.
| Wages (Rs) | 125-175 | 175-225 | 225-275 | 275-325 | 325-375 | 375-425 | 425-475 | 475-525 | 525-575 |
| Number of workers | 2 | 22 | 19 | 14 | 3 | 4 | 6 | 1 | 1 |
Find the variance and standard devaiation of the following frequency distribution.
| $${ x }_{ i }$$ | 6 | 10 | 14 | 18 | 24 | 28 | 30 |
| $${ f }_{ i }$$ | 2 | 4 | 7 | 12 | 8 | 4 | 3 |
Find the standard deviation of the numbers $$62,58,53,50,63,52,55$$.
A random variable $$x$$ has the following probability distribution.
| $$x=x$$ | $$-2$$ | $$-1$$ | $$0$$ | $$1$$ | $$2$$ | $$3$$ |
| $$P(x)$$ | $$0.1$$ | $$k$$ | $$0.2$$ | $$2k$$ | $$0.3$$ | $$k$$ |
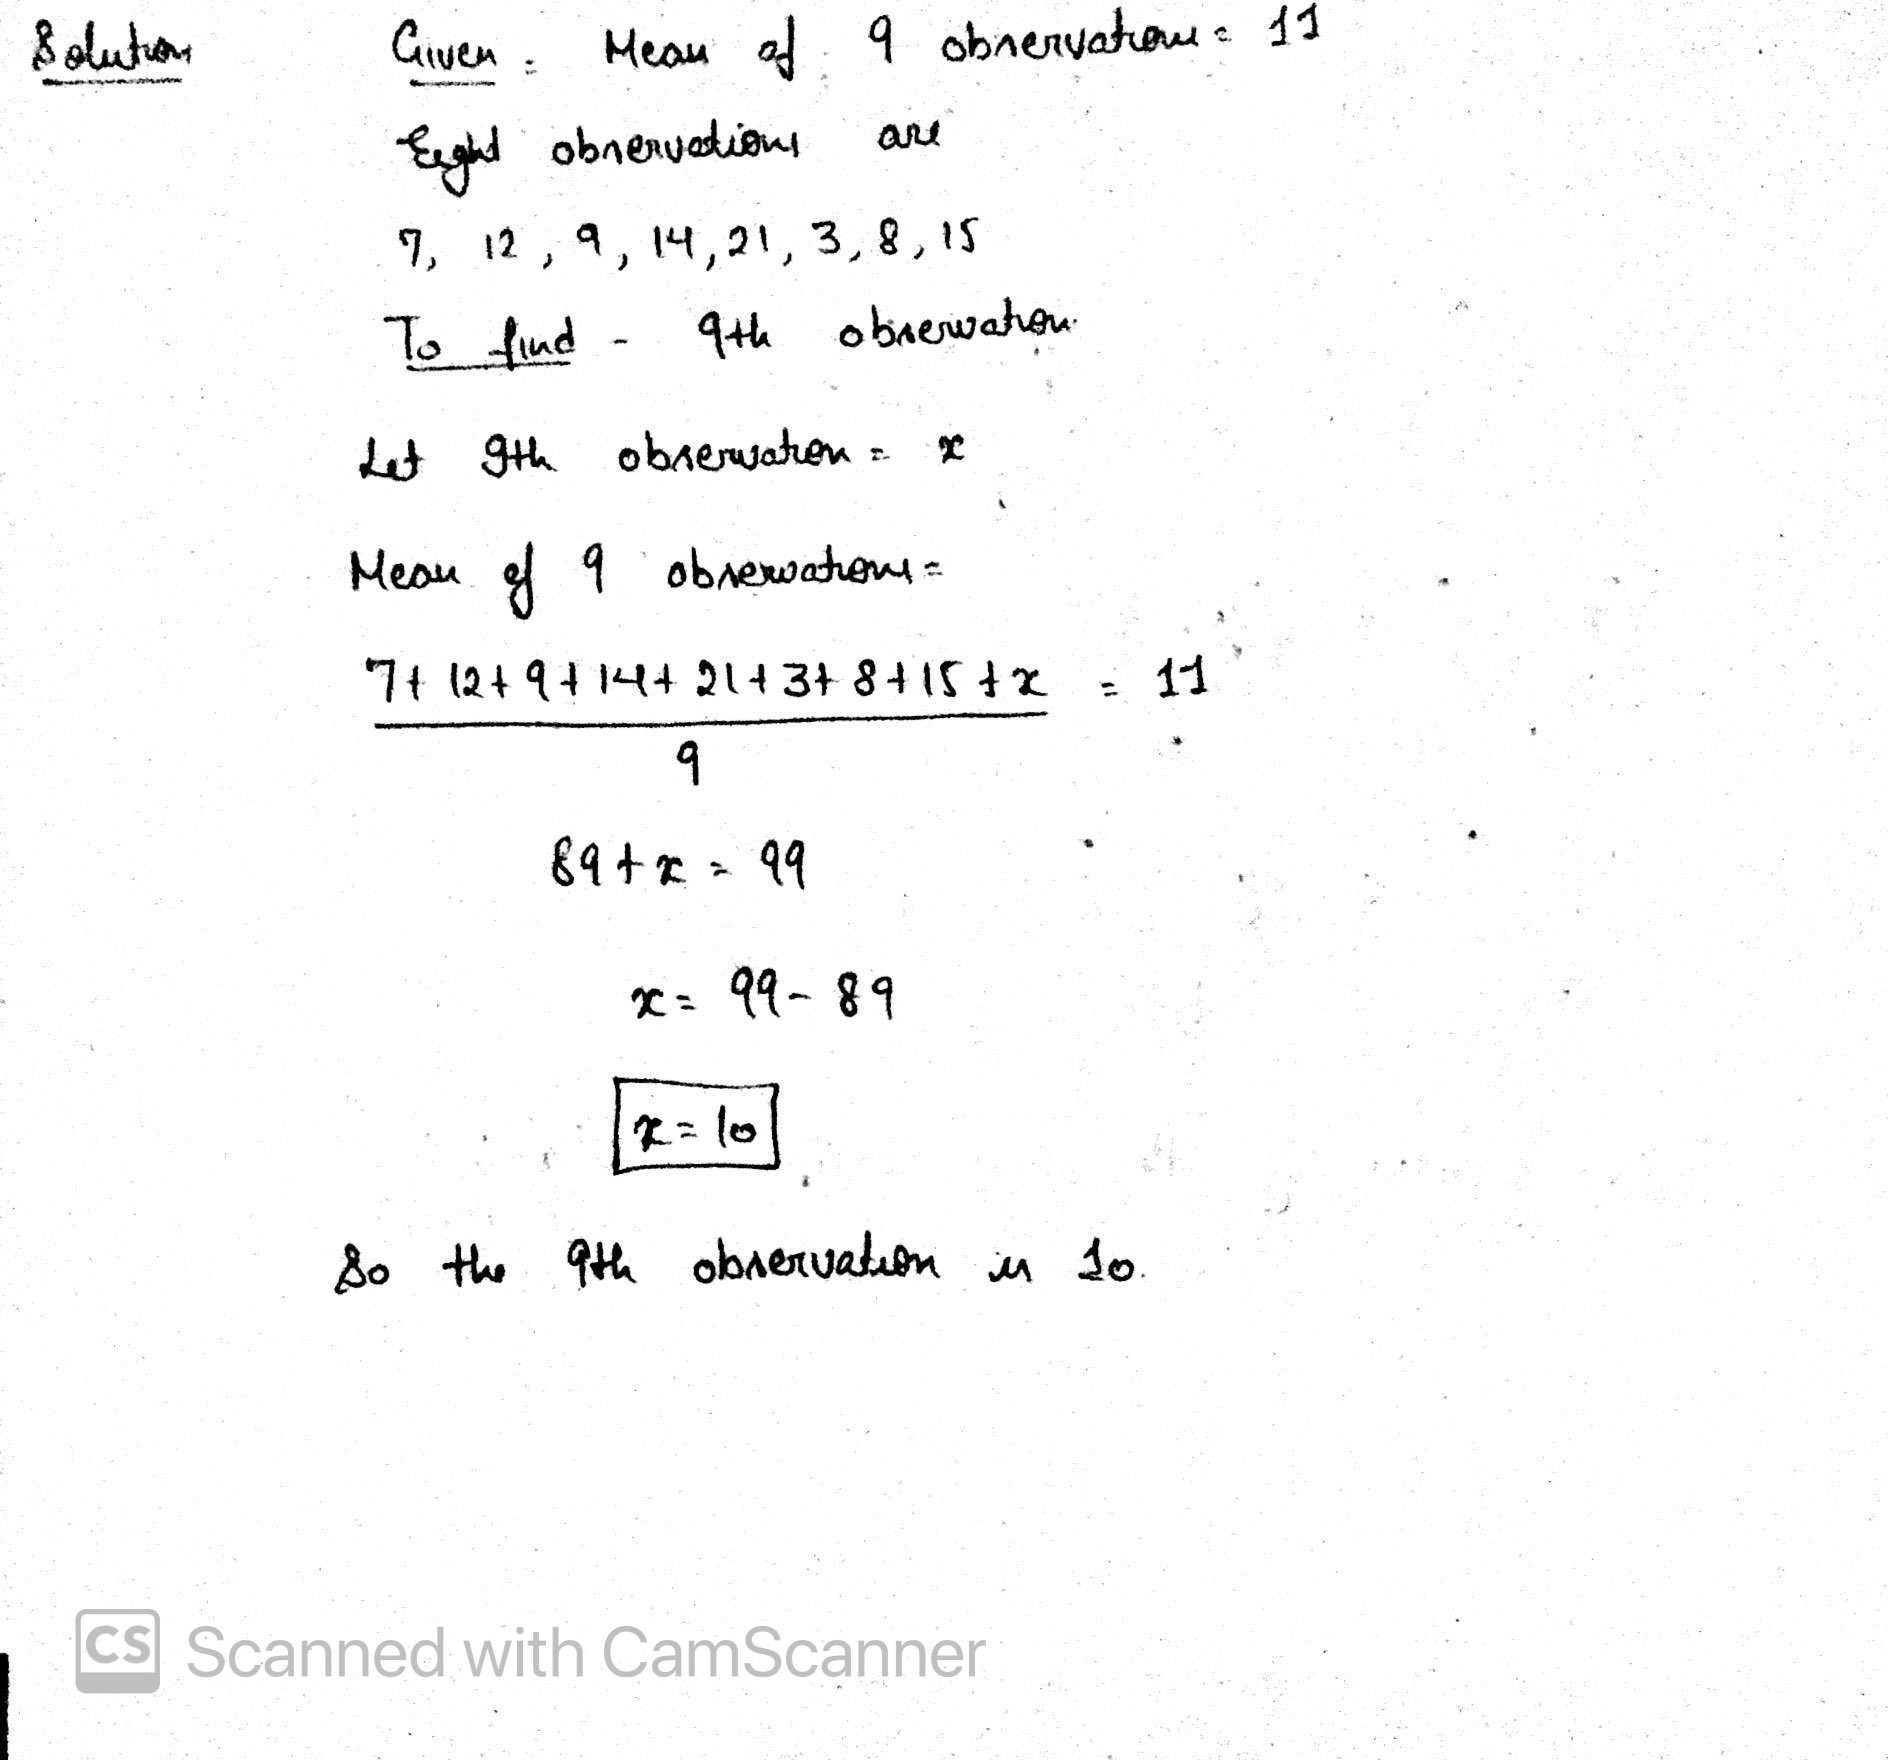
The mean of $$9$$ variates is $$11$$. If eight of them are $$7, 12, 9, 14, 21, 3, 8$$ and $$15$$, find the $$9th$$ variate.
Using short ad method.find the man, variance and standard deviation for the data:
| Class | 0-10 | 10-20 | 20-20 | 30-40 | 40-50 |
| Frequency | 5 | 8 | 15 | 16 | 6 |
Calculate standard deviation from the following data:
Marks (Less than)
Number of students
(f)
20
8
40
20
60
50
80
70
100
80
|
Marks (Less than) |
Number of students (f) |
|
20 |
8 |
|
40 |
20 |
|
60 |
50 |
|
80 |
70 |
|
100 |
80 |

Calculate coefficient of variation using step deviation method from the following information:
Class Interval | Frequency |
0-5 | 15 |
5-10 | 10 |
10-15 | 11 |
15-20 | 12 |
20-25 | 6 |
25-30 | 6 |
30-35 | 10 |
35-40 | 15 |
40-45 | 10 |
45-50 | 5 |

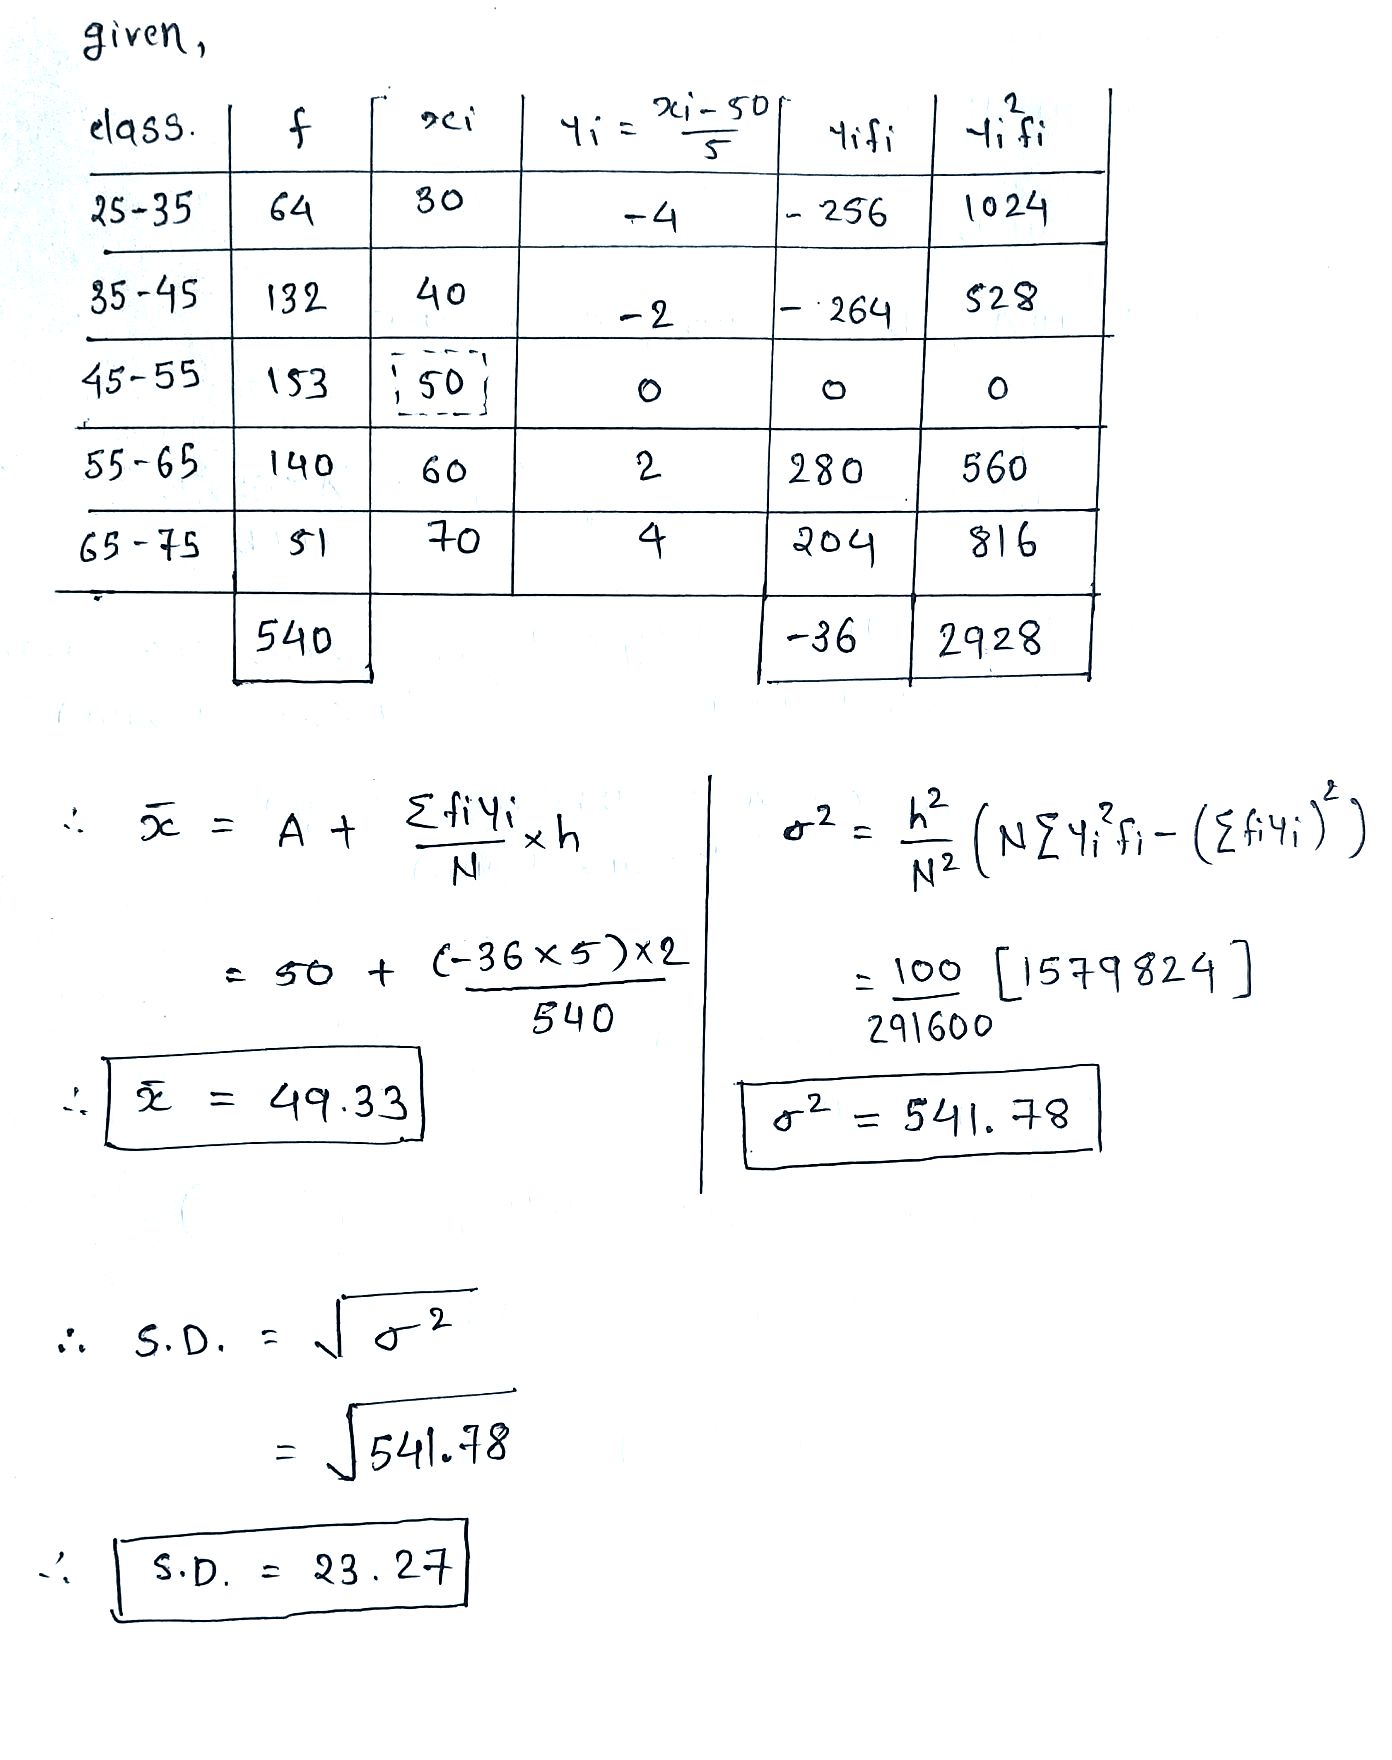
Using short ad method.find the mean, variance and standard deviation for the data:
| Class | 25-35 | 35-45 | 45-55 | 55-65 | 65-75 |
| Frequency | 64 | 132 | 153 | 140 | 51 |
Find the variance of the following data $$6, 8, 10, 12, 14, 16 , 18, 20, 22, 24$$.
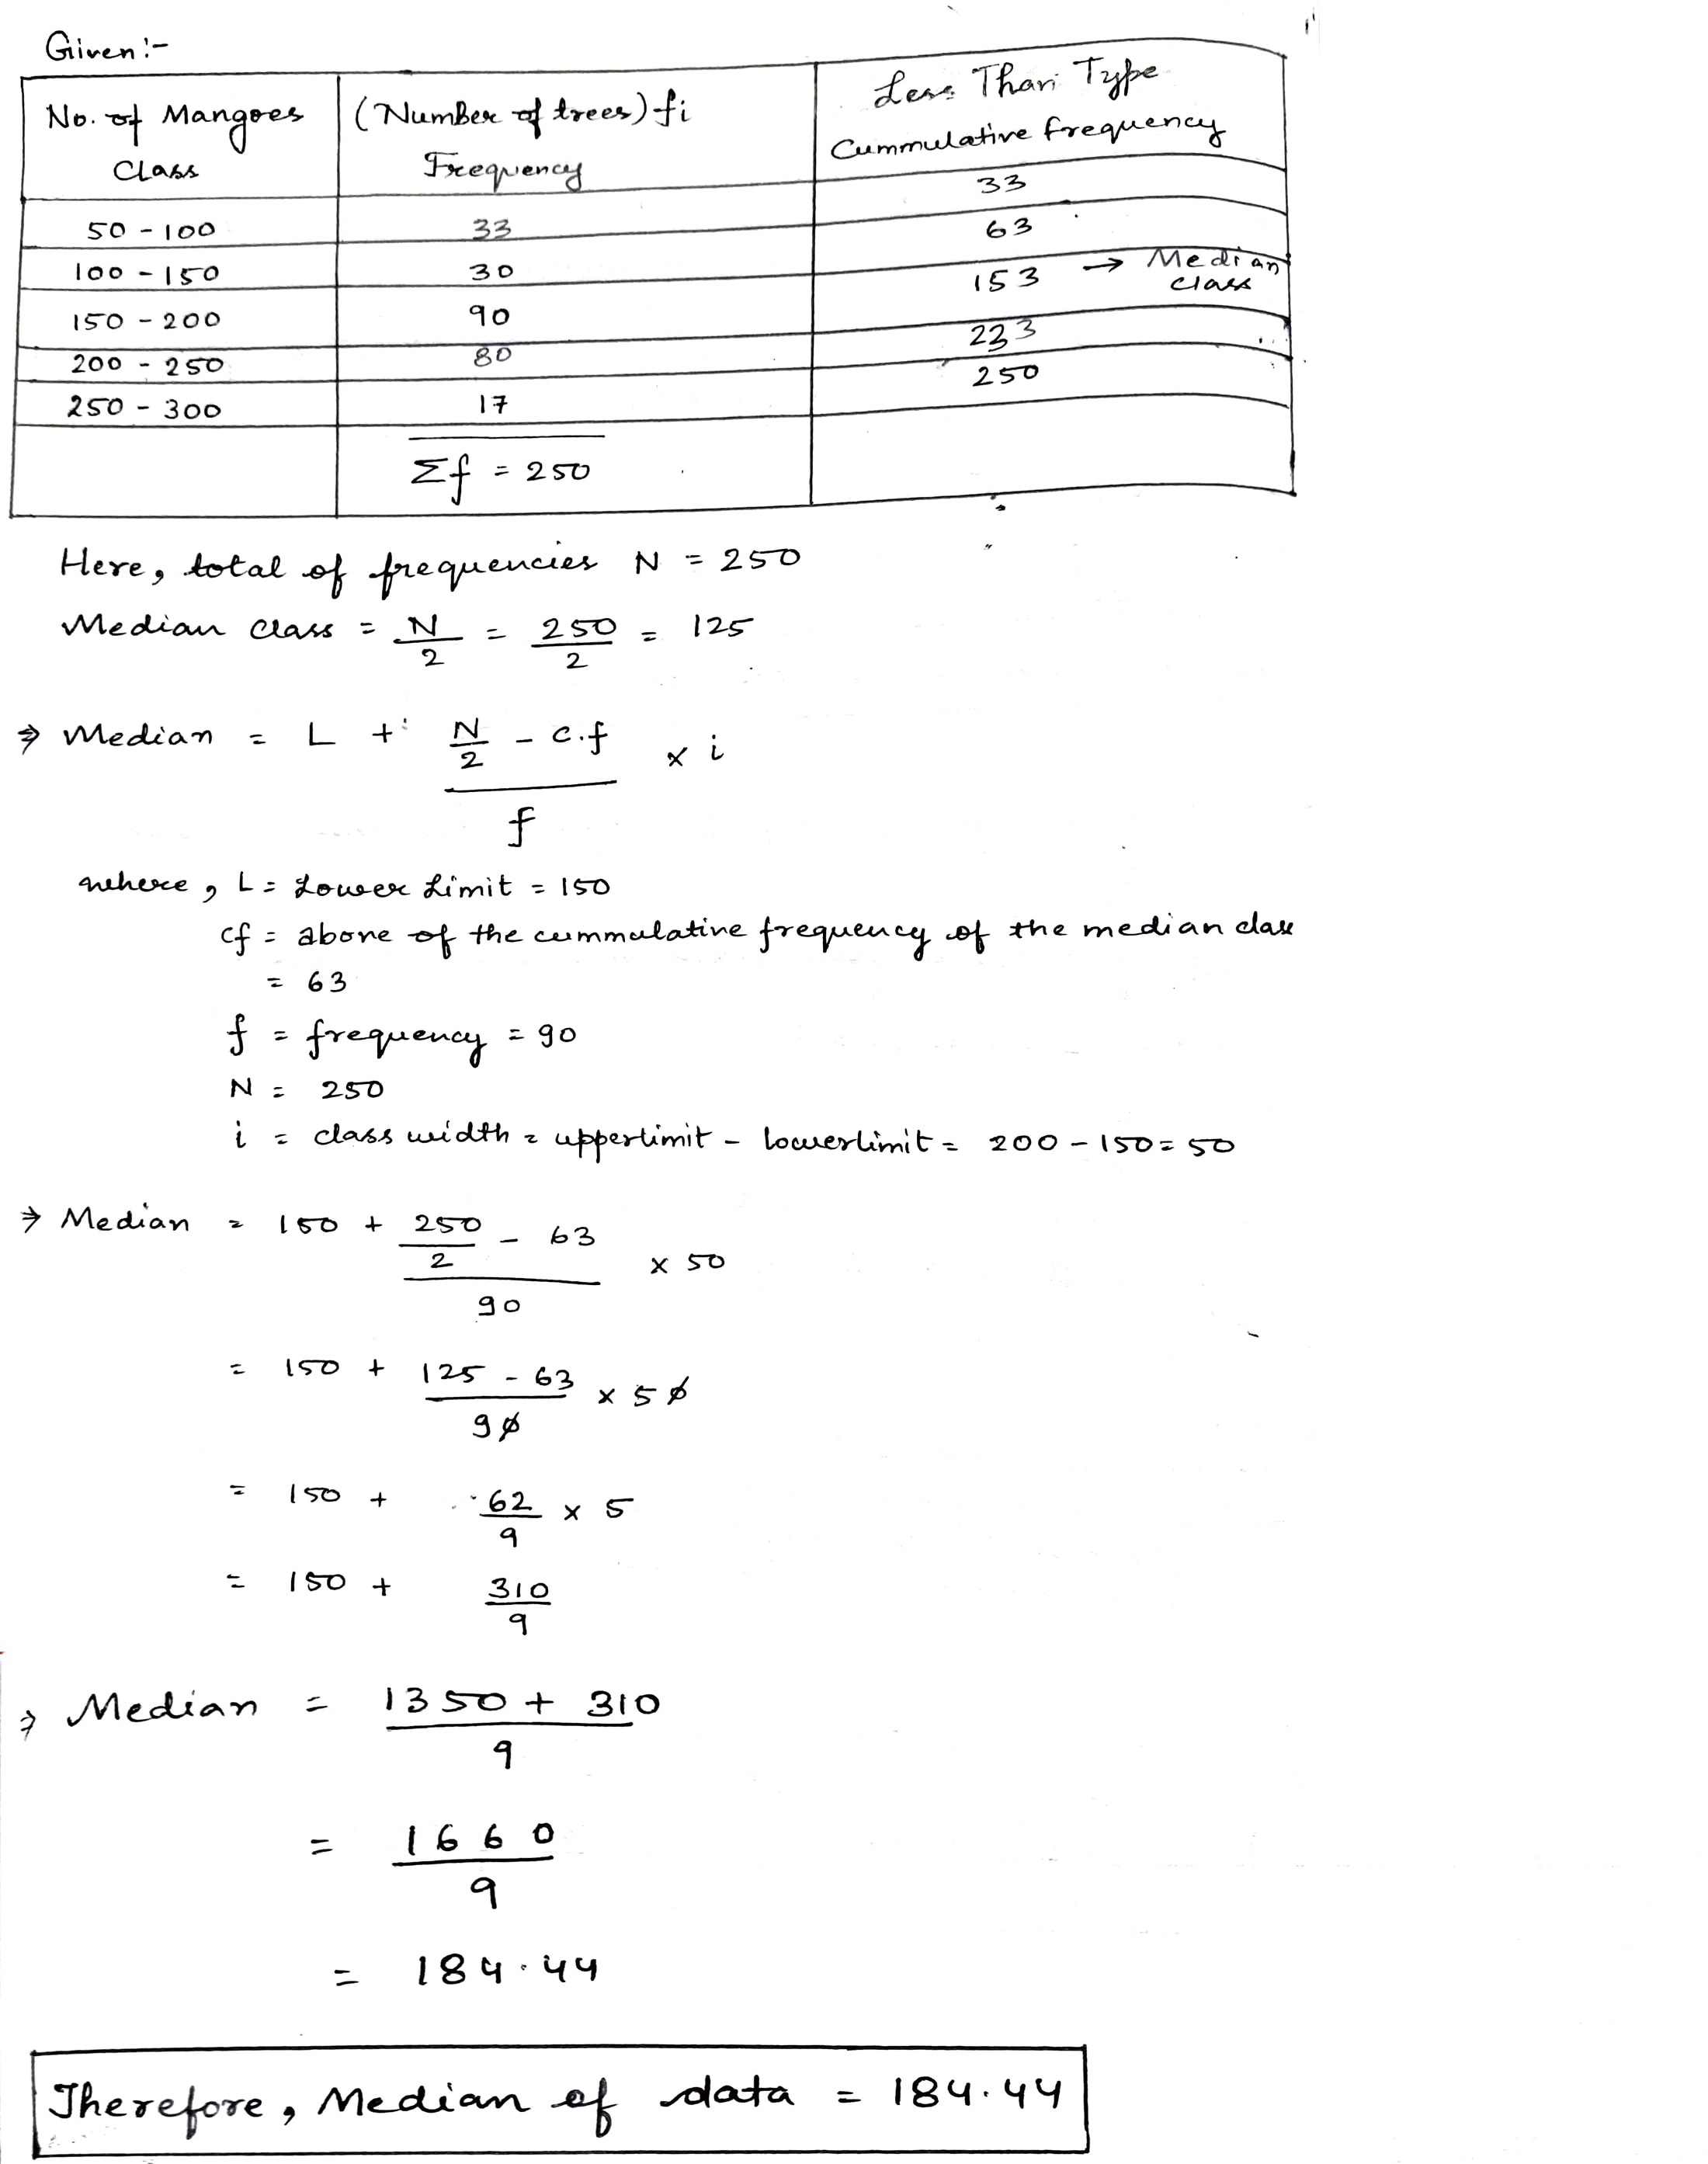
The frequency distribution table shows the number of mango trees in a groove and their yield of mangoes. Find the median of data.
| No. of Mangoes | 50 - 100 | 100 - 150 | 150 - 200 | 200 - 250 | 250 - 300 |
| No. of trees | 33 | 30 | 90 | 80 | 17 |
Find out standard deviation of the following data:
| Size | 1 | 2 | 3 | 4 | 5 | 6 | 7 | 8 |
| Frequency | 5 | 10 | 15 | 20 | 25 | 30 | 35 | 40 |
Find out standard deviation of the following data:
| Size | 4 | 6 | 8 | 10 | 12 | 14 | 16 |
| Frequency | 1 | 2 | 3 | 5 | 3 | 2 | 1 |
Class 11 Engineering Maths Extra Questions
- Binomial Theorem Extra Questions
- Complex Numbers And Quadratic Equations Extra Questions
- Conic Sections Extra Questions
- Introduction To Three Dimensional Geometry Extra Questions
- Limits And Derivatives Extra Questions
- Linear Inequalities Extra Questions
- Mathematical Reasoning Extra Questions
- Permutations And Combinations Extra Questions
- Principle Of Mathematical Induction Extra Questions
- Probability Extra Questions
- Relations And Functions Extra Questions
- Sequences And Series Extra Questions
- Sets Extra Questions
- Statistics Extra Questions
- Straight Lines Extra Questions
- Trigonometric Functions Extra Questions