Descriptive Statistics - Class 11 Commerce Applied Mathematics - Extra Questions
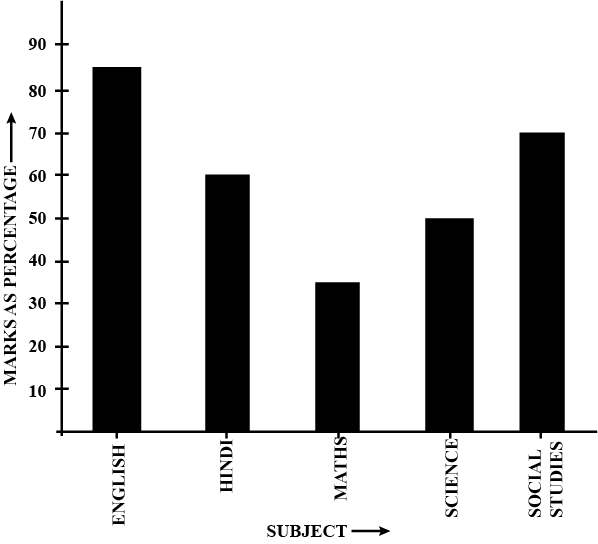
The percentage of marks obtained, in different subjects by Ashok Sharma (in an examination) are given below. Draw a bar graph to represent it.
| English | Hindi | Maths | Science | Social Studies |
| $$85$$ | $$60$$ | $$35$$ | $$50$$ | $$70$$ |
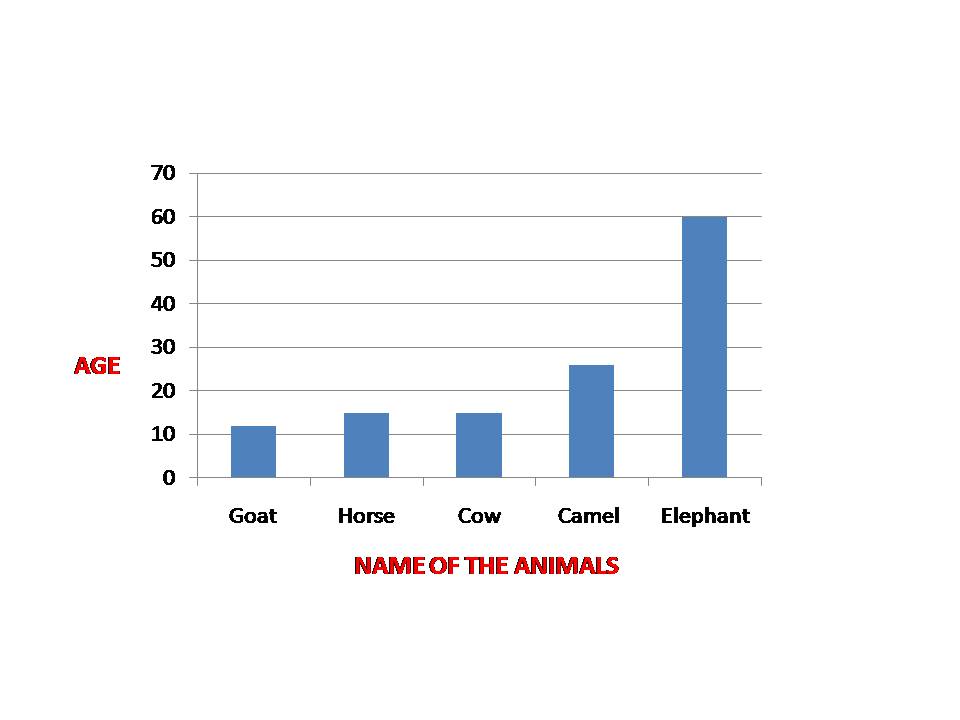
Draw a bar-graph (chart) to represent the following data:
| Name of the animals | Goat | Horse | Cow | Camel | Elephant |
| Age (in years) | $$12$$ | $$15$$ | $$15$$ | $$26$$ | $$60$$ |
Find the quartile deviation of 6, 12,14, 16, 18, 20 and 24.
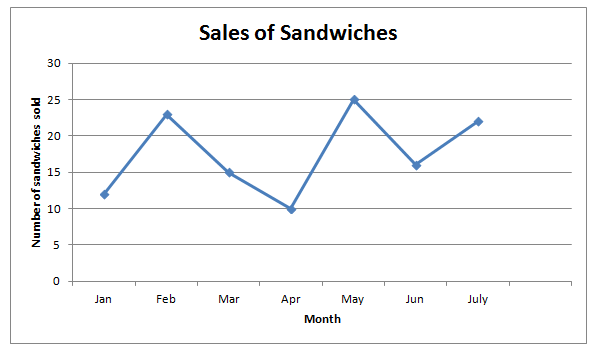
| Months | Jan | Feb | Mar | Apr | May | Jun | Jul |
| Number of sandwiches sold | 12 | 23 | 15 | 10 | 25 | 16 | 22 |
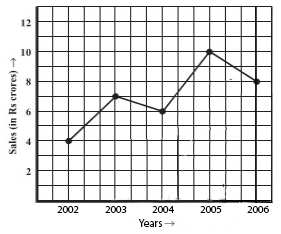
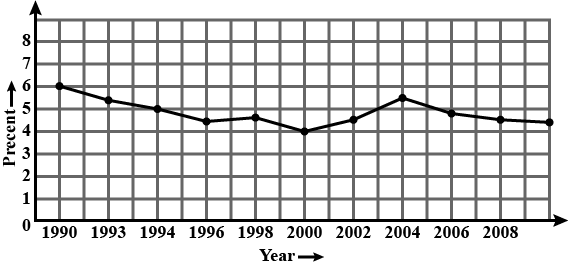
The following line graph shows the yearly sales figures for a manufacturing company.
(a) What were the sales in (i) $$2002$$ (ii) $$2006$$?
(b) What were the sales in (i) $$2003$$ (ii) $$2005$$?
(c) Compute the difference between the sales in $$2002$$ and $$2006$$.
(d) In which year was there the greatest difference between the sales as compared to its previous year?
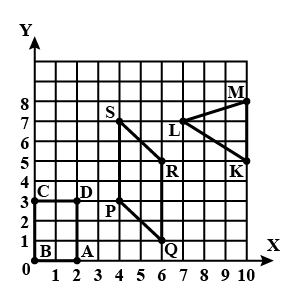
Write the coordinates of the vertices of each of these adjoining figures.
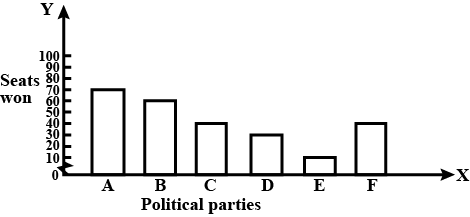
Given below are the seats won by different political parties in the polling outcome of a state assembly elections:
| Political Party | A | B | C | D | E | F |
| Seats Won | 75 | 55 | 37 | 29 | 10 | 37 |
(ii) Which political party won the maximum number of seats?
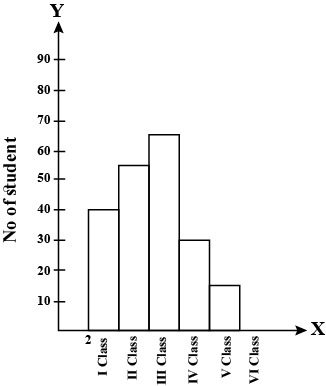
Identify the scale used on the axes of the adjacent graph. Write the frequency distribution from it
Find the median and quartile deviation for the following data.
| $$x$$ | $$3$$ | $$4$$ | $$5$$ | $$6$$ | $$7$$ |
| $$f$$ | $$12$$ | $$35$$ | $$52$$ | $$41$$ | $$18$$ |
The marks scored by $$6$$ students in a preparatory exam are given here:
$$56, 71, 49, 90,88$$.
Find the median score and semi-quartile range
The coefficient of variations of two series are $$58$$ and $$69$$. Their standard deviations are $$21.2$$ and $$15.6$$. What are their arithmetic means?
If the point $$(3, 4)$$ lies on the graph of the equation $$3y=ax+7$$, fine the values.
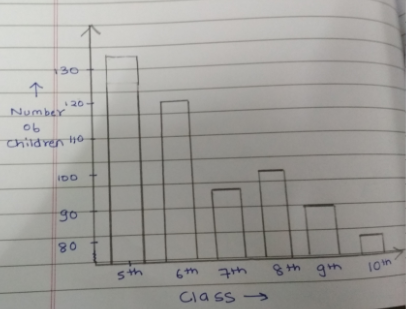
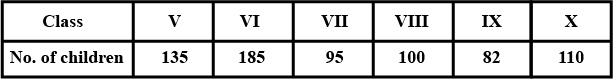
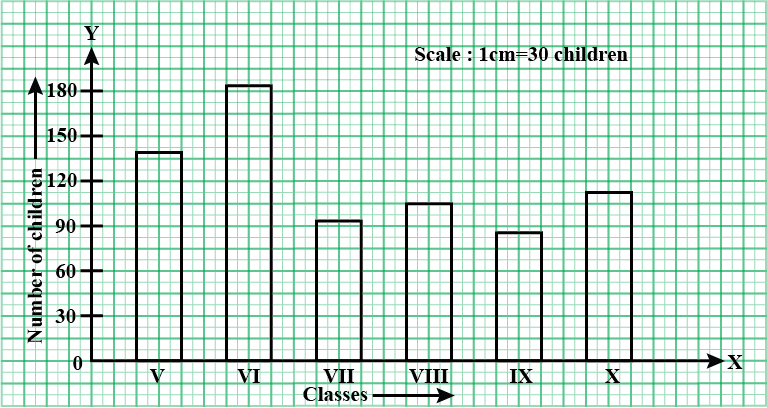
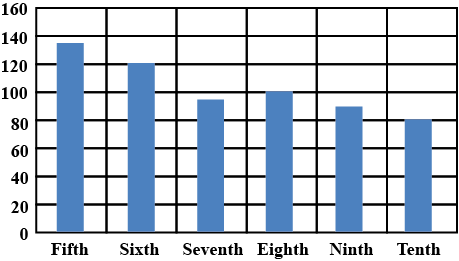
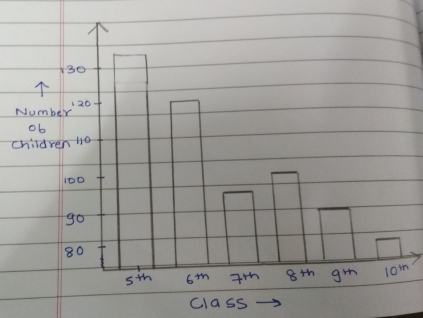
Number of children in six different classes are given. Represent the data on a bar graph.
| Class | Fifth | Sixth | Seventh | Eighth | Ninth | Tenth |
| Number of children | $$135$$ | $$120$$ | $$95$$ | $$100$$ | $$90$$ | $$80$$ |
Find the ratio of students of class sixth to the students of class eight.
Read the graph and answer the following questions.
How many buses are manufactured in the first $$6$$ months of the year?
What is the scale of the graph?
Is the number of bus manufacturing in the month of May $$200$$ more than the previous month?
Depict the information in a tabular form.
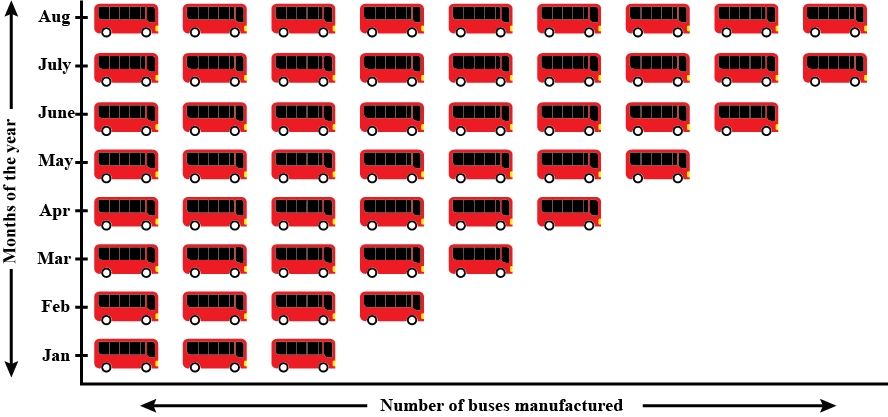
Now use the table form a pictograph.
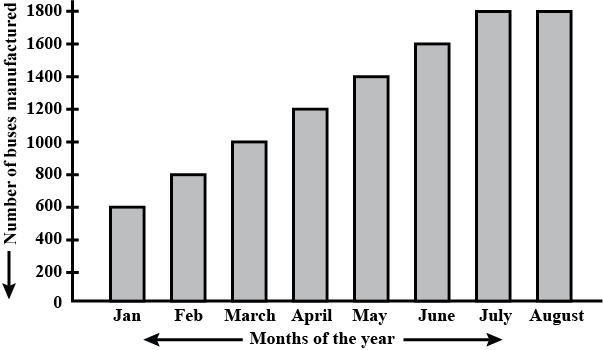
| Month of the year | Number of buses manufactured |
| January | $$600$$ |
| February | $$800$$ |
| March | $$1000$$ |
| April | $$1200$$ |
| May | $$1400$$ |
| June | $$1600$$ |
| July | $$1800$$ |
| August | $$1800$$ |
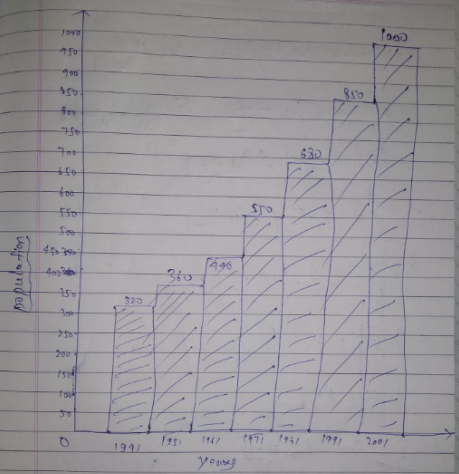
Draw a bar graph for the following data.
Population of India in successive census years:
| Year | 1941 | 1951 | 1961 | 1971 | 1981 | 1991 | 2001 |
| Population | 320 | 360 | 440 | 550 | 680 | 850 | 1000 |
Match the values of $$\varrho _{1},\varrho _{2},\varrho _{3}$$ for the following data values
$$13,14,7,12,17,8,10,6,15,18,21,20$$
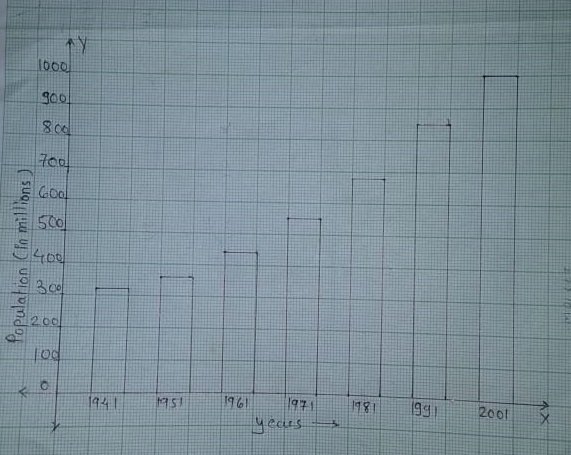
When the scale along the x-axis does not start at the origin, we show it by a kink (break or a zig - zag curve of the origin). What is a kink? Why it is used?
Draw a bar graph for the following data.
Population of India in successive census years.
| Year | $$1941$$ | $$1951$$ | $$1961$$ | $$1971$$ | $$1981$$ | $$1991$$ | $$2001$$ |
| Population (in millions)(approx.) | $$320$$ | $$360$$ | $$440$$ | $$550$$ | $$680$$ | $$850$$ | $$1000$$ |
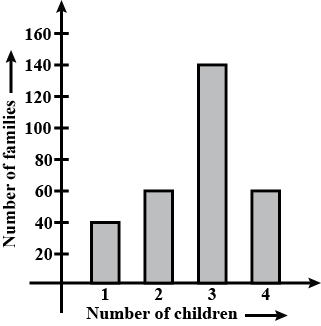
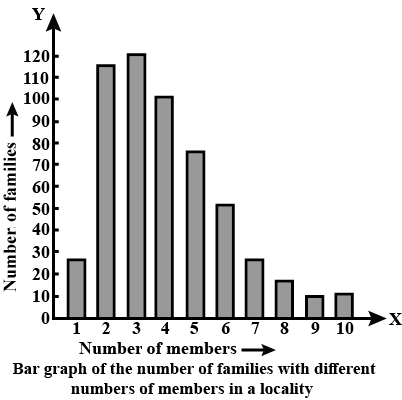
In a survey of $$300$$ families of a colony, the number of children in each family was recorded and the data has been represented by the bar graph, given:Read the graph carefully and answer the following questions:
What percentage of the families have $$4$$ children ?
The daily temperature recorded (in degree $$F$$) at a place during a week was as under:
| Monday | Tuesday | Wednesday | Thursday | Friday | Saturday |
| $$35.5$$ | $$30.8$$ | $$27.3$$ | $$32.1$$ | $$23.8$$ | $$29.9$$ |
Calculate the mean temperature.
In what ways is the bar graph better than pictography.
A number of children in six different classes are given below. Represent the data on the bar graph:
In a survey of $$300$$ families of a colony, the number of children in each family was recorded and the data has been represented by the bar graph, given:Read the graph carefully and answer the following questions:
How many family have no child?

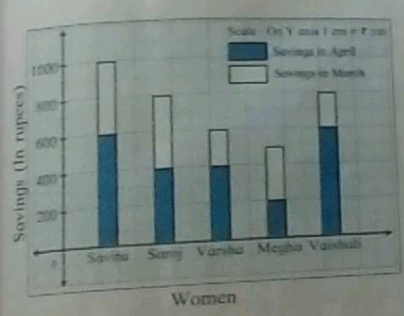
Whose savings in the month of April is the least?
In a survey of $$300$$ families of a colony, the number of children in each family was recorded and the data has been represented by the bar graph, given: Read the graph carefully and answer the following question: How many family have $$2$$ children each?

Were the two plants of the same height during any week shown here? specify.
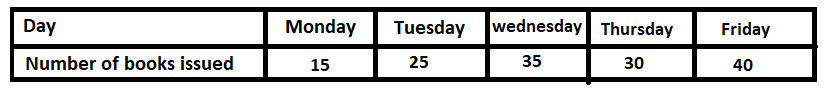
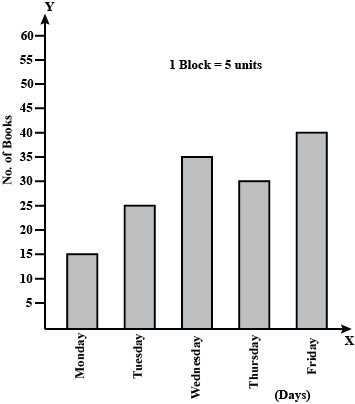
The number of books issued from a library in five days is given below. Represent the information in the form of a bar graph.
_______ displays data that changes continuously over periods of time.
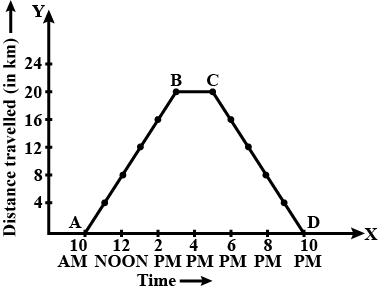
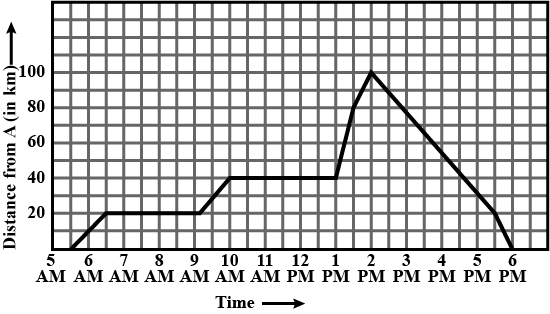
Study the graph given below of a person who stared from his home and returned at the end of the day. Answer the questions that follow.
At what time did the person start from his home?

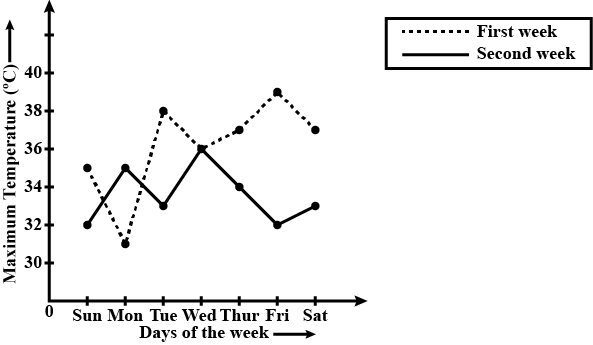
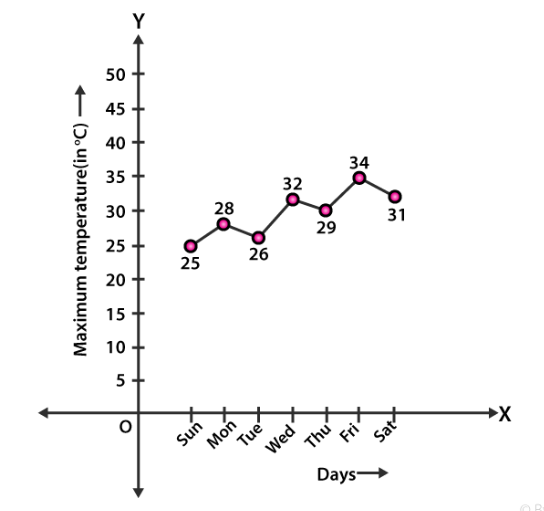
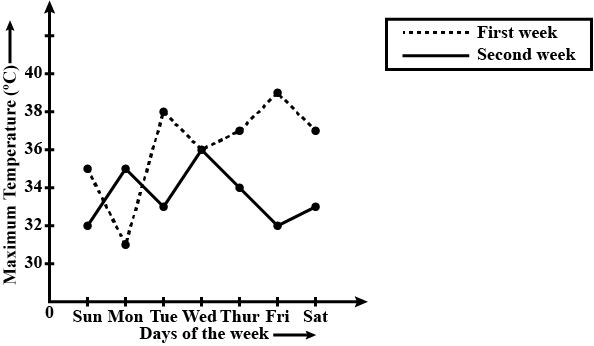
The graph shows the maximum temperatures recorded for two consecutive weeks of a town. Study the graph and answer the questions that follow.
On which day was the difference in temperatures the maximum for both the weeks?
Study the graph given below of a person who stared from his home and returned at the end of the day. Answer the questions that follow.
At what time did he cover $$16$$ km of his journey ?

The graph given below gives the actual and expected sales of cars of a company for $$6$$ months. Study the graph and answer the questions that follow.
What are the average sales of cars in the last three months?
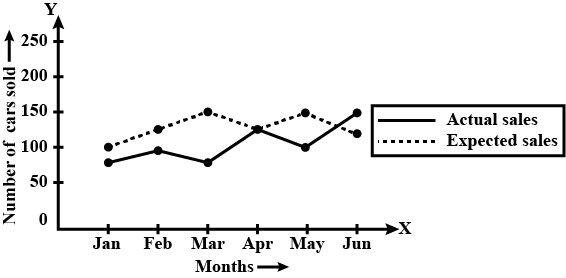
The graph given below gives the actual and expected sales of cars of a company for $$6$$ months. Study the graph and answer the questions that follow.
What was the total sale of cars in the months- Jan, Feb, and March?

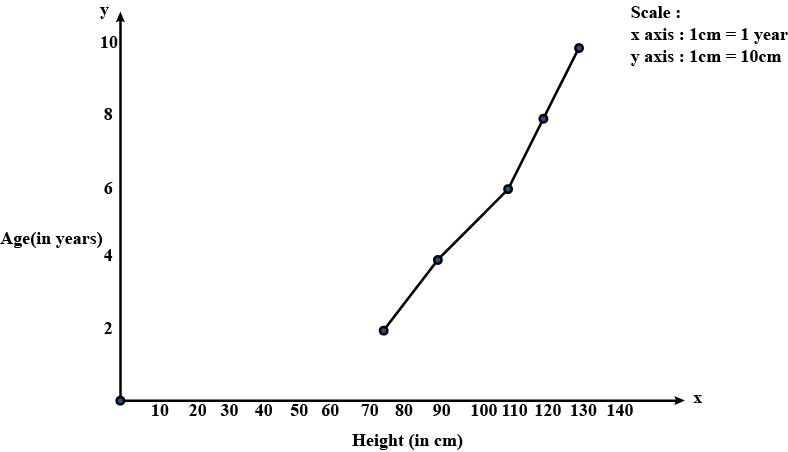
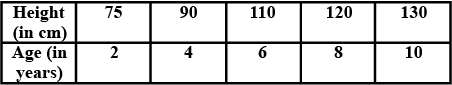
The following table gives the growth chart of a child.
Draw a line graph for the table and answer the questions that follow.
How much taller was the child at the age of 10 than at the age of $$6$$ ?

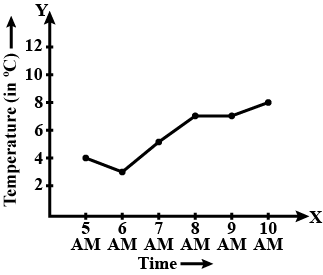
The table given below shows the temperatures recorded on a day at different times.
Observe the table and answer the following questions.
At what time is the temperature $$3^{o}$$ C?
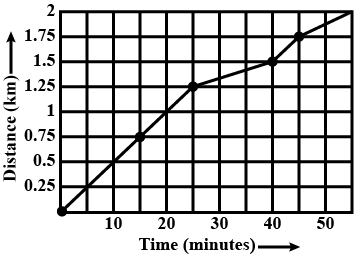
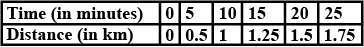
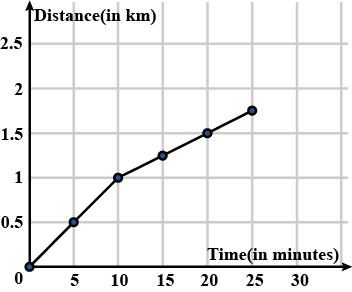
The following is the time-distance graph of Sneha's walking
Find her average speed in km/hour.
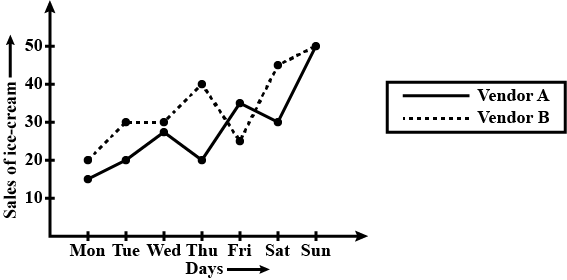
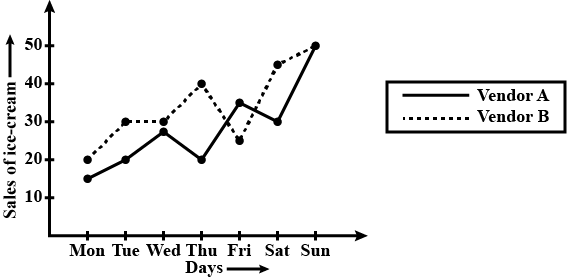
The graph given below compares the sales of ice creams of two vendors for a week.
Observe the graph and answer the following questions.
Which vendor has sold more ice cream on Friday?

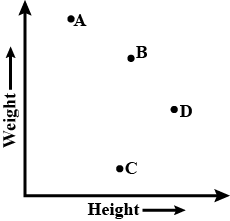
The points on the graph below represent the height and weight of the donkey, dog, crocodile, and ostrich shown in the drawing.
What are the two variables represented in the graph?
The graph given below compares the sales of ice creams of two vendors for a week.
Observe the graph and answer the following questions.
On which day was the difference in sales the maximum?
Study the graph given below of a person who stared from his home and returned at the end of the day. Answer the questions that follow.
At what time did he return home ?
The table given below shows the temperatures recorded on a day at different times.
Observe the table and answer the following questions.
What is the temperature a t$$8$$ am?

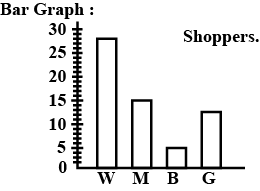
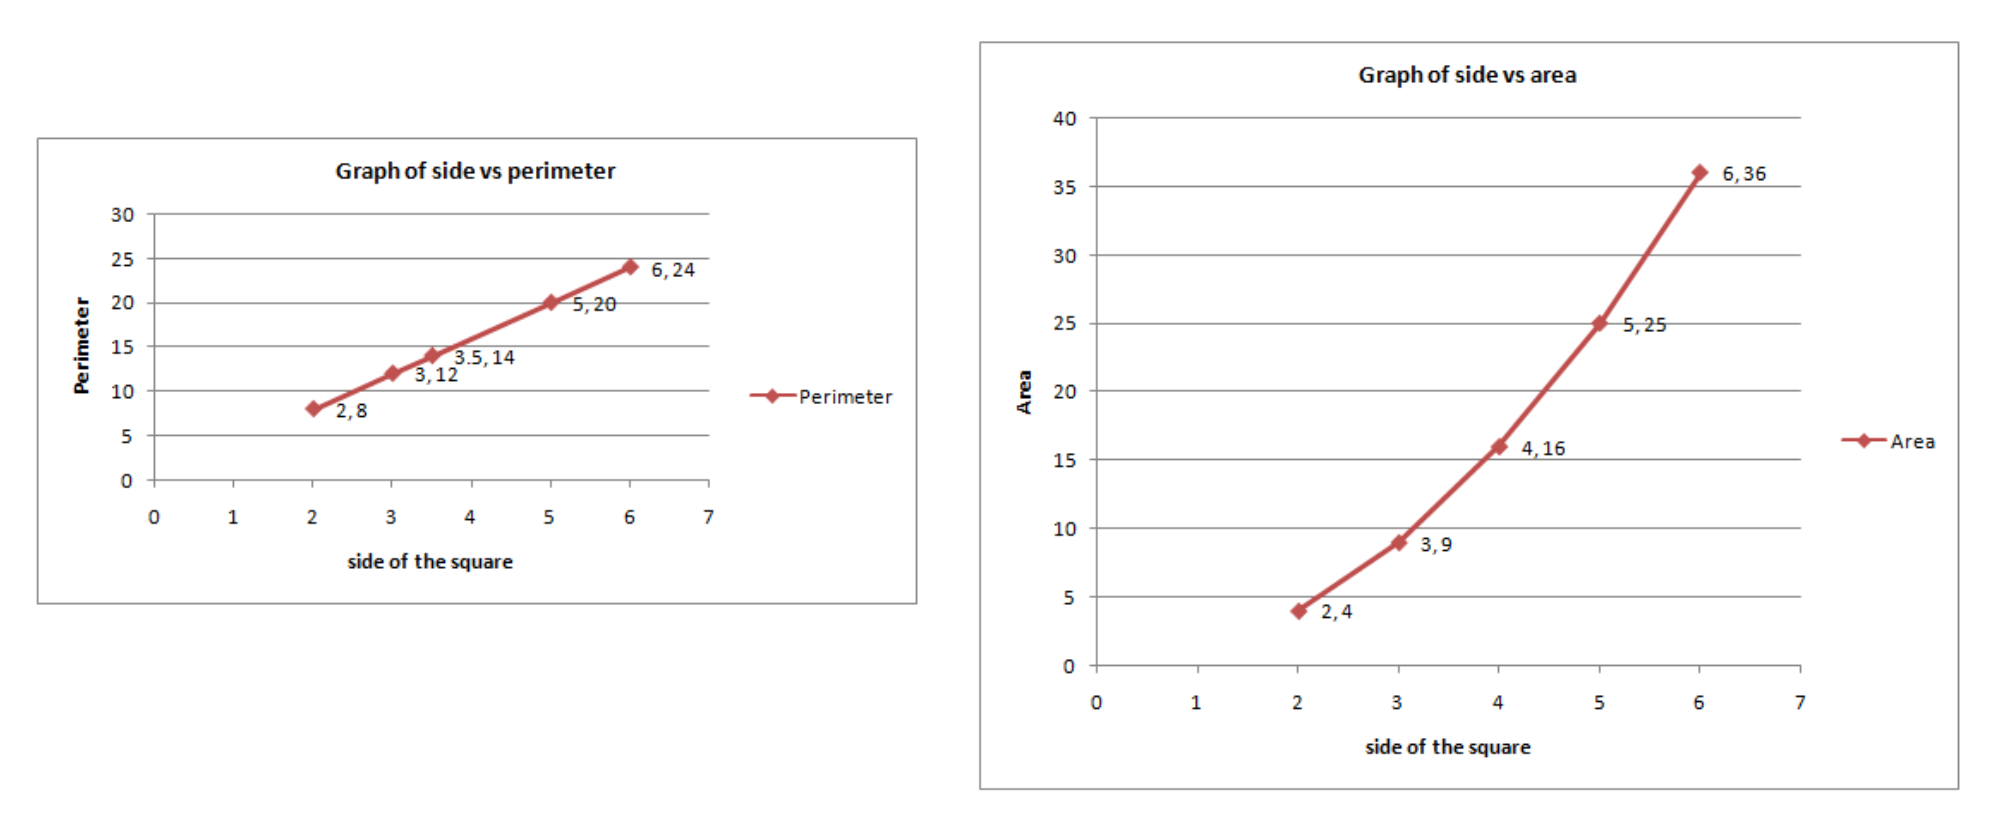
The shoppers who come to a departmental store are marked as: man $$(M)$$, woman $$(W)$$, boy $$(B)$$ or girl $$(G)$$. The following list gives the shoppers who came during the first hour in the morning:
$$W, W, W, G, B, W, W, M, G, G, M, M, W, W, W, W, G, B, M, W, B, G, G, M, W, W, M,$$$$M,W,W,W,M,W, B, W, G, M, W, W, W, W, G, W, M, M, W, W, M, W, G, W, M, G,$$$$W, M, M, B, G, G, W$$
Make a frequency distribution table using tally marks. Draw a bar graph to illustrate it.
Make a frequency distribution table using tally marks. Draw a bar graph to illustrate it.
| Shoppers | Tally Marks | Frequency |
| $$ W$$ | $$28$$ | |
| $$M$$ | $$15$$ | |
| $$B$$ | $$ 5$$ | |
| $$G$$ | $$ 12$$ |
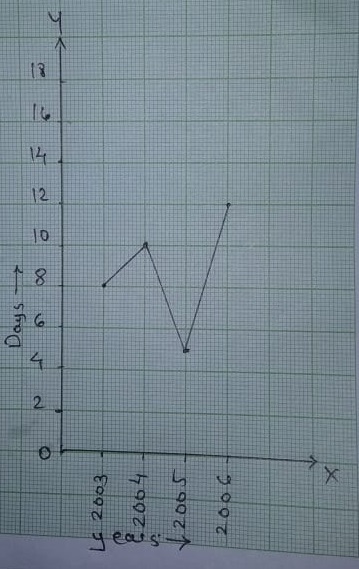
The number of days a hillside city received snow in different years.
| Year | $$2003$$ | $$2004$$ | $$2005$$ | $$2006$$ |
| Days | $$8$$ | $$10$$ | $$5$$ | $$12$$ |
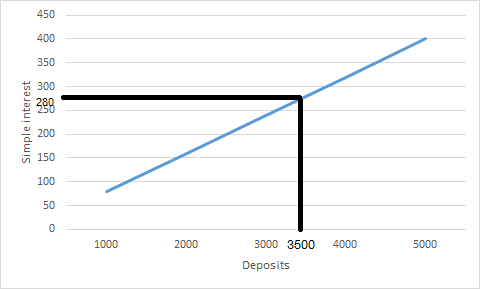
To get an interest of Rs. 280 per year,how much money should be deposited?
answer required
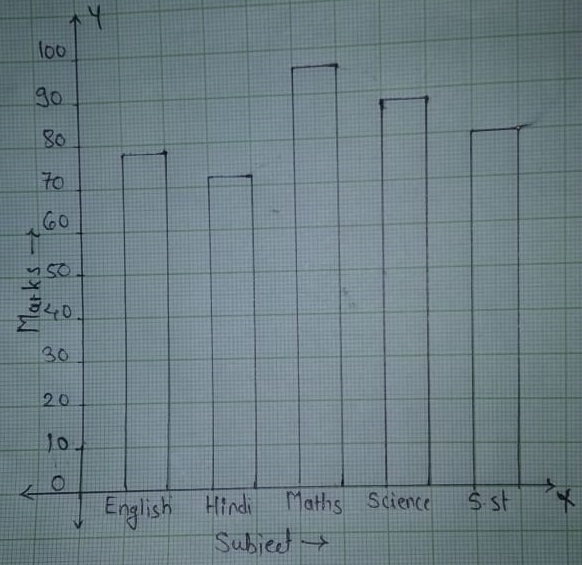
Given the marks scored by Rita's out of 100, in five subjects in a particular test.
| Subject | Marks |
| English | 78 |
| Hindi | 72 |
| Maths | 96 |
| Science | 88 |
| S.St | 80 |
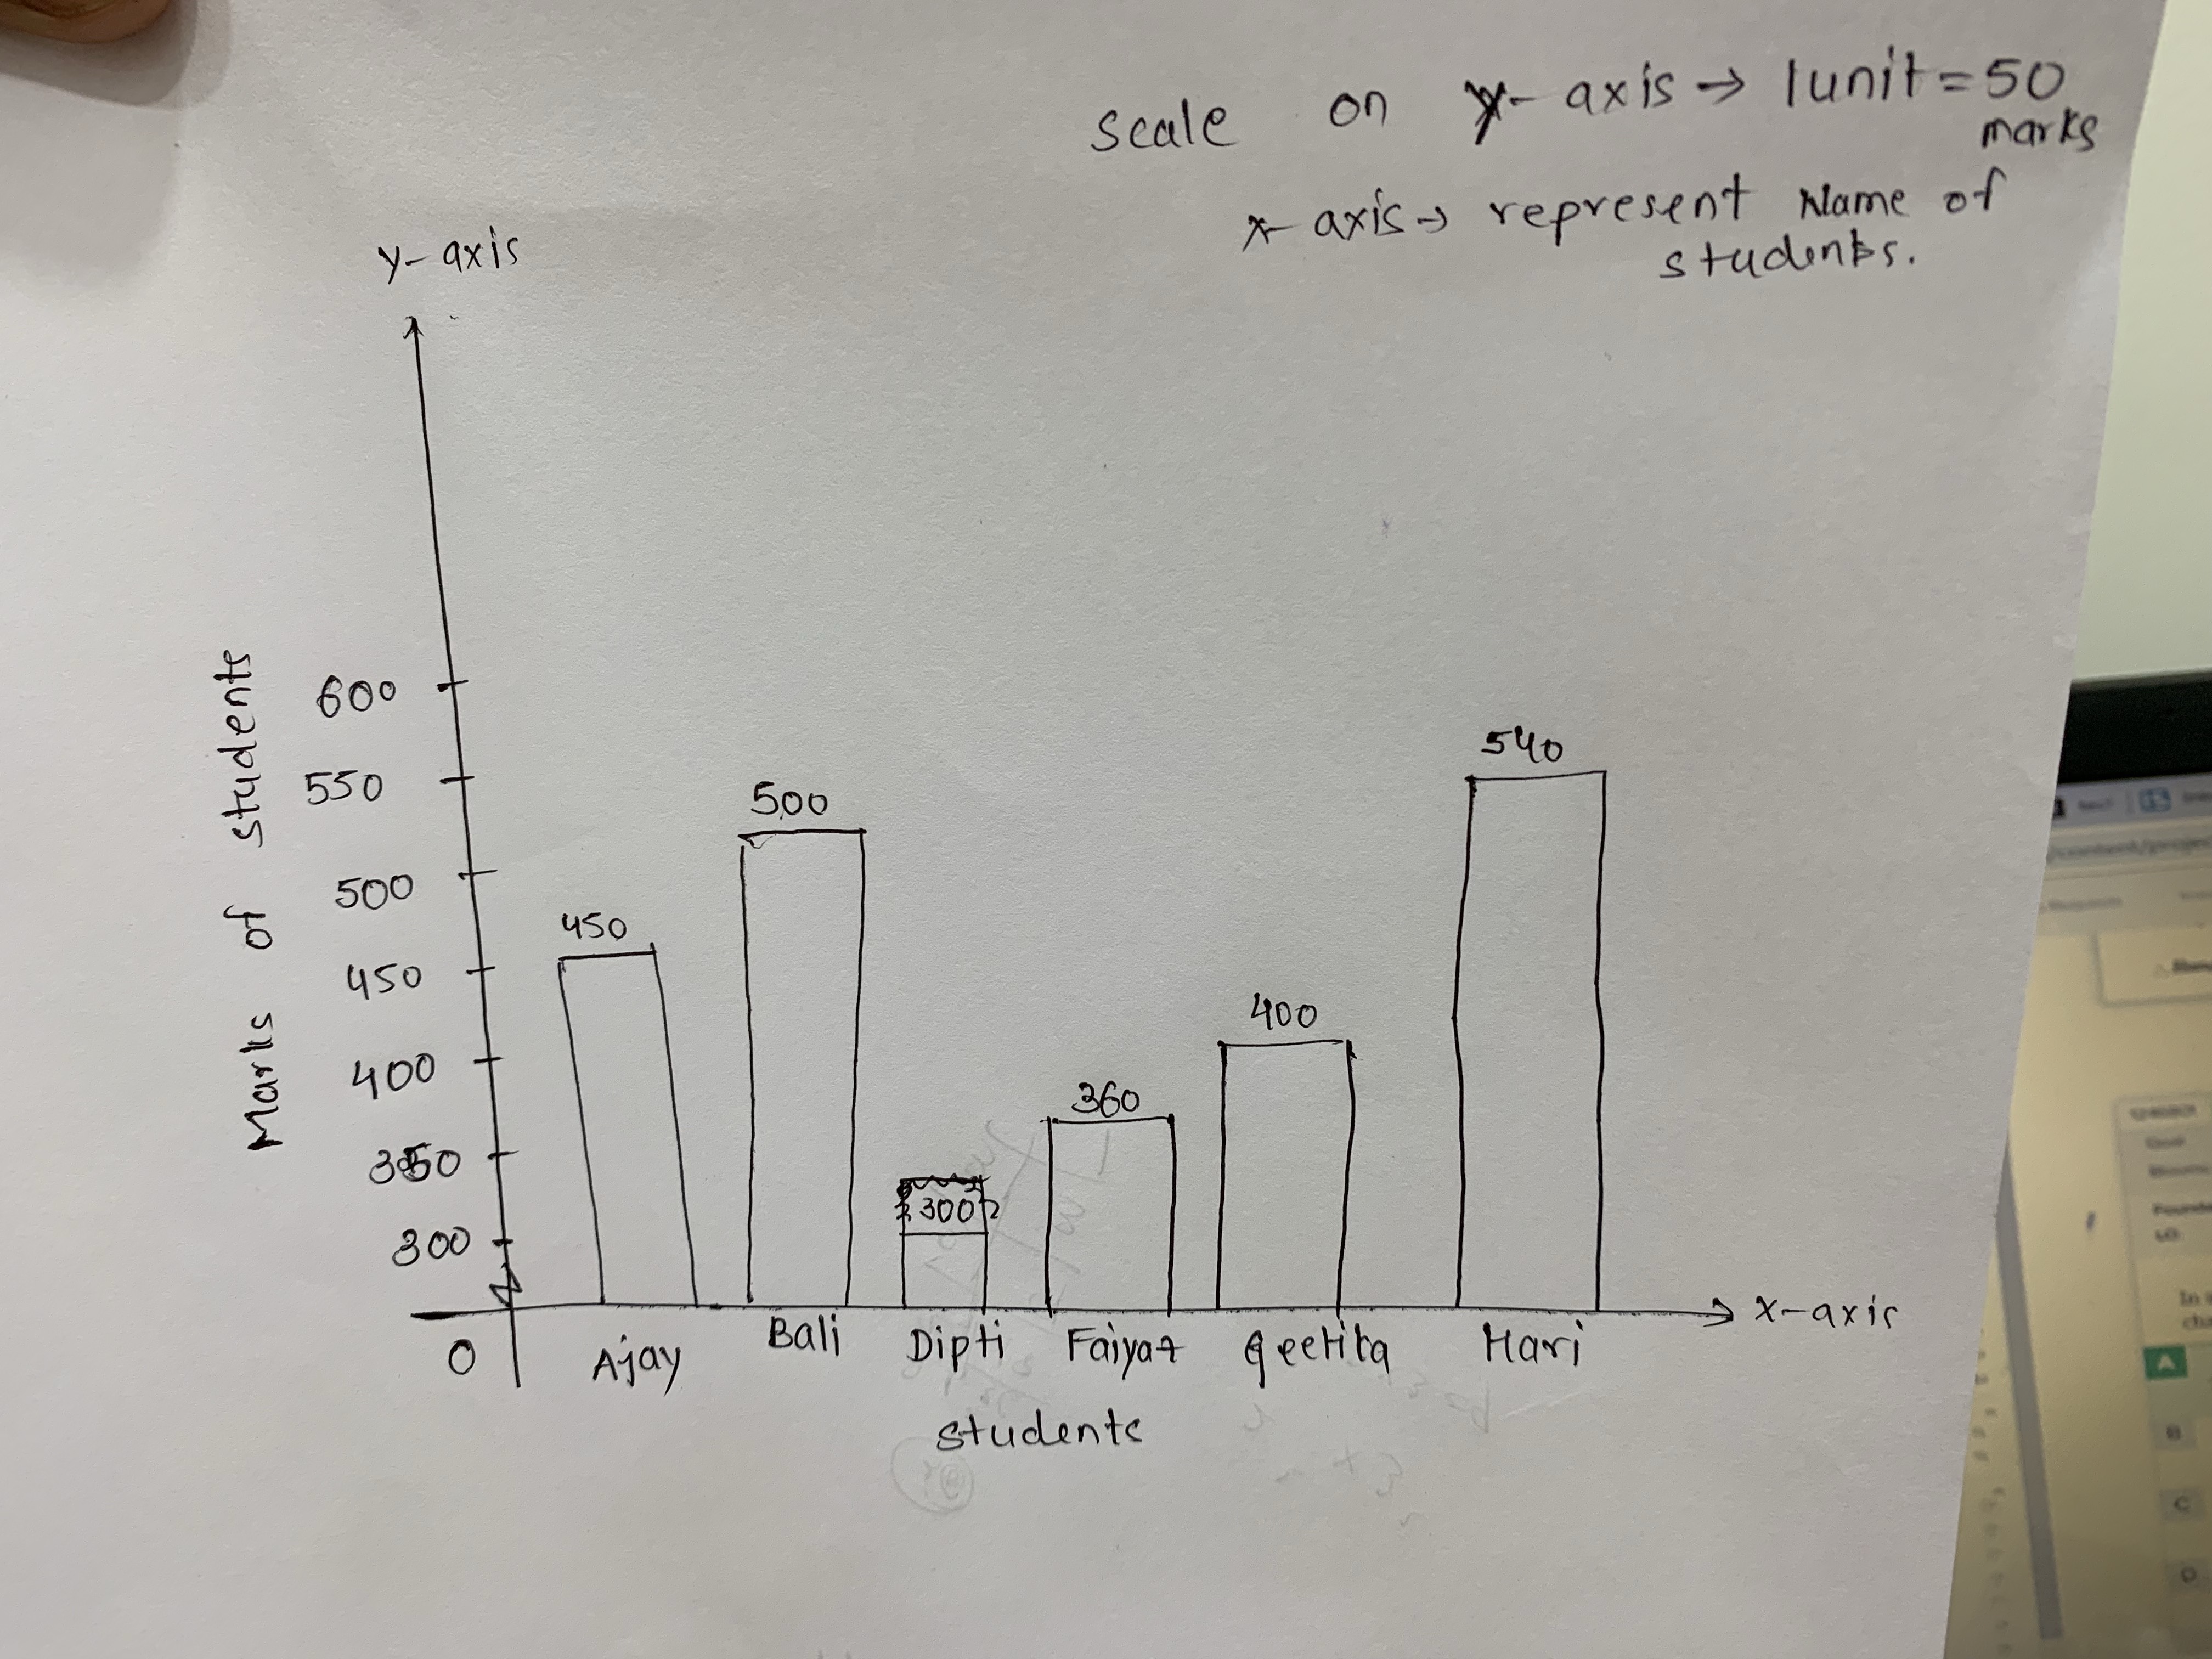
Following data gives total marks (out $$600$$) obtained by six children of a particular class. Represent the data on a bar graph.
| Students | Ajay | Bali | Dipti | Faiyaz | Geetika | Hari |
| Marks obtained | $$450$$ | $$500$$ | $$300$$ | $$360$$ | $$400$$ | $$540$$ |
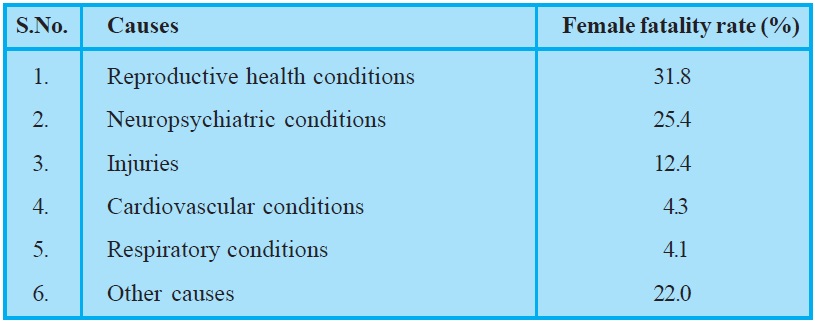
A survey conducted by an organisation for the cause of illness and death among the women between the ages $$15-44$$ (in years) worldwide, found the following figures (in %):
(i) Represent the information given above graphically.
(ii) Which condition is the major cause of women's ill health and death worldwide?
(iii) Try to find out, with the help of your teacher, any two factors which play a major role in the cause in (ii) above being the major cause.
(i) Medical infrastructure in work.
(ii) Lack of treatment facilitators and facilities.

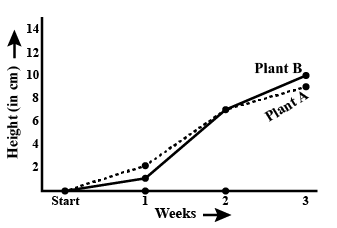
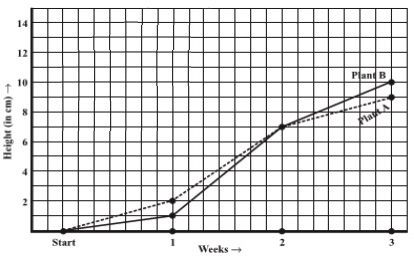
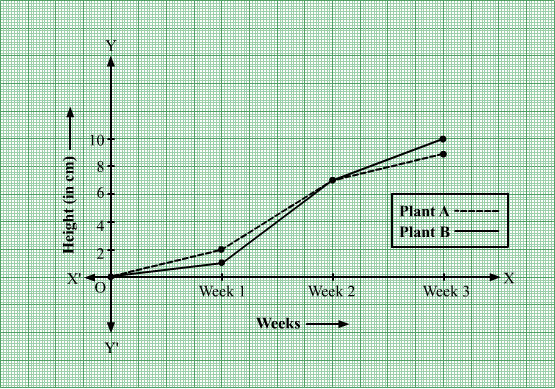
For an experiment in Botany two different plants, plant A and plant B were grown under similar laboratory conditions. The heights were measured at the end of each week for $$3$$ weeks. The results are shown by the following graph.
(a) How high was Plant A after (i) $$2$$ weeks (ii) $$3$$ weeks?
(b) How high was Plant B after (i) $$2$$ weeks (ii) $$3$$ weeks?
(c) How much did Plant A grow during the $$3^{rd}$$ week?
(d) How much did Plant B grow from the end of the $$2nd$$ week to the end of the $$3rd$$ week?
(e) During which week did plant A grow most?
(f) During which week did plant B grow least?
(g) Were the two plants of the same height during any week shown here? Specify.
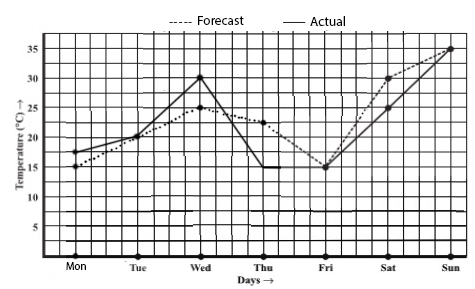
The following graph shows the temperature forecast and the actual temperature for each day of a week.
(a) On which day was the forecast temperature the same as the actual temperature?
(b) What was the maximum forecast temperature during the week?
(c) What was the minimum actual temperature during the week?
(d) On which day did the actual temperature differ the most from the forecast temperature?
The following data on the number of girls (to the nearest ten) per thousand boys in different sections of Indian society is given below.
(i) Represent the information above by a bar graph.
(ii) In the classroom discuss what conclusions can be arrived at from the graph.
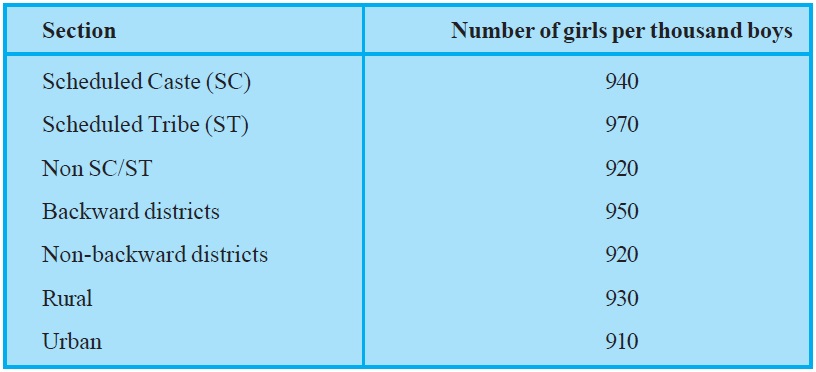
Urban : Minimum girls : $$910$$
Number of girls in rural $$>$$ urban.
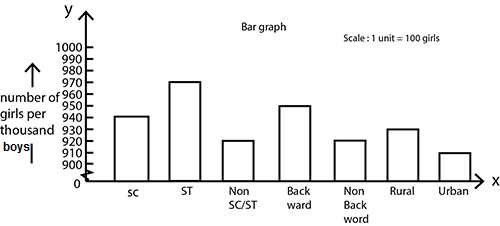
Draw a graph for the following.
i) Side of square (in cm) 2 3 3.5 5 6 Perimeter (in cm) 8 12 14 20 24
Is it a linear graph?
(ii) Side of square (in cm) 2 3 4 5 6 Perimeter (in cm) 4 9 16 25 36
Is it a linear graph?
| Side of square (in cm) | 2 | 3 | 3.5 | 5 | 6 |
| Perimeter (in cm) | 8 | 12 | 14 | 20 | 24 |
(ii)
| Side of square (in cm) | 2 | 3 | 4 | 5 | 6 |
| Perimeter (in cm) | 4 | 9 | 16 | 25 | 36 |
The shoppers who come to a departmental store are marked as: man (M), woman (W), boy (B) or girl (G). The following list gives the shoppers who came during the first hour in the morning:
W W W G B W W M G G M M W W W W G B M W B G G M W W M M W W
W M W B W G M W W W W G W M M W W M W G W M G W M M B G G W
Make a frequency distribution table using tally marks. Draw a bar graph to illustrate it.
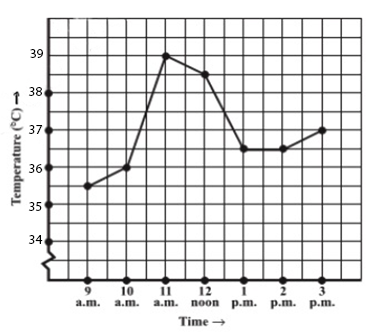
The following graph shows the temperature of a patient in a hospital, recorded every hour.
(a) What was the patient's temperature at $$1\ \textbf{p.m.}$$?
(b) When was the patient's temperature $$38.5^{\circ} \textbf{C}$$?
(c) The patient's temperature was the same two times during the period given.
What were these two times?
(d) What was the temperature at $$1.30\ \textbf{p.m.}$$? How did you arrive at your answer?
(e) During which periods did the patient's temperature showed an upward trend?
Use the tables below to draw linear graphs.
(a) The number of days a hill side city received snow in different years. Year 2003 2004 2005 2006 Days 8 10 5 12
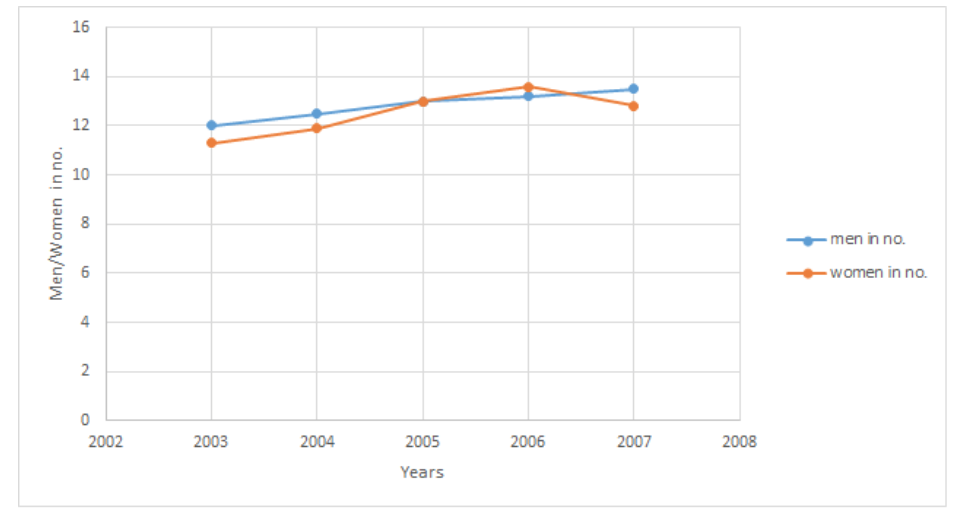
(b) Population (in thousands) of men and women in a village in different years.
| Year | 2003 | 2004 | 2005 | 2006 |
| Days | 8 | 10 | 5 | 12 |
| Year | 2003 | 2004 | 2005 | 2006 | 2007 |
| Men in no. | 12 | 12.5 | 13 | 13.2 | 13.5 |
| Women in no. | 11.3 | 11.9 | 13 | 13.6 | 12.8 |
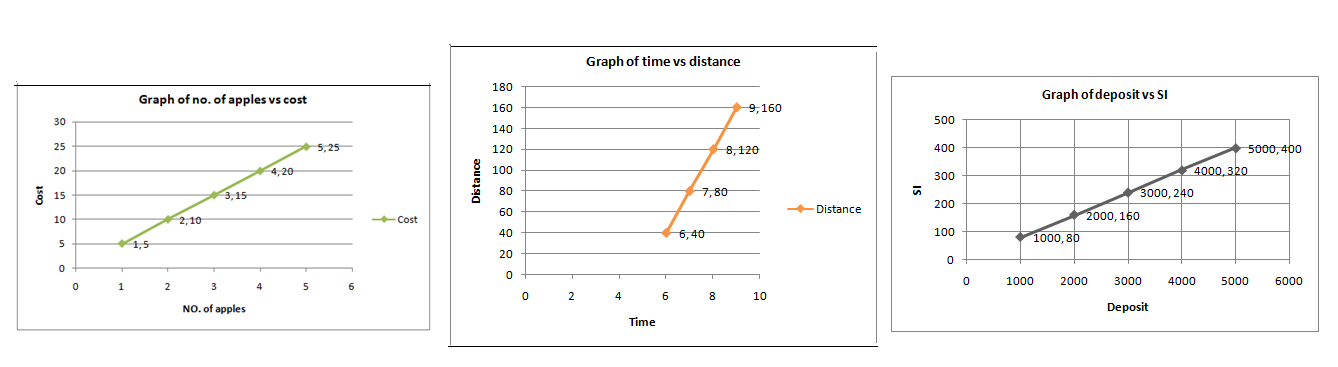
Draw the graphs for the following tables of values, with suitable scales on the axes.(a) Cost of apples
| Number of apples | 1 | 2 | 3 | 4 | 5 |
| Cost (in Rs.) | 5 | 10 | 15 | 20 | 25 |
| Time (in hours) | 6am | 7am | 8am | 9am |
| Distance (in km) | 40 | 80 | 120 | 160 |
(ii) What was the time when the car had covered a distance of $$100$$ km since it's start?
| Deposit (in Rs.) | 1000 | 2000 | 3000 | 4000 | 5000 |
| Simple Interest (in Rs.) | 80 | 160 | 240 | 320 | 400 |
(ii) Use the graph to find the interest on $$Rs.2500$$ for a year.
(iii) To get an interest of $$Rs.280$$ per year, how much money should be deposited?
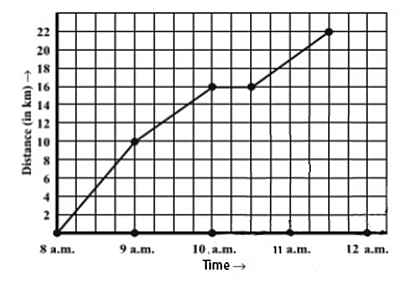
A courier-person cycles from a town to a neighbouring suburban area to deliver a parcel to a merchant. His distance from the town at different times is shown by the following graph.
(a) What is the scale taken for the time axis?
(b) How much time did the person take for the travel?
(c) How far is the place of the merchant from the town?
(d) Did the person stop on his way? Explain.
(e) During which period did he ride fastest?
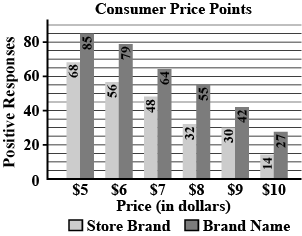
The given graph represent the how much consumers would be willing to pay for store brand and brand name products. On average, how many more cents are consumers willing to pay for the brand name version of the product than the store brand version? (Round your answer to the nearest cent)
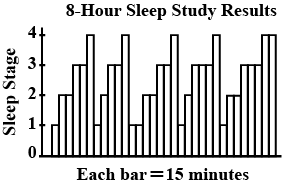
A scientist is doing study on person sleep. He classifies sleep activity in four stages: $$1,2,3$$ and $$4$$. Stage $$3$$ is the only stage considered to be deep sleep. Ajay goes to clinic for sleeping brainwashes analyzed. Doctor monitored the person's brainwashes in $$15-$$minute intervals, for $$8$$ continuous hours, and categorized them into one of the four stages. The graph above shows this study.Based on the graph, how many minutes did ajay spend in non-deep sleep over the course of the entire night?
Calculate quartile deviation for the following data:
$$30, 18, 23, 15, 11, 29, 37, 42, 10, 21$$
Calculate quartile deviation for the following data:
$$3, 5, 8, 10, 12, 7, 5$$
Compute quartile deviation for each of the following tables.
| Class interval | frequency |
| $$1 - 9$$ | $$4$$ |
| $$10 - 19$$ | $$3$$ |
| $$20 - 29$$ | $$20$$ |
| $$30 - 39$$ | $$12$$ |
| $$40 - 49$$ | $$5$$ |
| $$50 - 59$$ | $$8$$ |
| $$60 - 69$$ | $$14$$ |
| $$70 - 79$$ | $$27$$ |
| $$80 - 89$$ | $$2$$ |
| $$90 - 99$$ | $$5$$ |
Calculate quartile deviation for the following data:
| Age | $$3$$ | $$6$$ | $$9$$ | $$12$$ | $$15$$ |
| No. of children | $$4$$ | $$8$$ | $$11$$ | $$7$$ | $$12$$ |
Compute quartile deviation for each of the following tables.
| Class interval | frequency |
| $$5 - 15$$ | $$11$$ |
| $$15 - 25$$ | $$5$$ |
| $$25 - 35$$ | $$15$$ |
| $$35 - 45$$ | $$9$$ |
| $$45 - 55$$ | $$22$$ |
| $$55 - 65$$ | $$8$$ |
| $$67 - 75$$ | $$17$$ |
Calculate quartile deviation for the following data:
| Marks scored | $$10$$ | $$20$$ | $$30$$ | $$40$$ | $$50$$ | $$60$$ |
| No. of students | $$12$$ | $$7$$ | $$16$$ | $$8$$ | $$18$$ | $$22$$ |
Calculate the quartile deviation for the following:
| $$C.I.$$ | $$0-9$$ | $$10-19$$ | $$20-29$$ | $$30-39$$ | $$40-49$$ | $$50-59$$ | $$60-69$$ |
| $$f$$ | $$8$$ | $$16$$ | $$17$$ | $$34$$ | $$10$$ | $$5$$ | $$10$$ |
The runs scored by a batsman in seven innings are $$28, 60, 85, 58, 74, 20, 90$$. Find $$Q_{1}, Q_{2}, Q_{3}$$ and quartile deviation
Define or explain the concepts:
Higher Order Table
Define or explain the concepts:
Complex table
Give Reason :
Manifold table can presents 2 or 3 characteristics.
What are the different types of tables?
Define or explain the concepts:
Complex Table
Answer the Following :
What is a complex table?
Define or explain the concepts:
Tabulation
Write Short Note on the following:
Types of Table
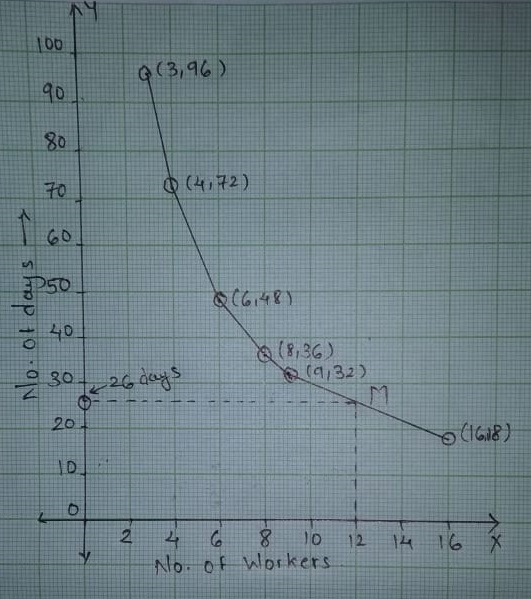
Draw a graph for the data given in the table. Hence find the number of days taken by $$12$$ workers to complete the work ?
| No. of works $$x$$ | 3 | 4 | 6 | 8 | 9 | 16 |
| No. of days $$y$$ | 96 | 72 | 48 | 36 | 32 | 18 |
Sita practiced piano for 2hrs everyday during the month of January. How many hrs did she practice in January? (Use bar model for solving the sum)
Number of children in six different classes are given. Represent the data on a bar graph.
| Class | Fifth | Sixth | Seventh | Eighth | Ninth | Tenth |
| Number of Children | $$135$$ | $$120$$ | $$95$$ | $$100$$ | $$90$$ | $$80$$ |
Number of children in six different classes are given. Represent the data on a bar graph.
| Class | Fifth | Sixth | Seventh | Eighth | Ninth | Tenth |
| Number of Children | $$135$$ | $$120$$ | $$95$$ | $$100$$ | $$90$$ | $$80$$ |
Which class has the maximum number of children? And the minimum?
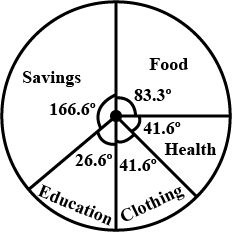
Draw a pic chart for the following data.
| Item of expenditure | Food | Health | Cloting | Education | Savings |
| Amount spent in rupess | $$3750$$ | $$1875$$ | $$1875$$ | $$1200$$ | $$7500$$ |
| Item of expenditure | Amount in rupees | Central angle | |
| Food | $$3750$$ | $$\dfrac{3750}{16200}\times{360}^{\circ}={83.3}^{\circ}$$ | |
| Health | $$1875$$ | $$\dfrac{1875}{16200}\times{360}^{\circ}={41.6}^{\circ}$$ | |
| Clothing | $$1875$$ | $$\dfrac{1875}{16200}\times{360}^{\circ}={41.6}^{\circ}$$ | |
| Education | $$1200$$ | $$\dfrac{1200}{16200}\times{360}^{\circ}={26.6}^{\circ}$$ | |
| Savings | $$7500$$ | $$\dfrac{7500}{16200}\times{360}^{\circ}={166.6}^{\circ}$$ |
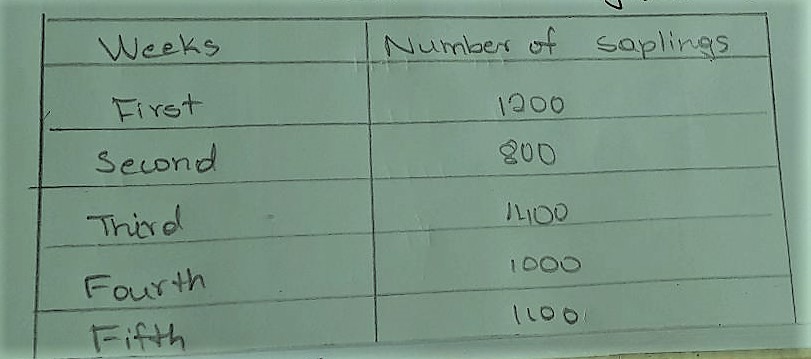
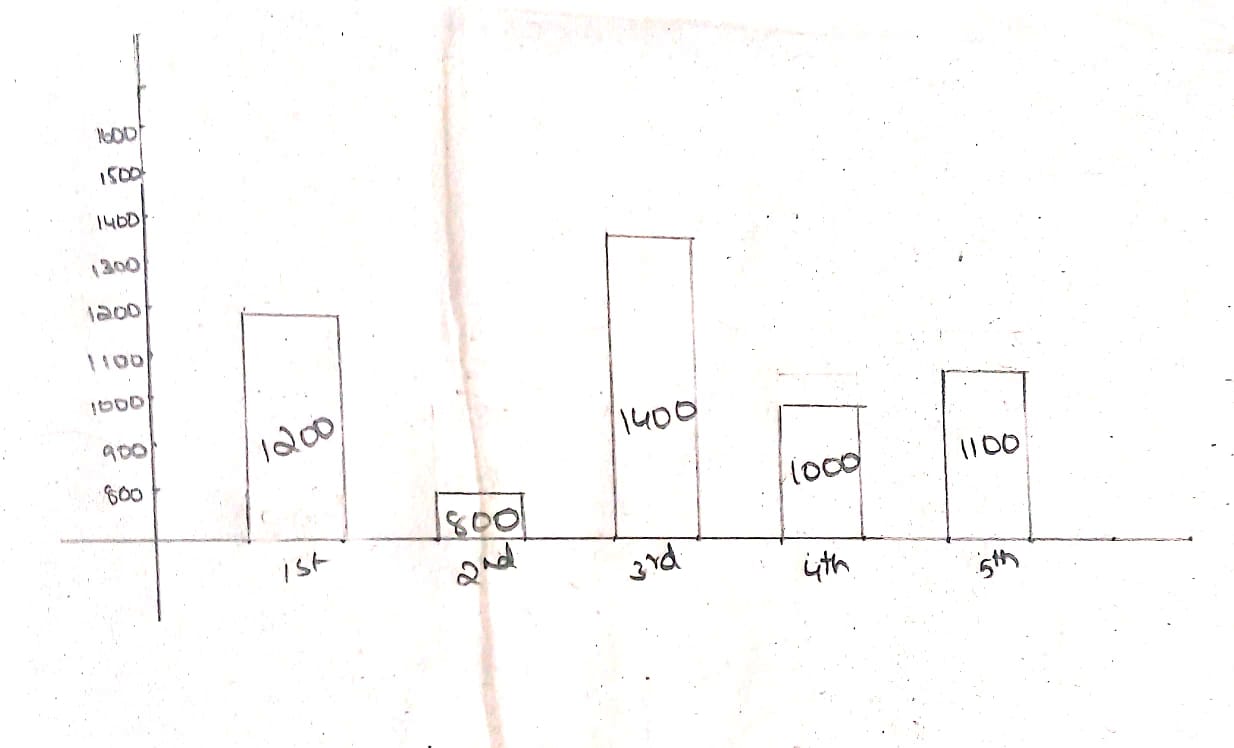
Draw a bar graph ..
The number of saplings planted by a former in five consecutive weeks are given below.
How much more is the total saving of Savita than the total saving of Megha?
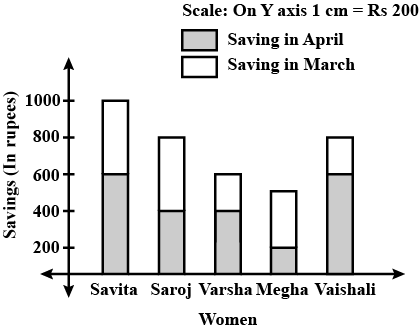
How much is the saving of Vaishali in the month of April?

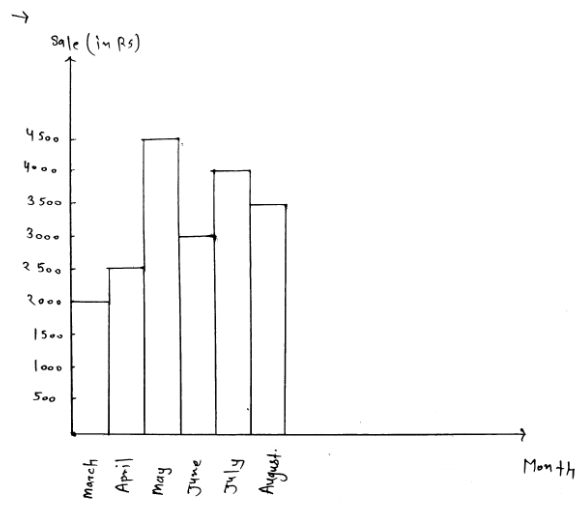
| Month | Sale (in Rs) |
| March | 2000 |
| April | 2500 |
| May | 4500 |
| June | 3000 |
| July | 4000 |
| August | 3500 |
Draw a bar graph to depict the above data.
How much is the total saving of Saroj in the months March and April?

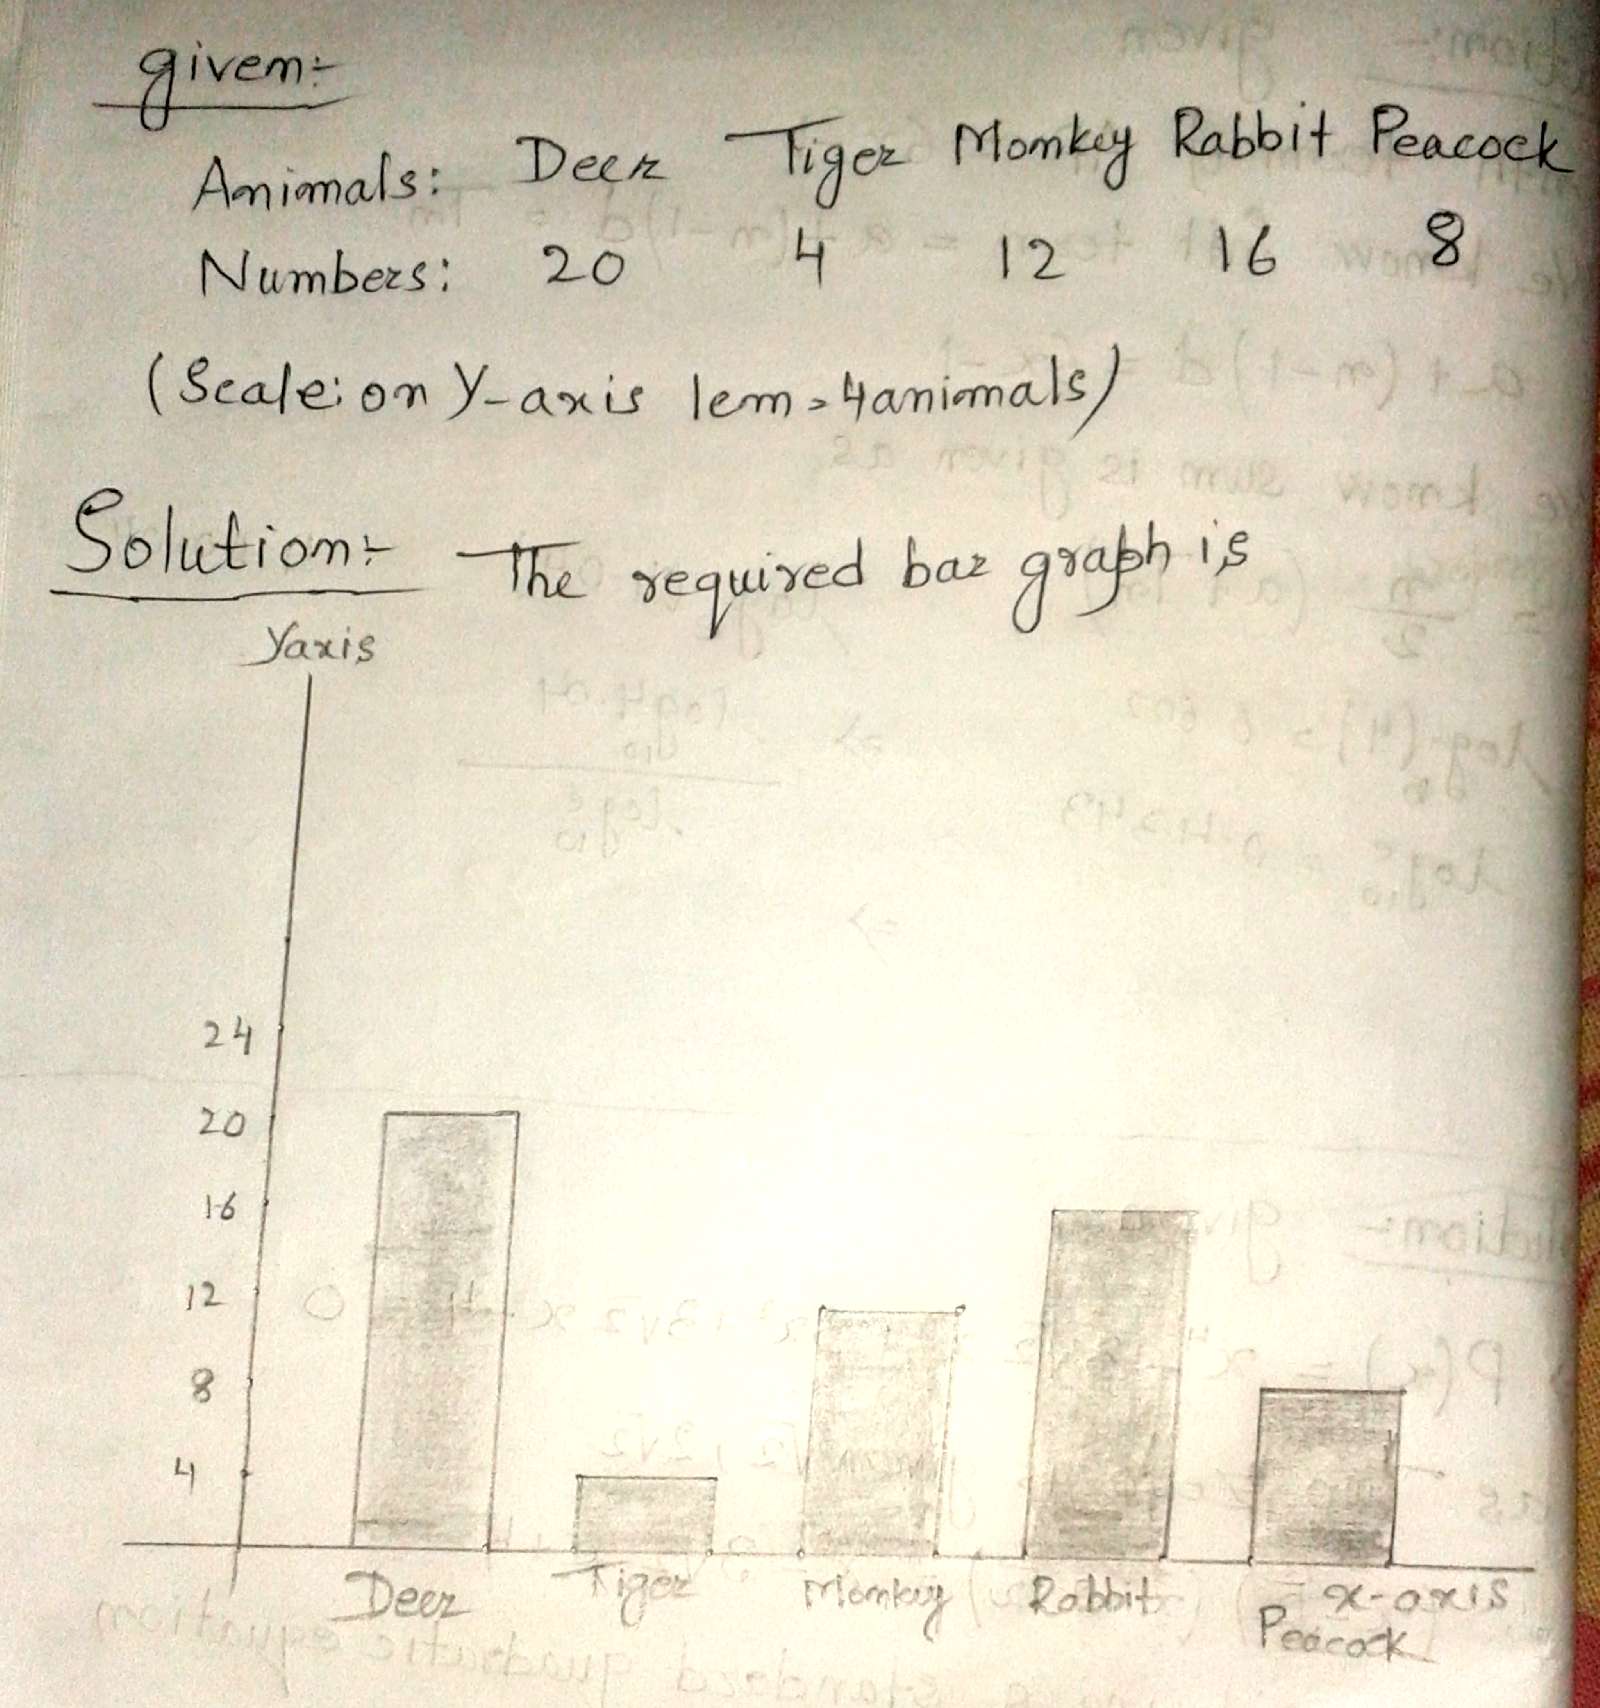
The names and number of animals in a certain zoo are given below. use the data to make a bar graph. (Scale : on Y-axis, 1 cm =4 animals)
| Animals | Deer | Tiger | Monkey | Rabbit | Peacock |
| Number | 20 | 4 | 12 | 16 | 8 |
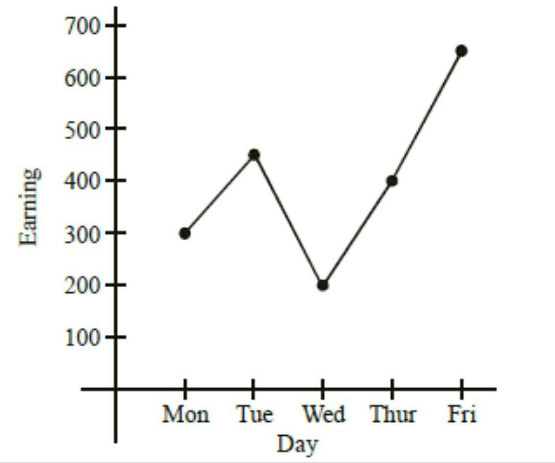
What is the percentage increase of earning from Thursday to friday ?
What can you say about the position of the points (1,2,),(1,3),(1,-4),(1,0) and (1,8) locate on graph sheet

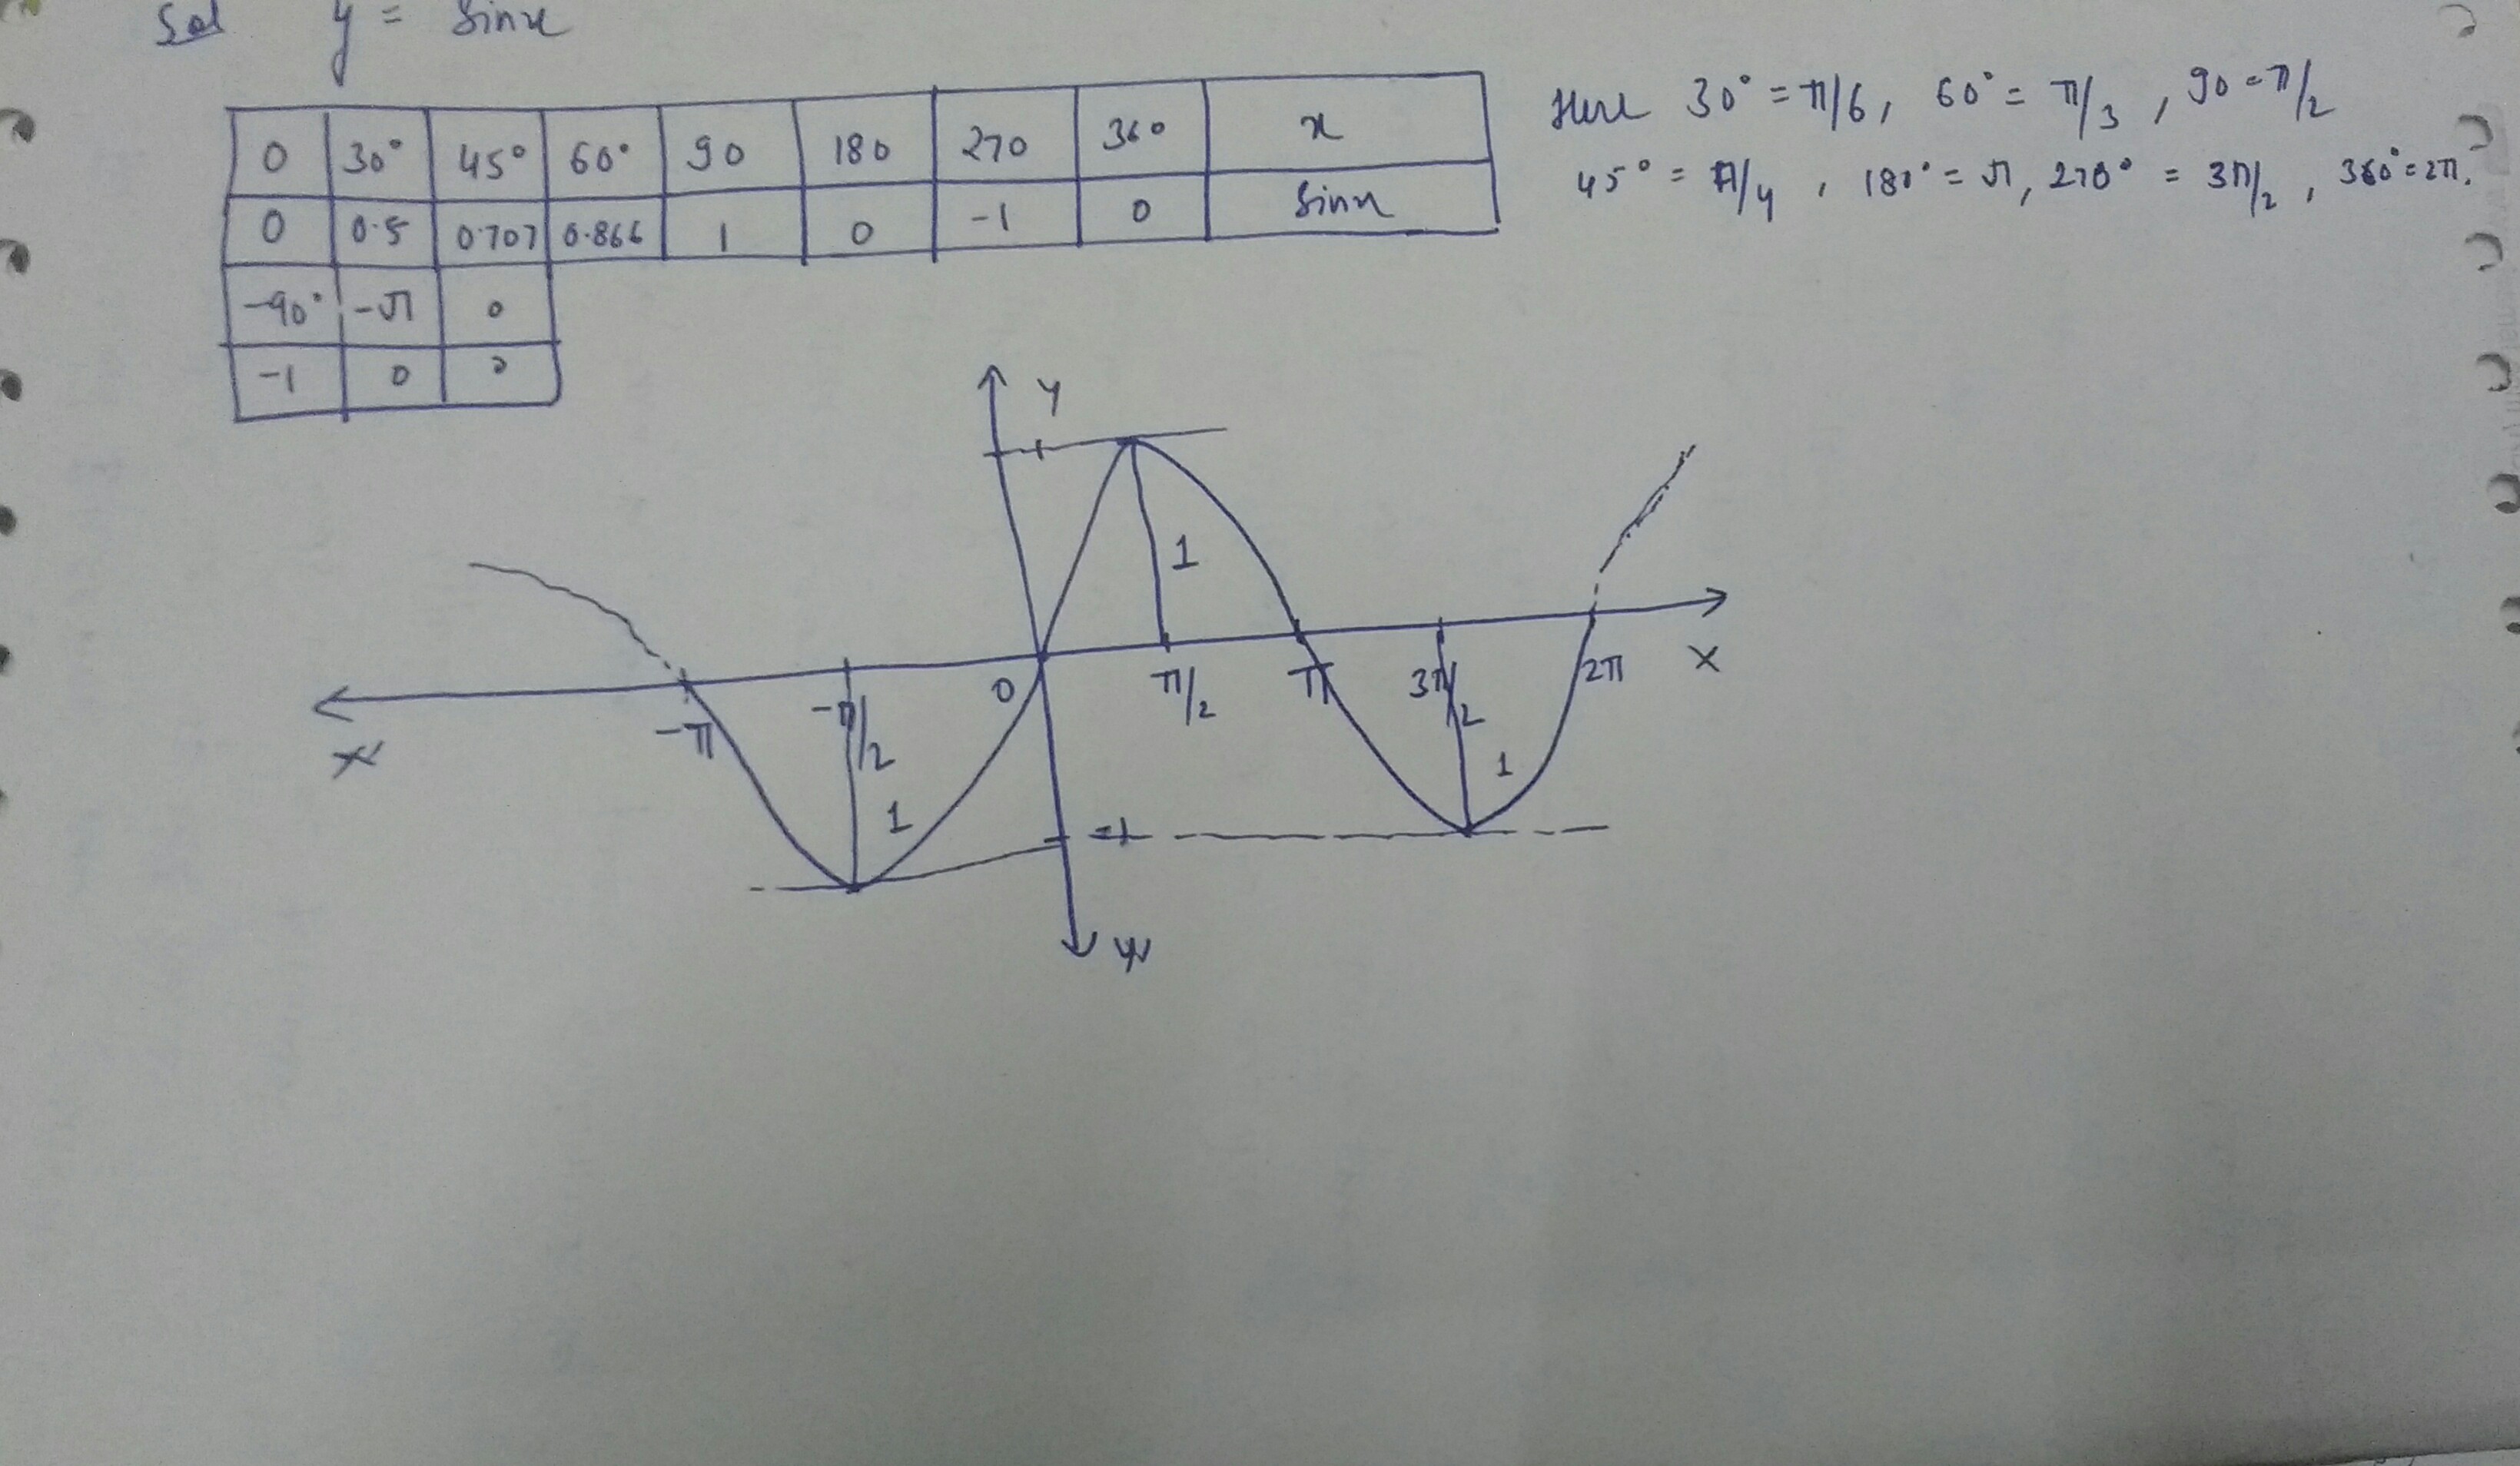
Draw the graph of $$\sin x$$.
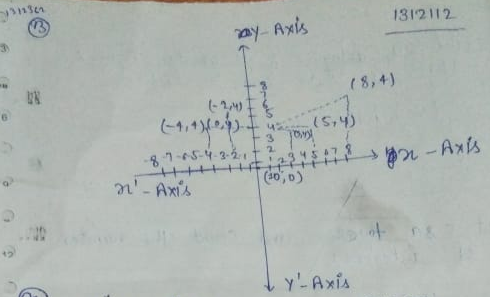
(5,4),(8,4),(3,4),(0,4),(-4,4),(-2,4) ? locate the points points on graph sheet .
We have,
Given points are
$$ \left( {{x}_{1}},{{y}_{1}} \right)=\left( 5,4 \right) $$
$$ \left( {{x}_{2}},{{y}_{2}} \right)=\left( 8,4 \right) $$
$$ \left( {{x}_{3}},{{y}_{3}} \right)=\left( 0,4 \right) $$
$$ \left( {{x}_{4}},{{y}_{4}} \right)=\left( -4,4 \right) $$
$$ \left( {{x}_{5}},{{y}_{5}} \right)=\left( -2,4 \right) $$
Then,
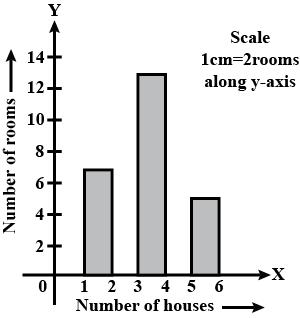
The number of room in $$25$$ houses of a locality is as given below:
$$4,3,2,6,4,3,2,1,5,3,2,3,4,3,5,1,6,1,3,4,2,3,4,3,5$$
Draw bar graph to represent the above date.
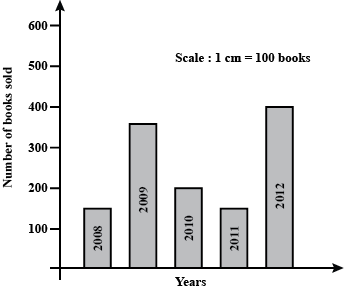
The adjoining bar graph shows the numbers of book sold by a bookstore during $$5$$ consecutive years. Read the bar graph and answer the following question:
About how many books were sold in $$2008, 2009$$ and $$2011$$ years?
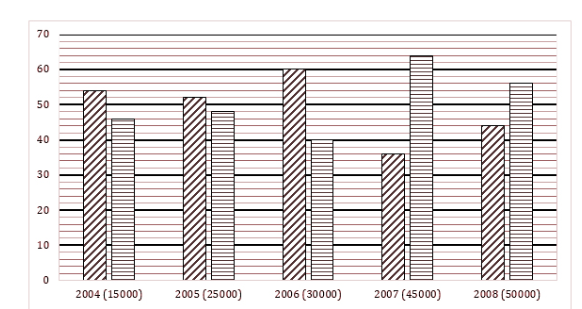
The following bar graph shows the percentage of chairs produced by two companies Neel Kamal and Raj Kamal during five different years. Bar graph also shows the total no. of chairs produced in different years associated with it. Study the graph carefully to answer the following questions:$$i)$$ Find the average no. of chairs produced by Raj Kamal in the years 2004, 2006 and 2007 together.
$$ii)$$ What is the ratio of no. of chairs produced by Neel Kamal in the years 2007 and 2008 together to that by Raj Kamal in the same years together?
$$iii)$$ If 12% chairs out of total chairs produced in the year 2008 were defective and in them ratio of defective chairs by Raj Kamal and Neel Kamal is 2 : 3 then find the no. of defective chairs produced by Neel Kamal in the year 2008.
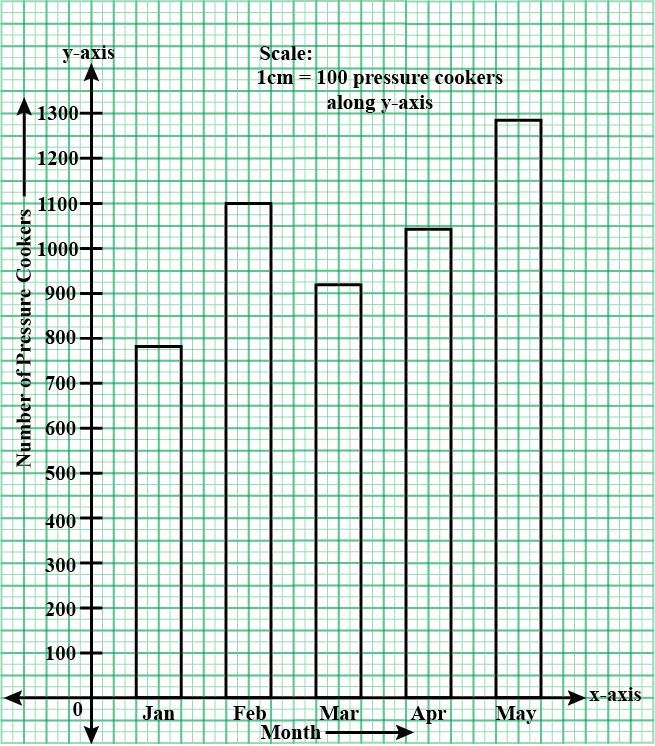
The number of pressure cookers produced in a factory for five consecutive months is given below:
| Month | January | February | March | April | May |
| Number of pressure cookers produced | 780 | 1100 | 920 | 1040 | 1280 |
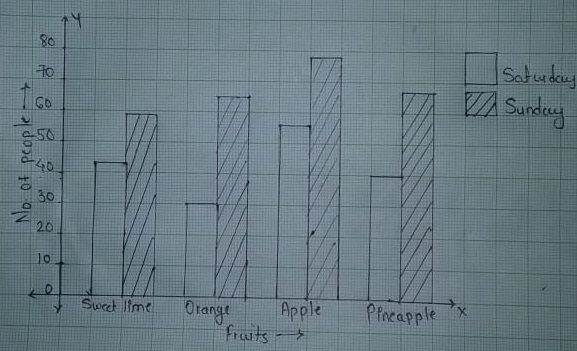
The table below shows the number of people who had the different juices at a juice bar on a Saturday and Sunday. Draw a joint bar graph for this data.
| fruits day | Sweet lime | Orange | Apple | Pineapple |
| Saturday | $$43$$ | $$30$$ | $$56$$ | $$40$$ |
| Sunday | $$59$$ | $$65$$ | $$78$$ | $$67$$ |
Why do we group data?
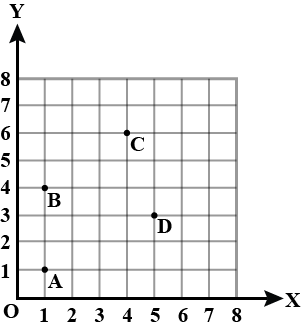
Find the coordinates of points $$A, B, C, D $$
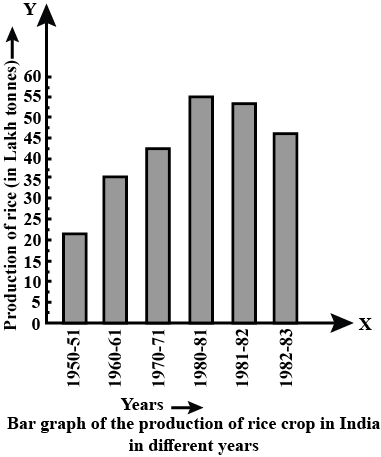
Read the bar graph given in fig. and answer the following questions:
What was the crop- production of rice in 1970-71? (in lakh tonnes)
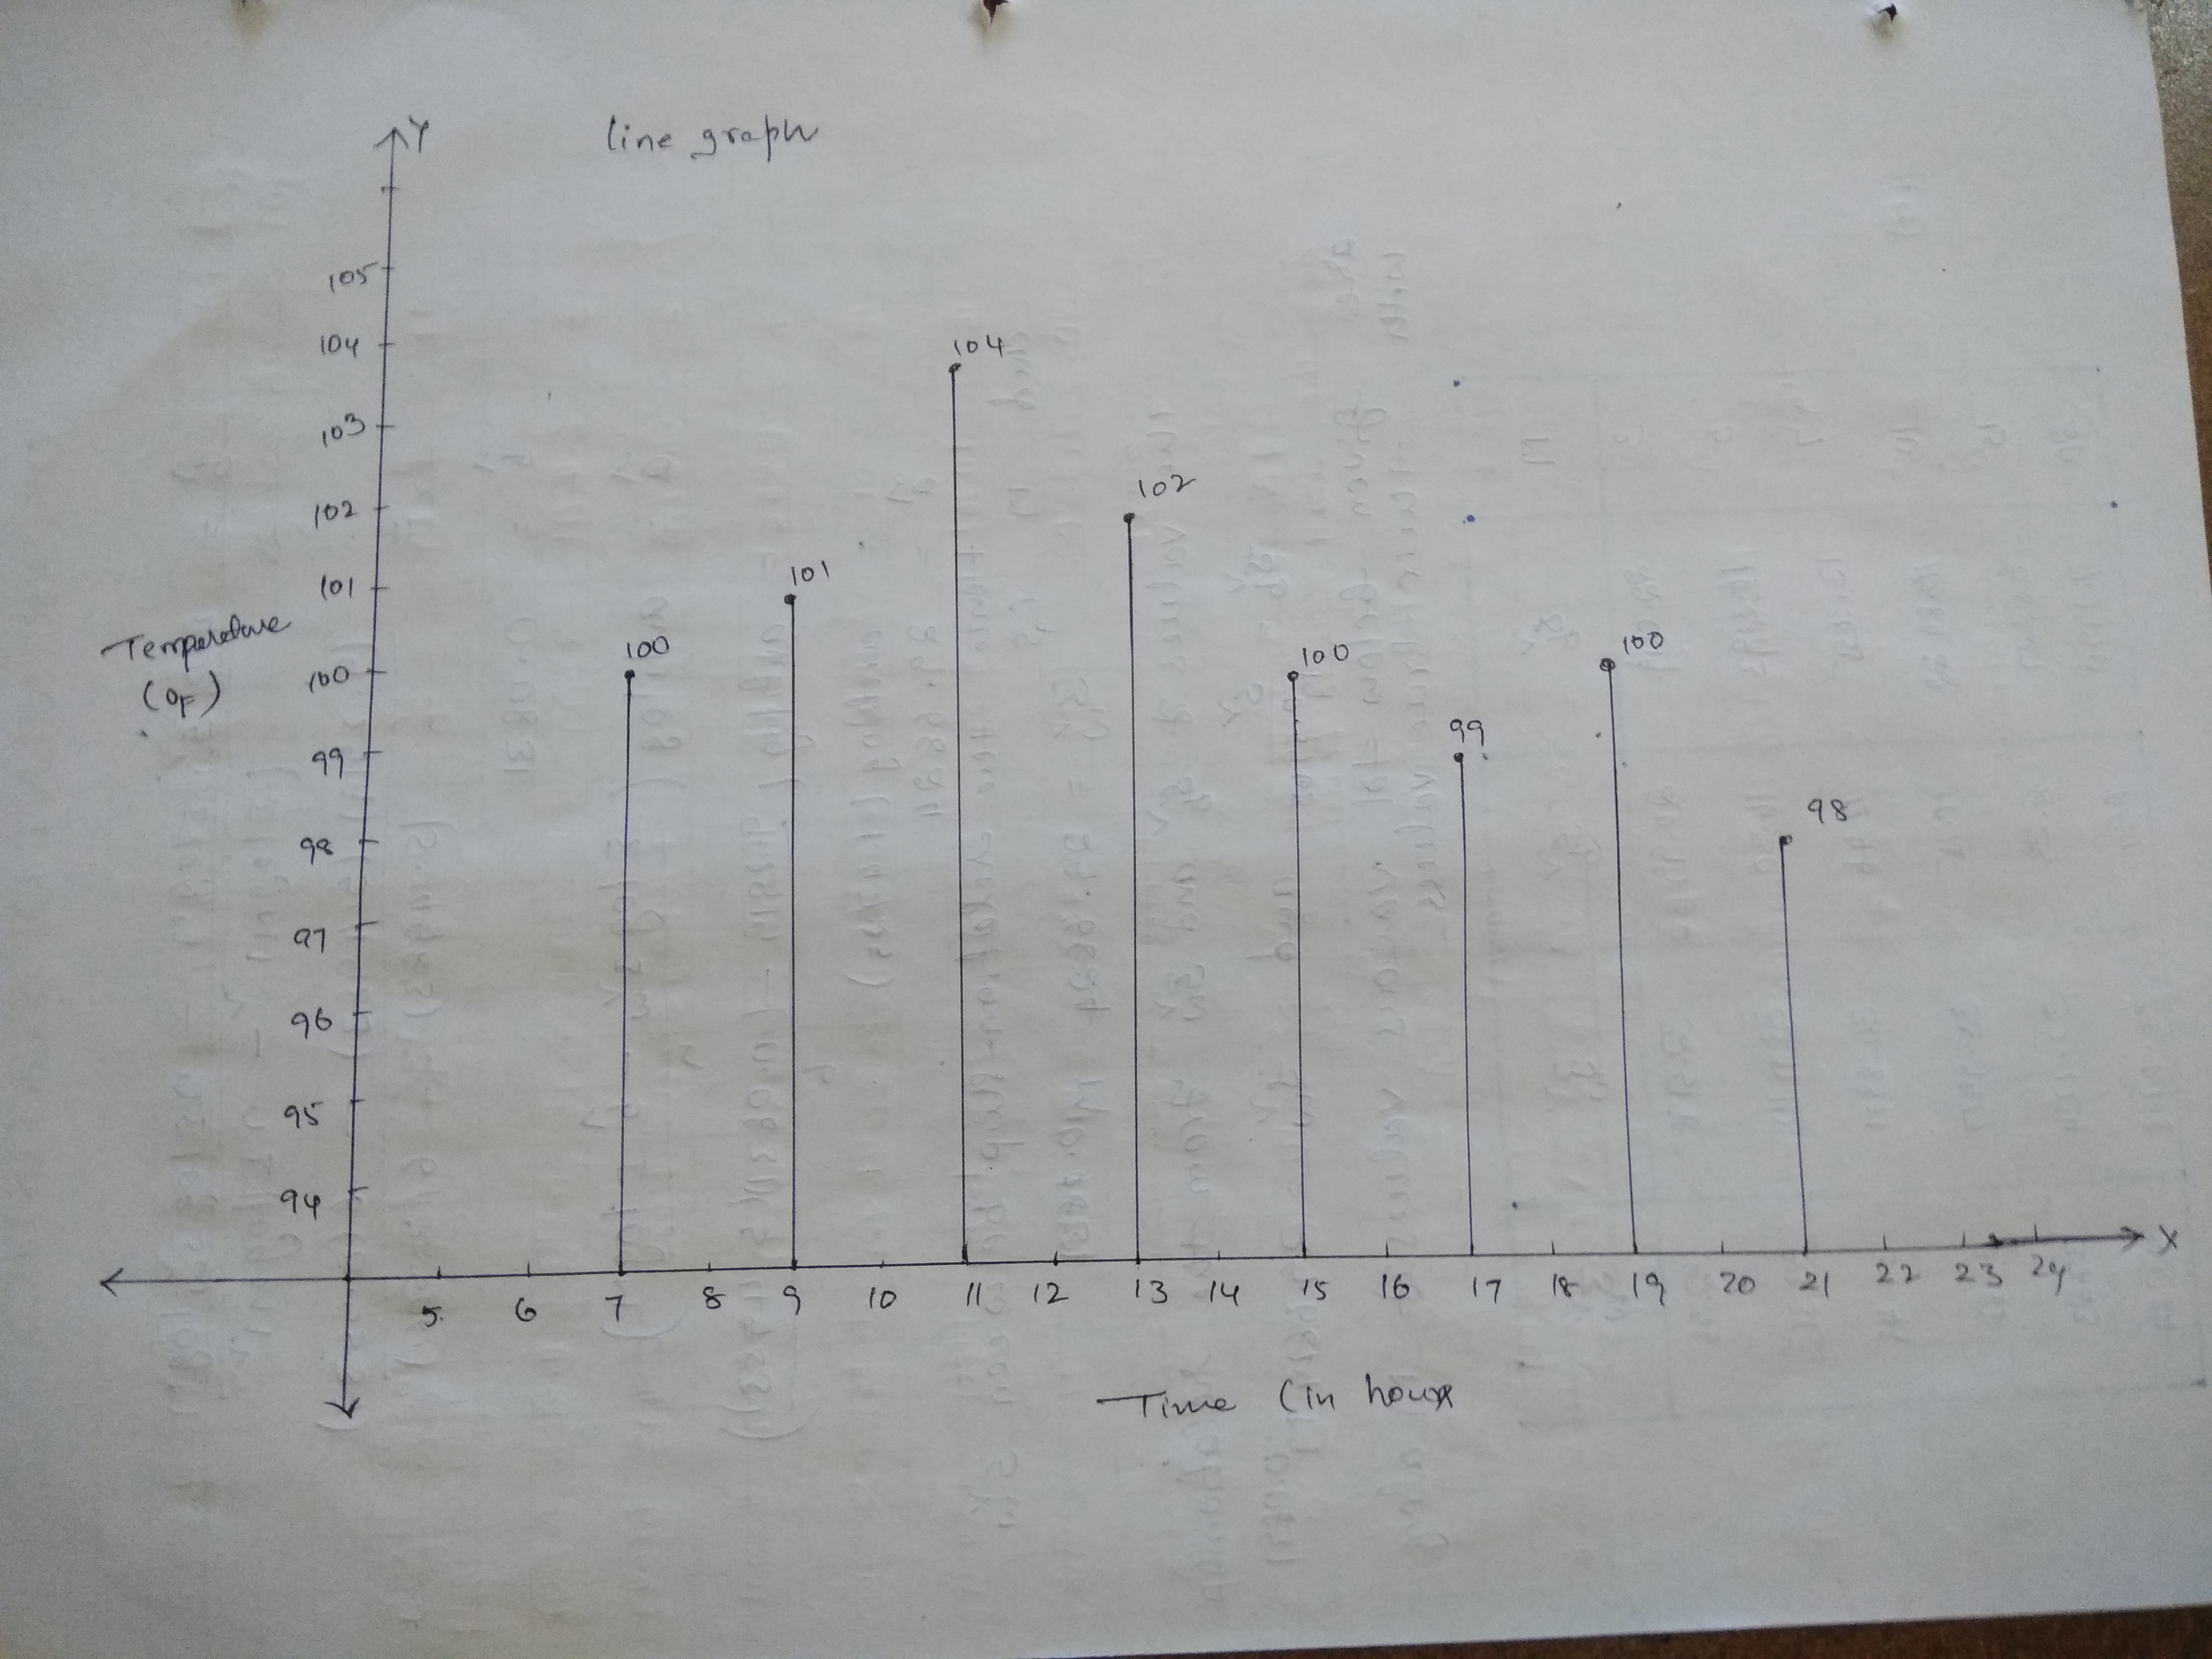
Draw the temperature -time graph in each of the following cases:
| Time(in hours): | $$7:00$$ | $$9:00$$ | $$11:00$$ | $$13:00$$ | $$15:00$$ | $$17:00$$ | $$19:00$$ | $$21:00$$ |
| Temperature ($$^{0}F$$)in: | $$100$$ | $$101$$ | $$104$$ | $$102$$ | $$100$$ | $$99$$ | $$100$$ | $$98$$ |
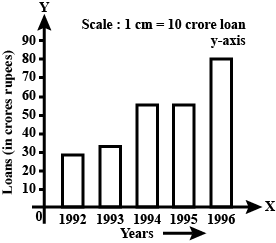
The following data give the amount of loans (in crores of rupees) disbursed by a bank during some years :
| Year | 1992 | 1993 | 1994 | 1995 | 1996 |
| Loan (in crores of rupees ) | 28 | 33 | 55 | 55 | 80 |
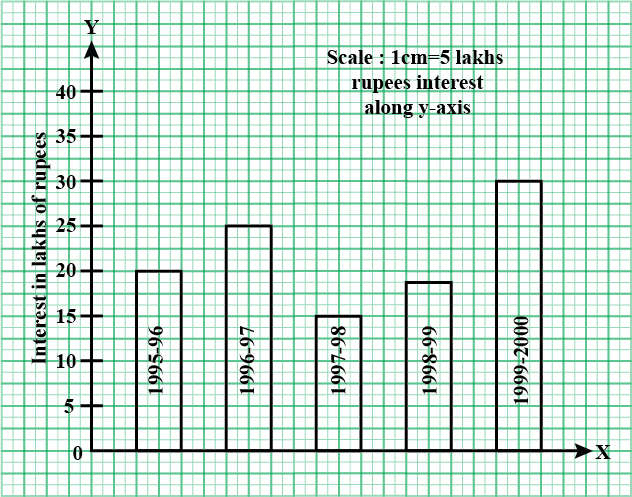
The following table shows the interest paid by a company (in lakhs) :
| Year | 1995-96 | 1996-97 | 1997-98 | 1998-99 | 1999-2000 |
| Interest (in lakhs of rupees ) | 20 | 25 | 15 | 18 | 30 |
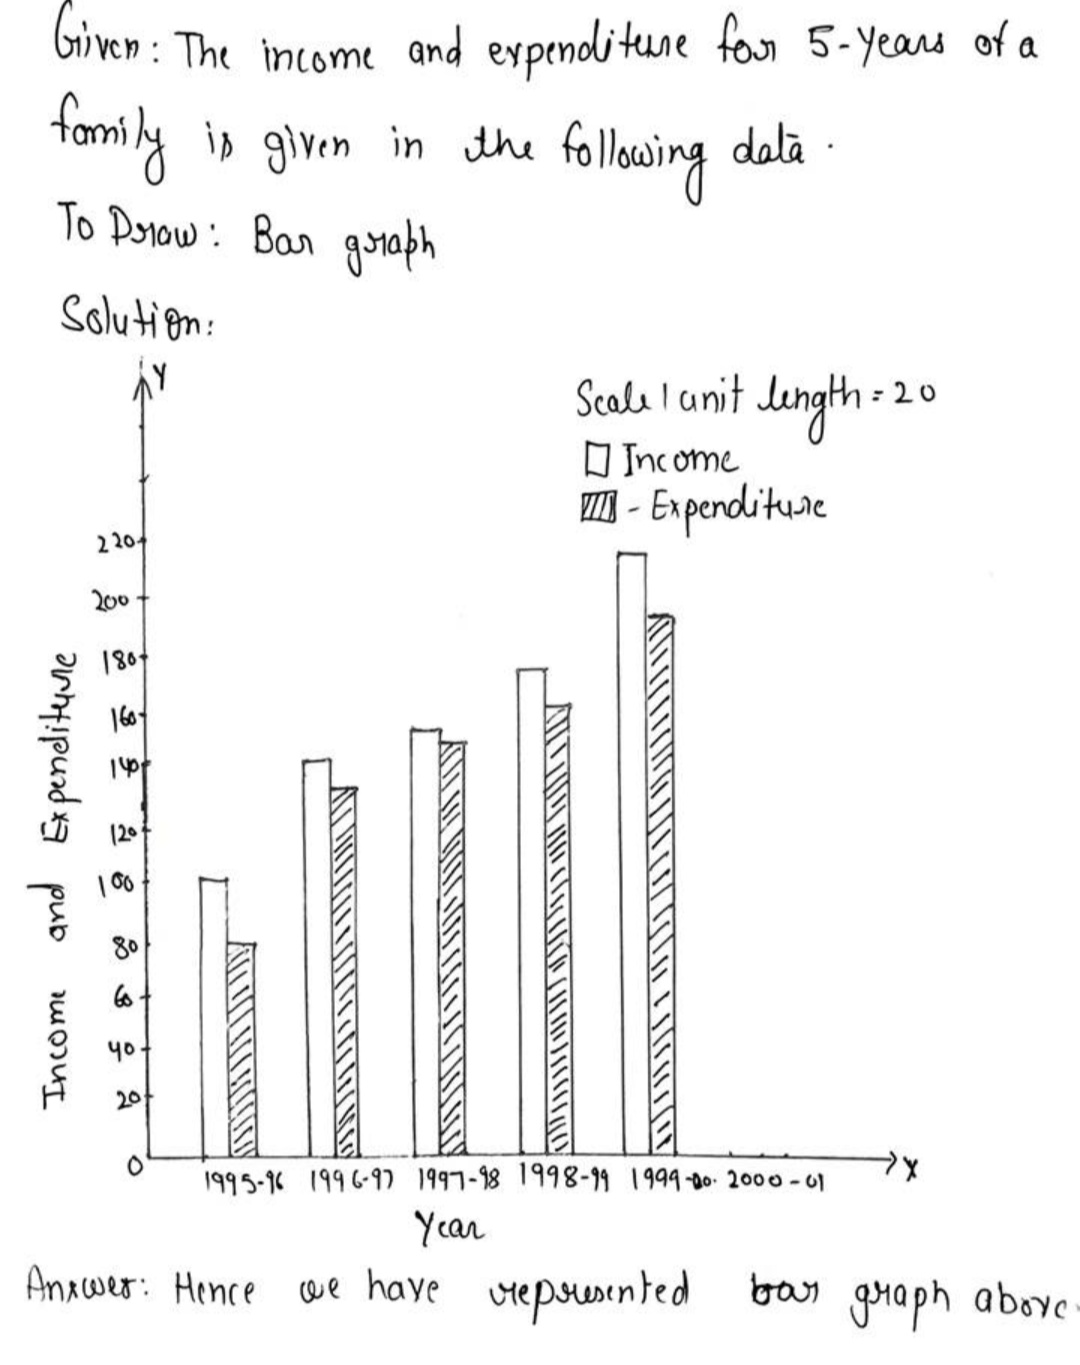
The income and expenditure for 5 years of a family is given in the following data :
| Years | 1995-96 | 1996-97 | 1997-98 | 1998-99 | 1999-2000 |
| Income (RS in thousands ) | 100 | 140 | 150 | 170 | 210 |
| Expenditure (RS in thousands ) | 80 | 130 | 145 | 160 | 190 |
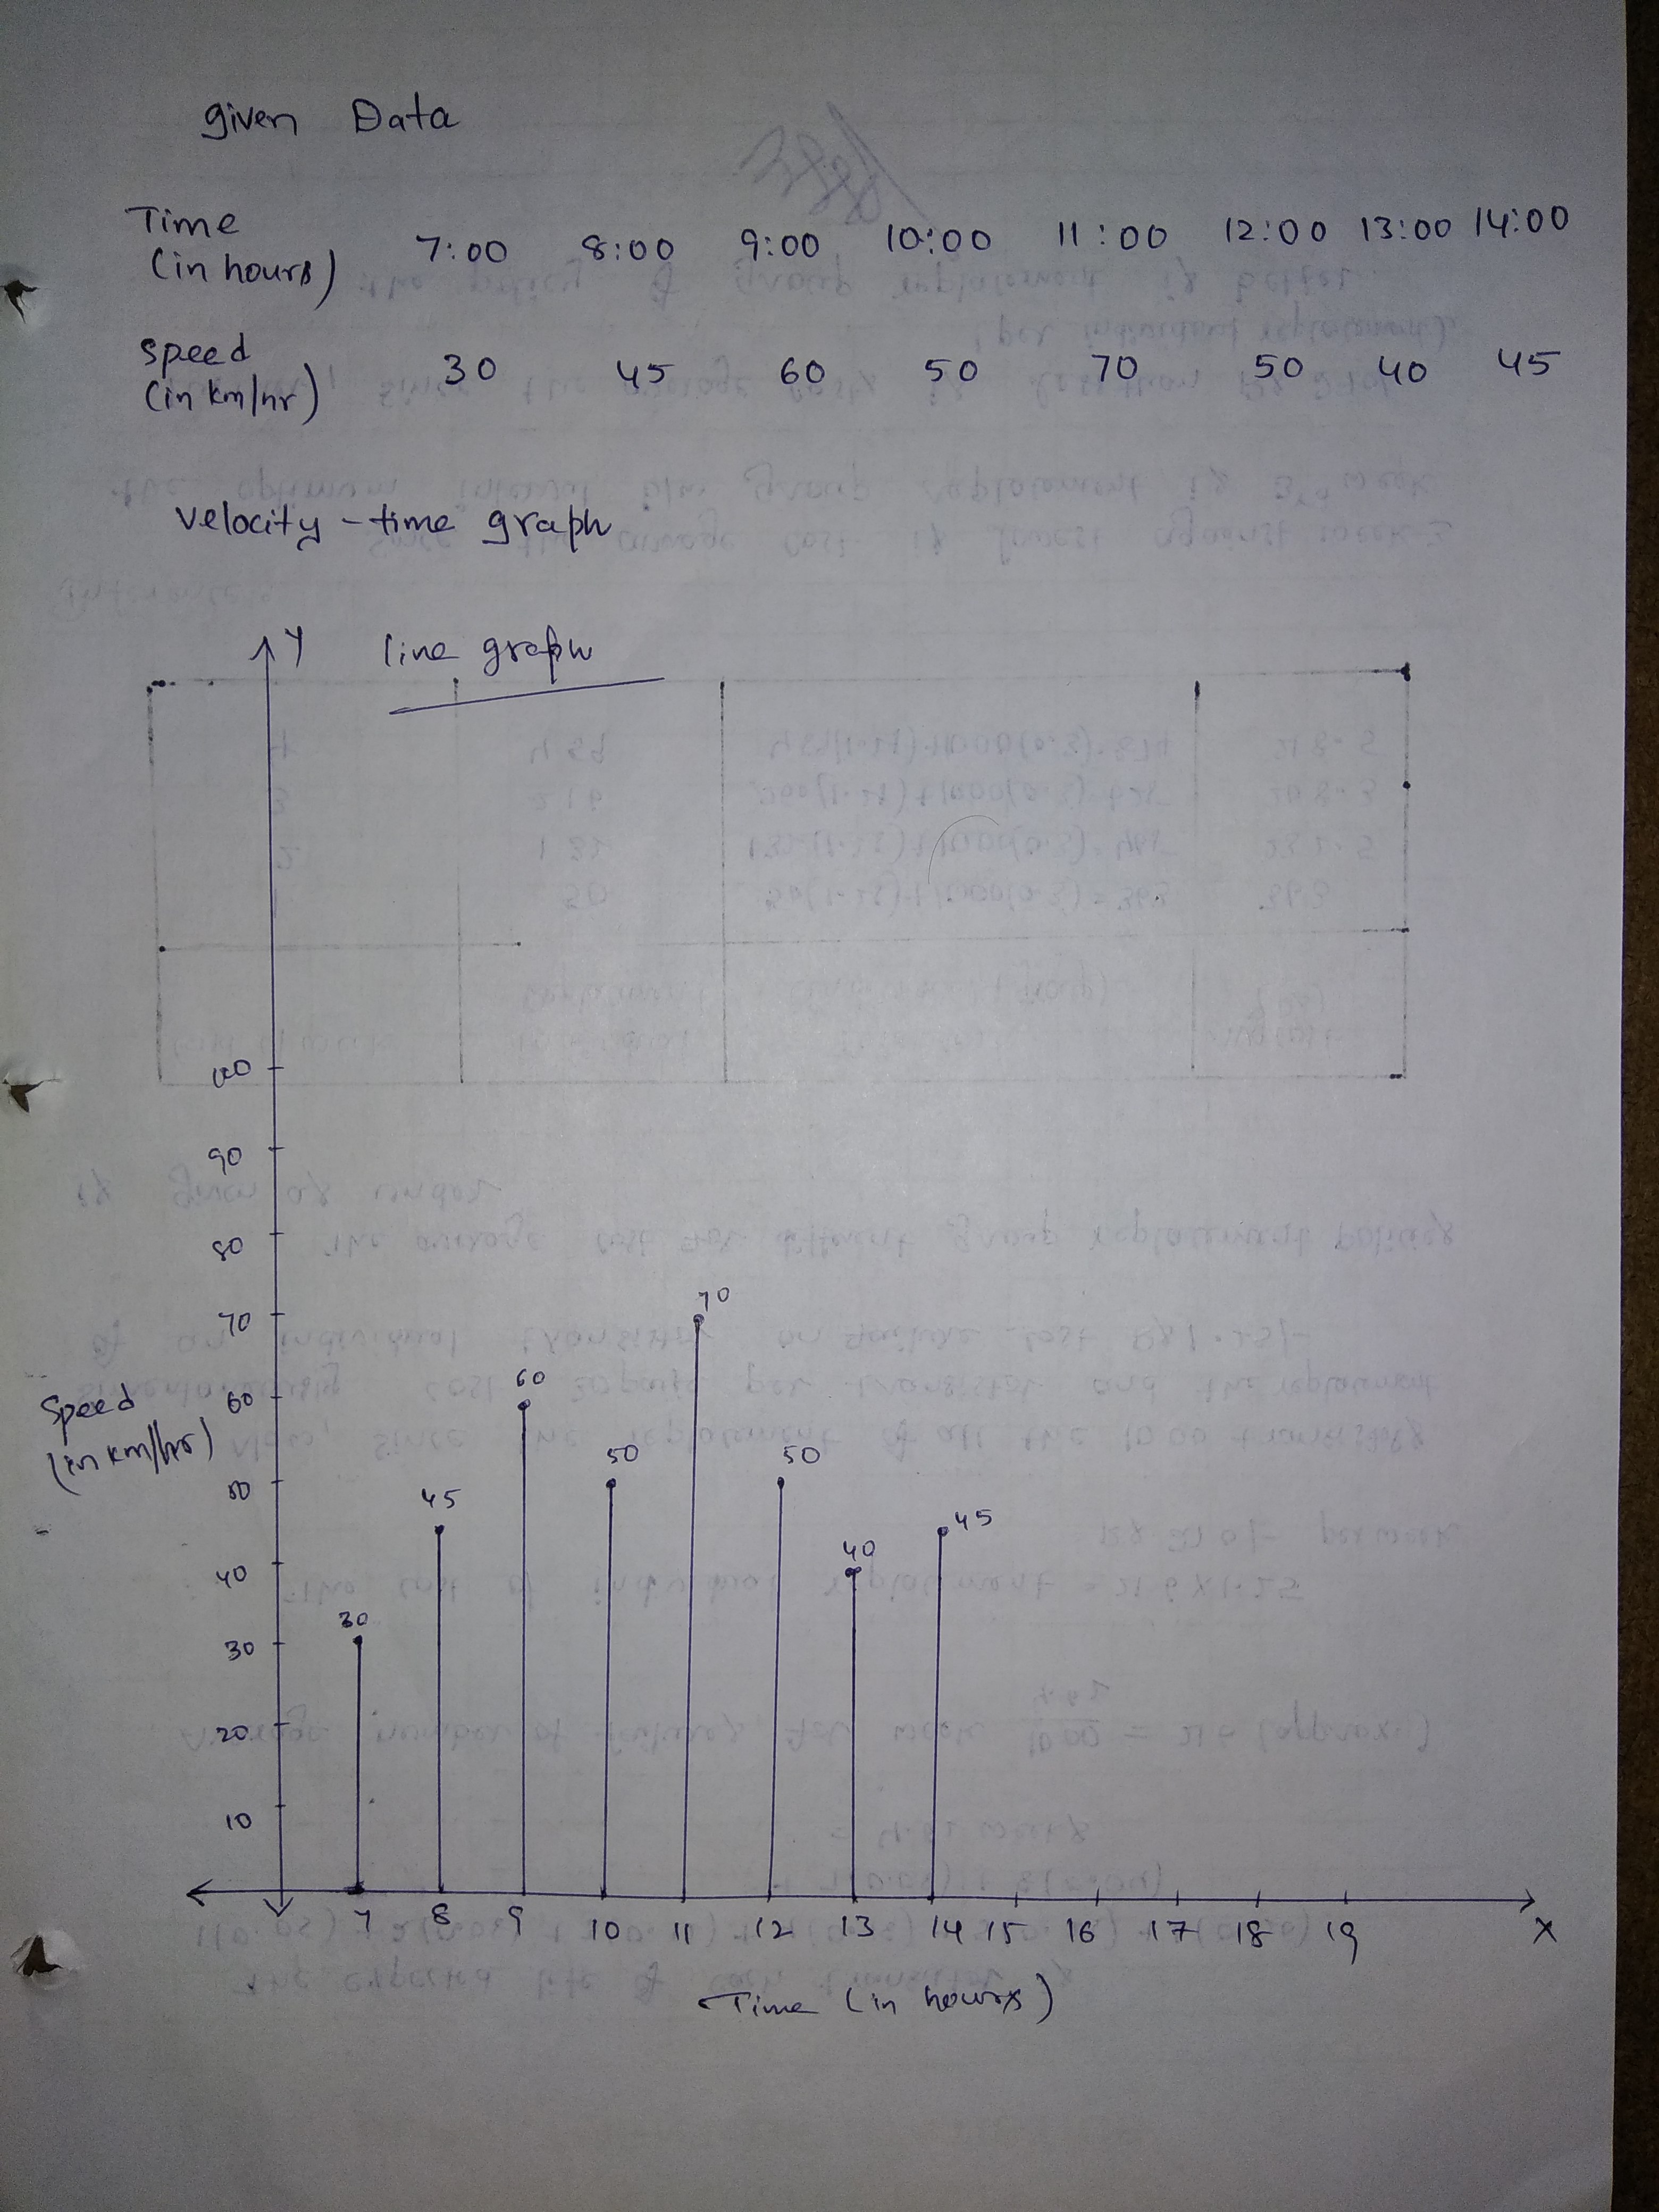
Draw the velocity-time graph from the following data:
| Time(in hours): | $$7:00$$ | $$8:00$$ | $$9:00$$ | $$10:00$$ | $$11:00$$ | $$12:00$$ | $$13:00$$ | $$14:00$$ |
| Speed(in km/hr): | $$30$$ | $$45$$ | $$60$$ | $$50$$ | $$70$$ | $$50$$ | $$40$$ | $$45$$ |
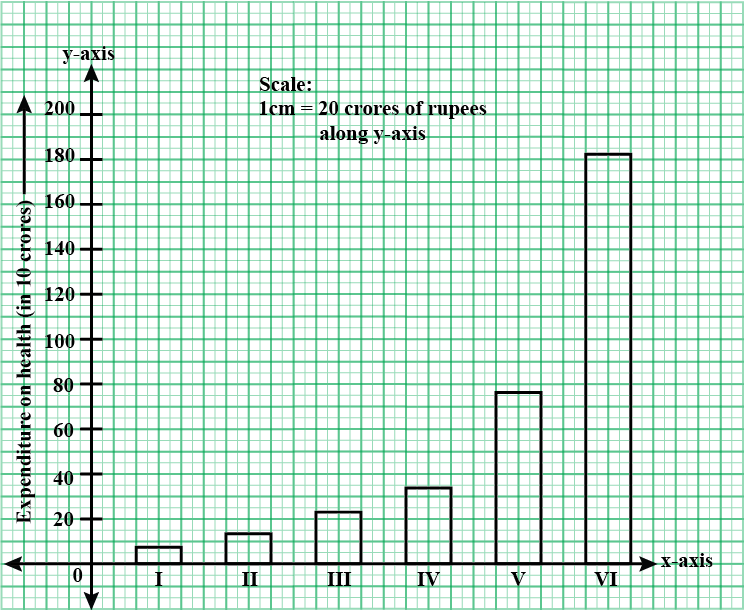
The expenditure (in 10 crores of rupees) on health by the Government of India during the various five year plans is shown below :
| Plans : | $$I$$ | $$II$$ | $$III$$ | $$IV$$ | $$V$$ | $$VI$$ |
| Expenditure on health (in 10 crores of rupees ) | 7 | 14 | 23 | 34 | 76 | 182 |
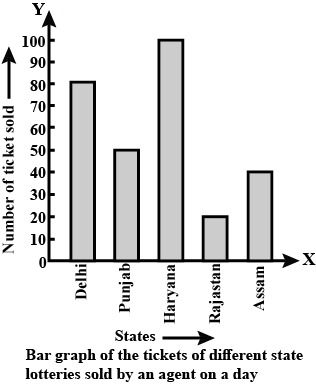
Read the graph given in above fig. and answer the following question:
What is the information given by the bar graph?
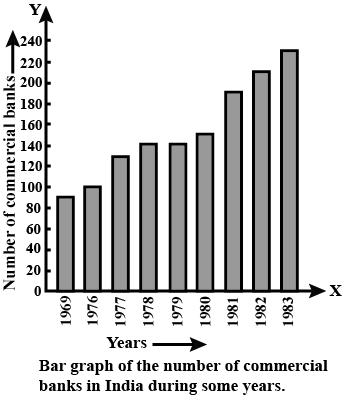
Read the bar graph shown in fig. and answer the following question:
What is the information given by the bar graph?
Read the bar graph shown in Fig. and answer the following questions:
What is the information given by the bar graph?
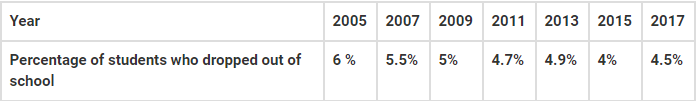
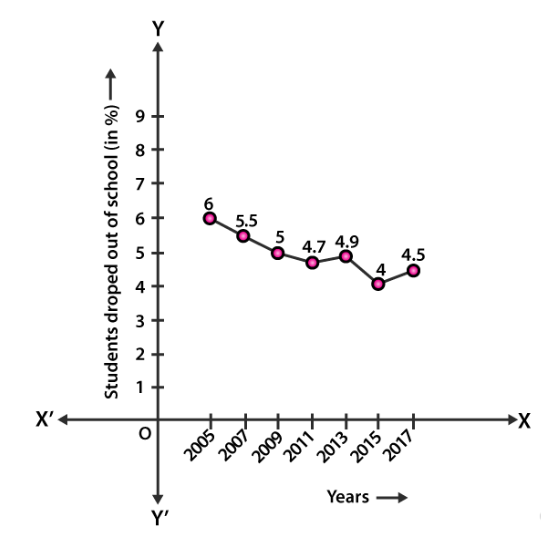
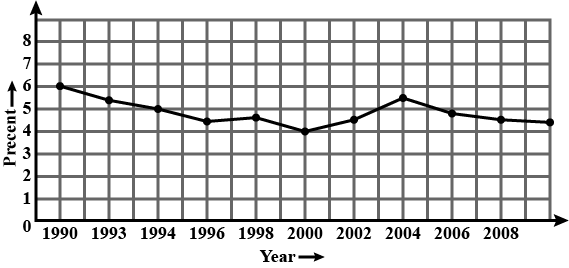
The above table shows the percentage of students who dropped out of school after completing high school.
Study the above table carefully and draw a line graph to depict it.
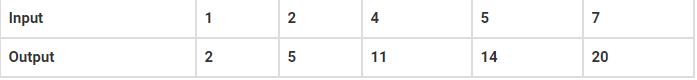
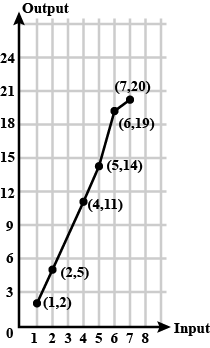
Consider the above input/output table. Draw a line graph for it.
Now, use the graph drawn to predict the outputs for the inputs of $$3$$ and $$8$$
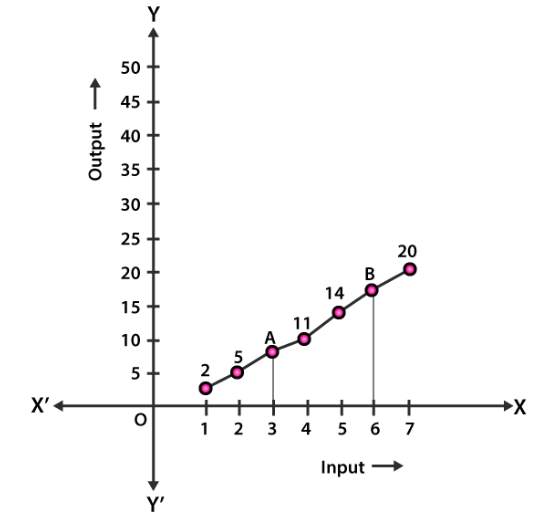
The above table depicts the maximum temperature on the seven days of a particular week. Study the table and draw a line graph for the same.
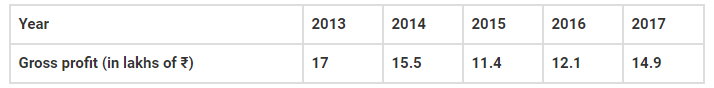
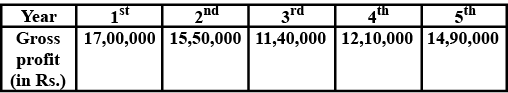
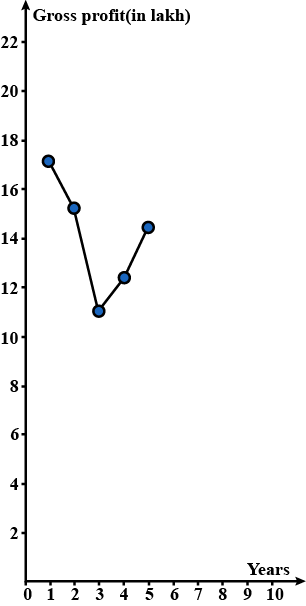
The table given above depicts the annual gross profit of a company for a period of 5 years. Study the table and draw a line graph for the same.
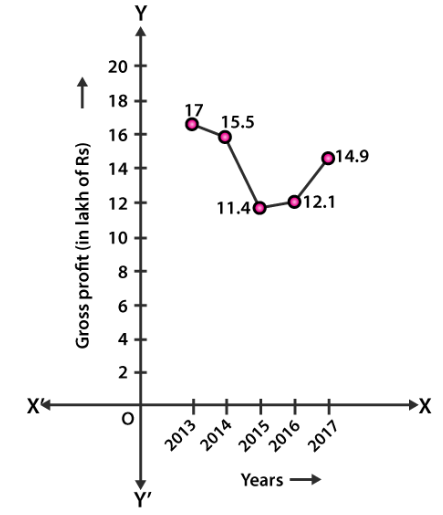
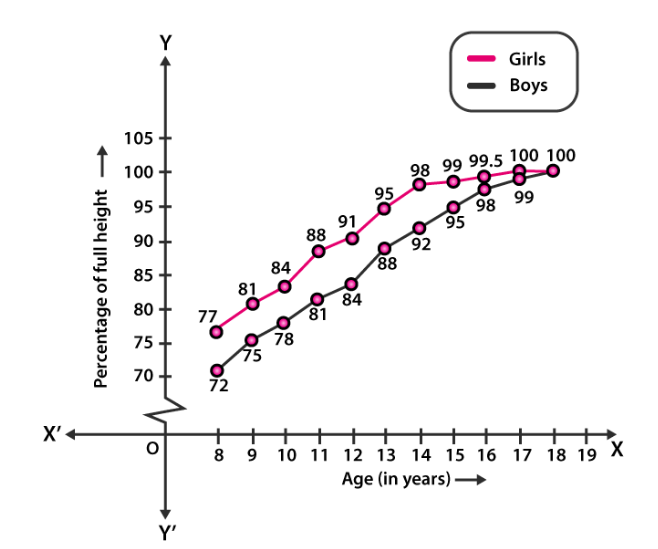
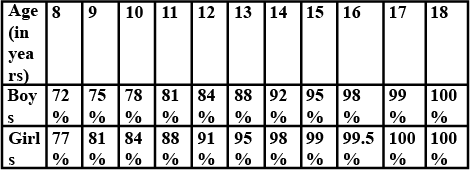
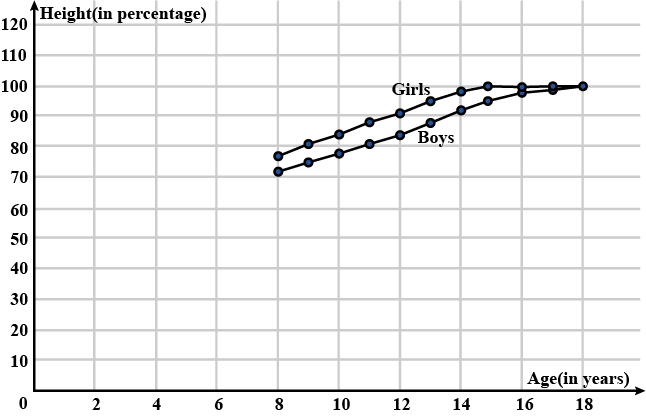
The above chart gives the growth in height in terms of percentage of full height of boys and girls with their respective ages.
Study the table and draw the line graph of the data given above:
Now, use the graph to answer the following questions:
i. In which year both the boys and the girls achieve their maximum height?
ii. Who grows faster at puberty (14 years to 16 years of age)?
For an experiment in botany, two different plants, plant A and plant B, were grown under similar laboratory conditions. Their heights were measured at the end of each week for three weeks. The results are shown by the line graph given above:
Study the above graph carefully and answer the questions given below:
i. How high was plant A after (a) 2 weeks (b) 3 weeks?
ii. How high was plant B after (a) 2 weeks (b) 3 weeks?
iii. How much did plant A grow during the $$3^{rd}$$ week?
iv. How much did plant B grow from the end of the $$2^{nd}$$ week to the end of the $$3^{rd}$$ week?
v. During which week did plant A grow most?
vi. During which week did plant B grow least?
vii. Were the two plants of the same height during any week shown here? Specify
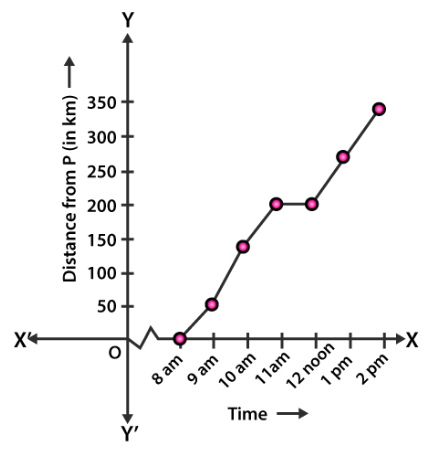
A car is travelling from city P to city Q, which are $$350 \,km$$ apart. The line graph given below describes the distance of the car from the city P at different times.
Study the above graph and answer the questions given below
i.What information is given on the two axes?
ii.From where and when did the car begin its journey?
iii.How far did the car go in the first hour?
iv.How far did the car go during (a) the $$2^{nd}$$ hour (b) the $$3^{rd}$$ hour?
v.Was the speed same during first three hours? How do you know it?
vi.Did the car stop for some duration at any place? Justify your answer.
vii.When did the car reach the city Q?
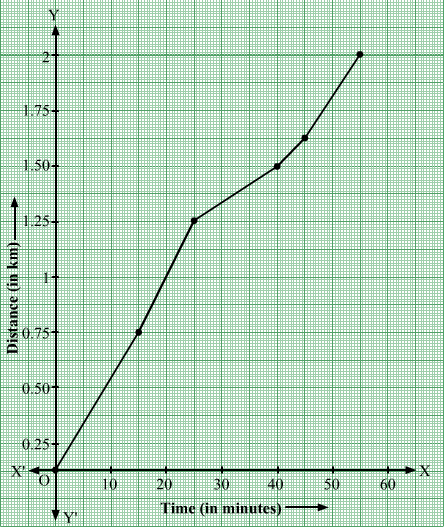
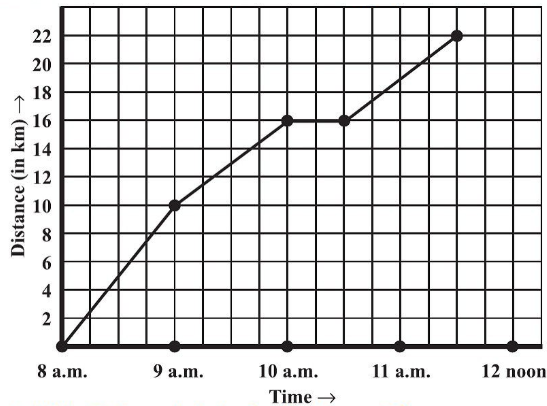
The following is the distance-time graph of Amits walking.
Study the above graph carefully and answer the questions given below:
i. When does Amit make the least progress? Explain your answer.
ii. Find his average speed in km/hr.
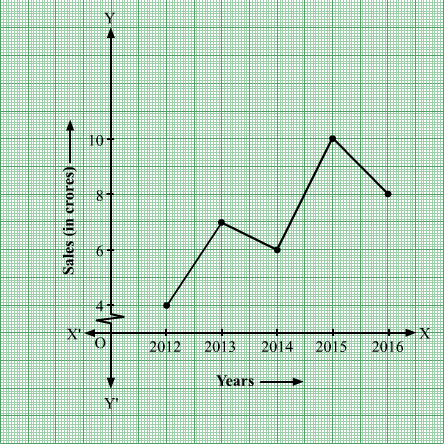
The line graph given above shows the yearly sales figures for a manufacturing company during the last five years.
Study the above graph carefully and answer the questions given below:
i. What were the sales in $$(a) \,2013 \,(b) \,2015 \,(c) \,2016$$
ii. Compute the difference between the sales in $$2012$$ and $$2016$$ ?
iii. In which year was there the greatest difference between the sales as compared to its previous year?
A courier person cycles from a town to a neighboring suburban area to deliver a parcel to a merchant. His distances from the town at different times are shown by the given graph.
Study the above graph carefully and answer the questions given below:
i. What is the scale taken for the time axis?
ii. How much time did the person take for the travel?iii. How far is the place of the merchant from the town?
iv. Did the person stop on his way? Explain.
v. During which period did he ride fastest?
iv. Did the person stop on his way? Explain.
v. During which period did he ride fastest?
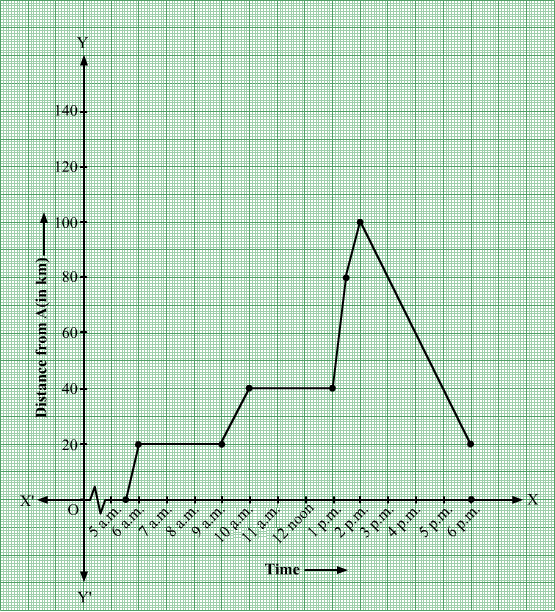
A man started his journey on his car from location A and came back. The graph given below shows his position at different times during the whole journey.
Study the above graph carefully and answer the questions given below:
i. At what time did he start and end his journey?
ii. What was the total duration of the journey?
iii. Which journey, onwards or return, was of longer duration?
iv. For how many hours did he not move?
v. At what time did he have the fastest speed?
The horizontal and vertical lines in a line graph are usually called _______ and ________ .
The total number of people surveyed is_______
The graph given below shows the marks obtained out of $$10$$ by Sonia in two different tests. Study the graph and answer the questions that follow.
In which subject did she score the highest in test l?
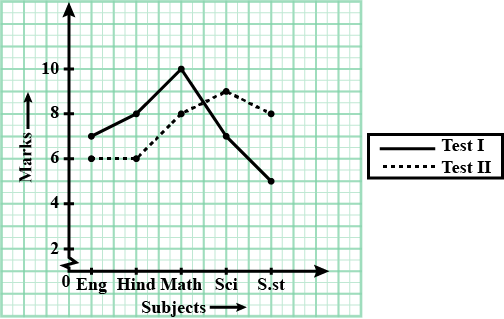
The graph given below shows the marks obtained out of $$10$$ by Sonia in two different tests. Study the graph and answer the questions that follow.
What information is represented by the axes?

The graph given below gives the actual and expected sales of cares of a company for $$6$$ months. Study the graph and answer the questions that follow.
In which month was the actual sales same as the expected sales?

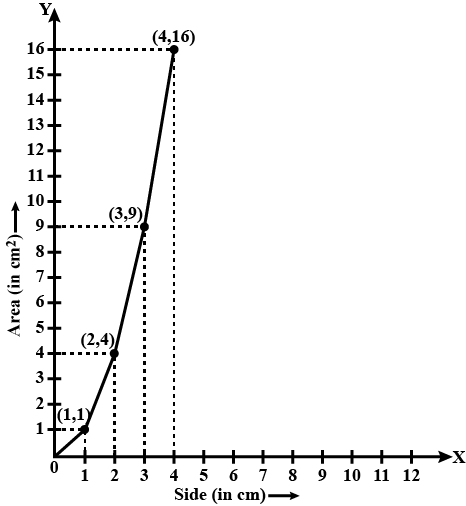
| Side (in $$cm^2$$) | 1 | 2 | 3 | 4 |
| Area (in $$cm^2$$) | 1 | 4 | 9 | 16 |
Is it linear graph?
The graph shows the maximum temperatures recorded for two consecutive weeks of a town. Study the graph and answer the questions that follow.
What information is given by the two axes?

The graph given below gives the actual and expected sales of cars of a company for $$6$$ months. Study the graph and answer the questions that follow.
Find the ratio of sales in the first three months to the last three months.
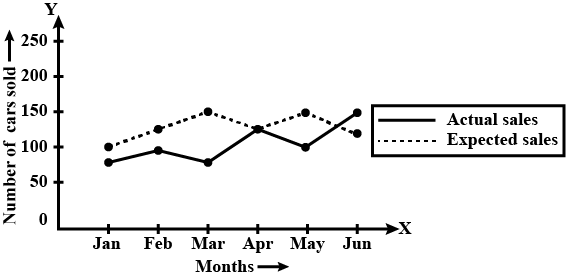
The graph given below gives the actual and expected sales of cares of a company for $$6$$ months. Study the graph and answer the questions that follow.
For which month (s) was (were) the difference in actual and expected sales the least?

The graph shows the maximum temperatures recorded for two consecutive weeks of a town. Study the graph and answer the questions that follow.
In which week was the temperature higher on most of the days?

The graph shows the maximum temperatures recorded for two consecutive weeks of a town. Study the graph and answer the questions that follow.
On which day was the temperature same in both the weeks?
The graph given below gives the actual and expected sales of cares of a company for $$6$$ months. Study the graph and answer the questions that follow.
For which month (s) was (were) the difference in actual and expected sales the maximum?

Study the graph given below of a person who stared from his home and returned at the end of the day. Answer the questions that follow.
Calculate the average speed of the man from (a) A to B (b) B to C

Study the graph given below of a person who stared from his home and returned at the end of the day. Answer the questions that follow.
What was he doing from $$3$$ pm to $$5$$?

Study the graph given below of a person who stared from his home and returned at the end of the day. Answer the questions that follow.
What was the total distance travelled by him throughout the day?

Study the graph given below of a person who started from his home and returned at the end of the day. Answer the following question.
How much distance did he travel in the first four hours of his journey?

Study the graph given below of a person who stared from his home and returned at the end of the day. Answer the questions that follow.
Calculate the distance croved by him in the first $$8$$ hours of his journey.

The graph given below shows the marks obtained out of $$10$$ by Sonia in two different tests. Study the graph and answer the questions that follow.
In which subject did she score the least in test ll ?

The graph given below shows the marks obtained out of $$10$$ by Sonia in two different tests. Study the graph and answer the questions that follow.
In which test was the performance better?
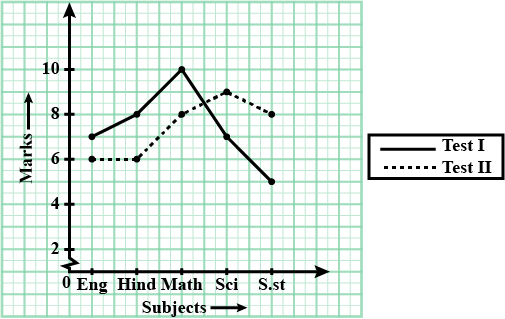
The graph given below shows the marks obtained out of $$10$$ by Sonia in two different tests. Study the graph and answer the questions that follow.
In which subject and which test did she score full marks?

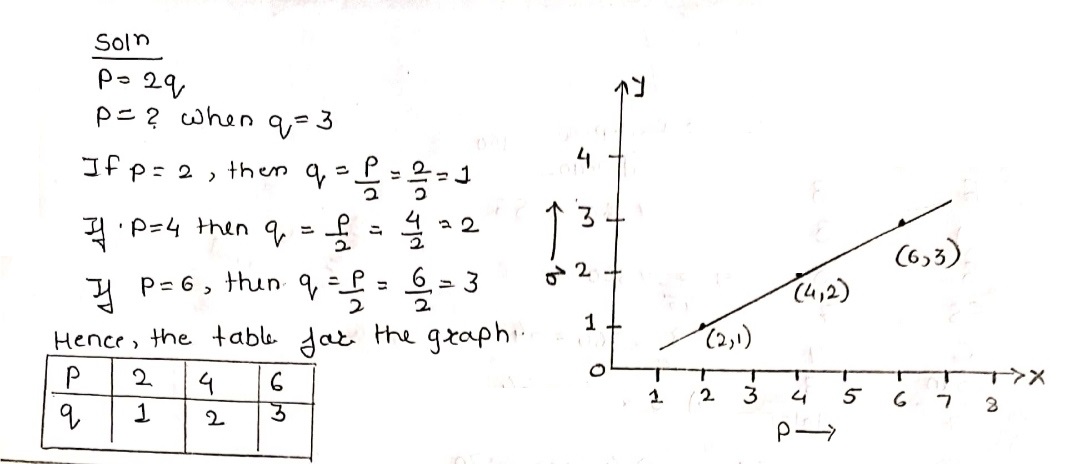
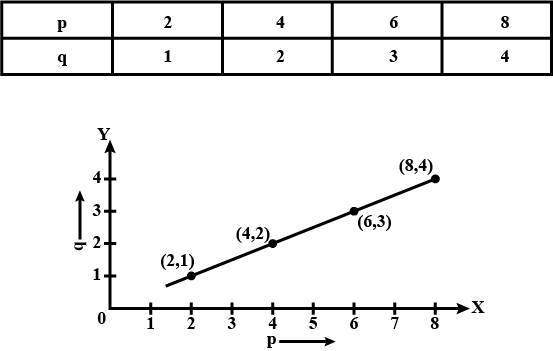
Plot a line graph for the variables $$p$$ and $$q$$ where $$p$$ is two times $$q$$ i.e, the equation is $$p =2q$$. Then find the value of p when $$q = 3$$
The graph given below shows the marks obtained out of $$10$$ by Sonia in two different tests. Study the graph and answer the questions that follow.
In which subject did she score the same marks in both the Tests?

The following table gives the growth chart of a child.
Draw a line graph for the table and answer the questions that follow.
What is the height at the age of 5 years?
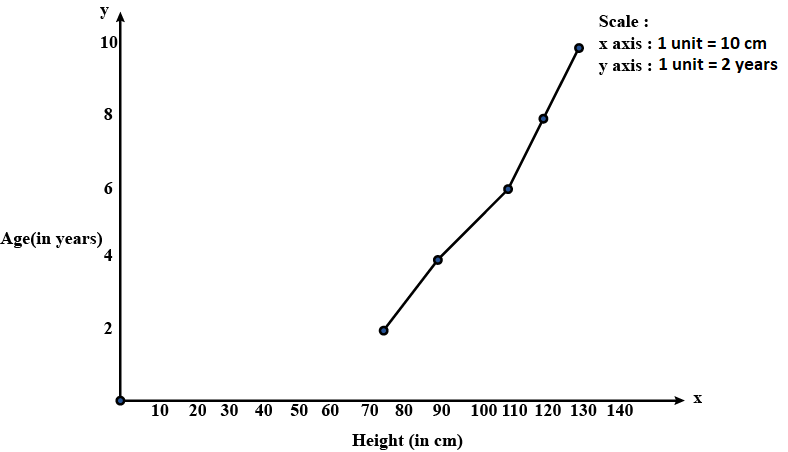
The following is the time-distance graph of Sneha's walking
When does Sneha make the least progress ? Explain your reasoning.
The graph given below compares the sales of ice creams of two vendors for a week.
Observe the graph and answer the following questions.
On which two days was the sales same for vendor B?

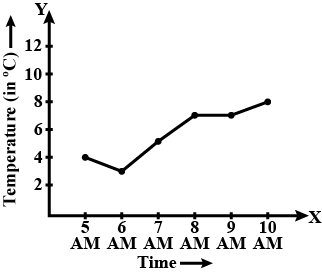
The table given below shows the temperatures recorded on a day at different times.
Observe the table and answer the following questions.
What is the change in temperature between $$7$$ am and $$10$$ am?
The graph given below compares the sales of ice creams of two vendors for a week.
Observe the graph and answer the following questions.
On which day did the sale of vendor A increase the most as compared to the previous day?

The table given below shows the temperatures recorded on a day at different times.
Observe the table and answer the following questions.
During which hour did the temperature fall?

Plot a line graph for the variables $$p$$ and $$q$$ where $$p$$ is two times $$q$$ i.e, the equation is $$p=2q$$. Then find the value of $$q$$ when $$p=8$$.
The graph given below compares the sales of ice creams of two vendors for a week.
Observe the graph and answer the following questions.
For which day was the sales same for both the vendors?
The following graph shows the change in temperature of a block of ice when heated. Use the graph to answer the following questions:
For how long was there a change in temperature?

The following graph shows the change in temperature of a block of ice when heated. Use the graph to answer the following questions:
For how many second did the ice block have no change in temperature?

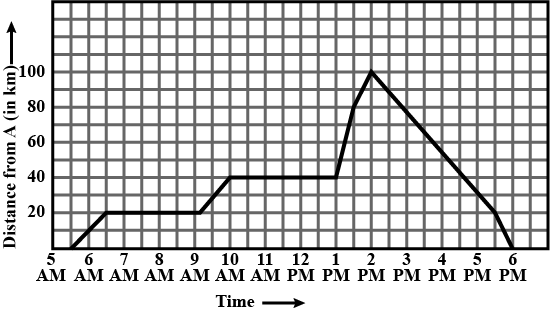
A man started his journey on his car from location A and came back. The given graph shows his position at different times during the whole journey.
What was the total duration of journey?
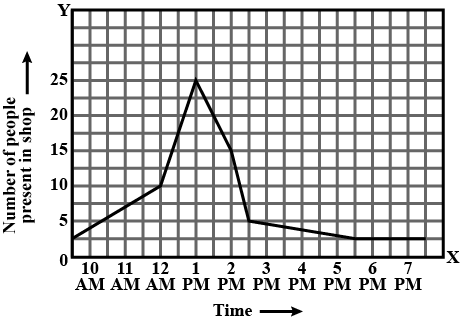
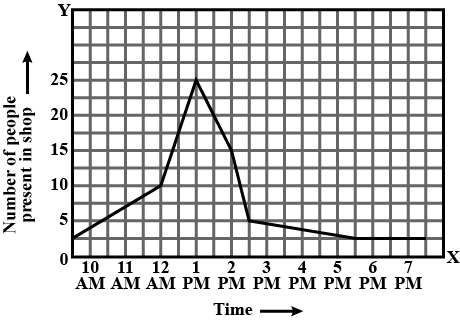
The following graph shows the number of people present at a certain at different times. Observe the graph and answer the following questions.
What is the busiest time of day at the shop?

A man started his journey on his car from location A and came back. The given graph shows his position at different times during the whole journey.
At what time did he start and end his journey?

The following graph shows the number of people present at a certain at different times. Observe the graph and answer the following questions.
What type of a graph is this?
A man started his journey on his car from location A and came back. The given graph shows his position at different times during the whole journey.
Which journey, forward of return, was of longer duration?
The following graph shows the number of people present at a certain at different times. Observe the graph and answer the following questions.
What information does the graph give?

The following graph shows the change in temperature of a block of ice when heated. Use the graph to answer the following questions:
What was the temperature after $$25$$ seconds?
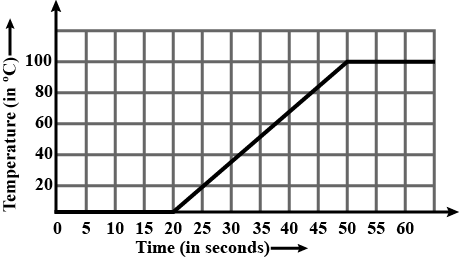
The following graph shows the change in temperature of a block of ice when heated. Use the graph to answer the following questions:
What will be the temperature after $$1.5$$ minutes?
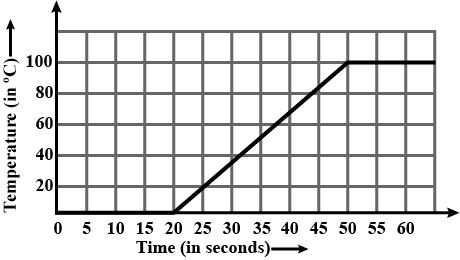
The following graph shows the change in temperature of a block of ice when heated. Use the graph to answer the following questions:
After how many seconds of heating did the temperature become constant at $$100^{o}$$C?

The following graph shows the number of people present at a certain at different times. Observe the graph and answer the following questions.
How many people are there in the shop at $$1.30$$ pm?
A man started his journey on his car from location A and came back. The given graph shows his position at different times during the whole journey.
For how many hours did he not move?

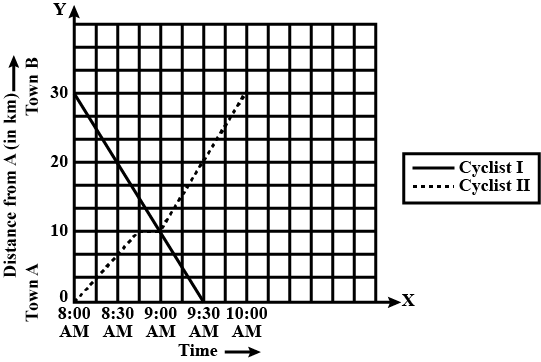
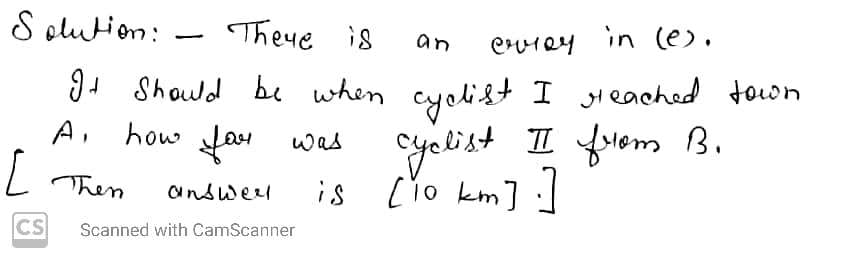
The following graph shows the journey made by two cyclists, one from A to B and The other from town B to A.
at what time did the two cyclists meet?

The table shows the data collected for Dhruv's walking pn a road
Plot a line graph for the given data using suitable sacle.
In what time periods did Dhruv make the most progress?
A man started his journey on his car from location A and came back. The given graph shows his position at different times during the whole journey.
At what time did he have the fastest speed?

The following chart gives the growth in hight in terms of percentage of full height of boys and girls with their respective ages.
Draw the line graph of above data on the same sheet and answer the following questions.
In which year both the boys and the girls achieve their maximum height?
The following graph shows the journey made by two cyclists, one from A to B and The other from town B to A.
How far had cyclist ll travelled when he met cyclist l ?
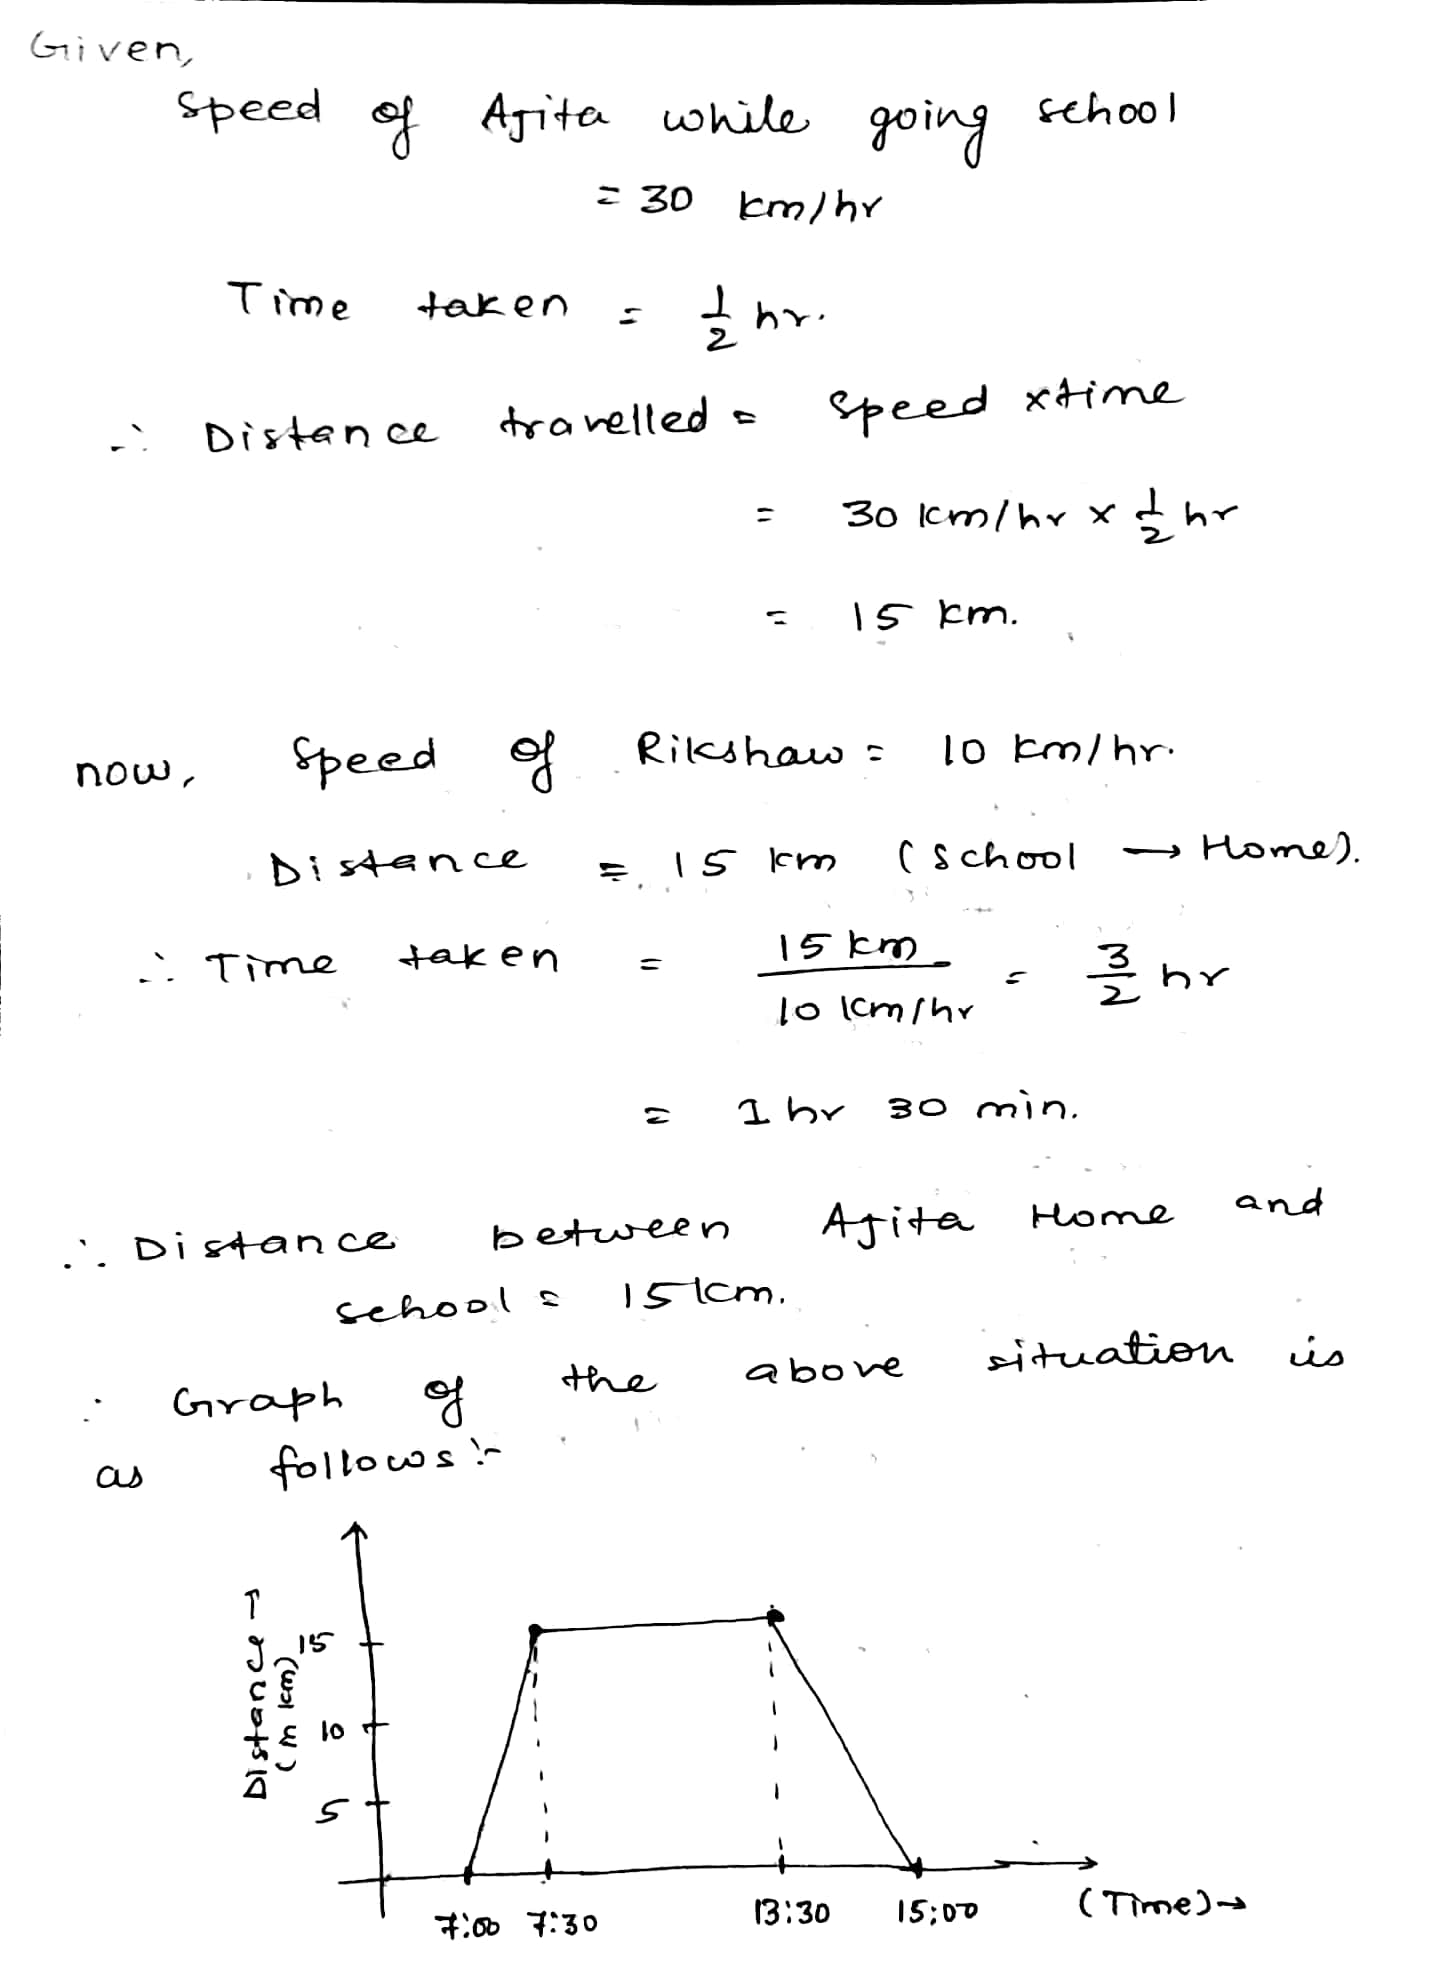
Ajita starts off home at $$7.00$$ hours with her father oon a scooter that goes at a uniform speed of $$30$$ km/h and drops her school after half an hour she stays in the school till $$13.30$$ hours and takes an auto rickshaw to return home the rickshaw has a uniform speed of 10 km/h. Draw the graph for the above situation and also determine the distance of Ajita's school from her house.
Draw the line graph suitable scale to how the annual gross profit of a company for a period of five years.
The following graph shows the journey made by two cyclists, one from A to B and The other from town B to A.
At what time did cyclist ll rest? How long the cyclist rest?

The following chart gives the growth in hight in terms of percentage of full height of boys and girls with their respective ages.
Draw the line graph of above data on the same sheet and answer the following questions.
Who grows faster at puberty $$(14$$ years to $$16$$ years of age)?


Input 1 2 4 5 7 Output 2 5 11 14 20
Consider this input/output table.
Use your graph to predict the outputs for inputs of 3 and 8.
| Input | 1 | 2 | 4 | 5 | 7 |
| Output | 2 | 5 | 11 | 14 | 20 |
In the previous question, by plotting the graph of input and output we figured out that the graph follows the line y = 3x - 1.
| Input | 3 | 8 |
| Output | 8 | 23 |
This graph shows the percent of students who dropped out of school after completing High School. The point labeled A shows that, in 1996, about $$4.7%$$ of students dropped
About what percent of students dropped out of high school in 2007? About what percent of students stayed in high school in 2008?
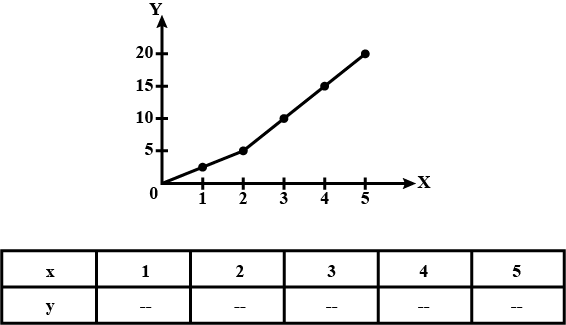
Observe the given graph carefully and complete the table given below.
This graph shows the percent of students who dropped out of school after completing High School. The point labeled A shows that, in 1996, about $$4.7%$$ of students dropped
In which year was the dropout the rate highest? In which year was it the lowest?

This graph shows the percent of students who dropped out of school after completing High School. The point labeled A shows that, in 1996, about $$4.7%$$ of students dropped
When did the percent of students who dropped out of high school first fall below $$5%$$?
Find the quartile deviation and coefficient of quartile deviation of the following data.
$$ 3 , 8, 11, 13, 17, 19, 20 , 22, 23, 27, 31$$
For any variable series $$Q_{1} 61 $$ and $$ Q_{3} = 121 $$. Find the quartile deviation
Write the formula of quartile deviation
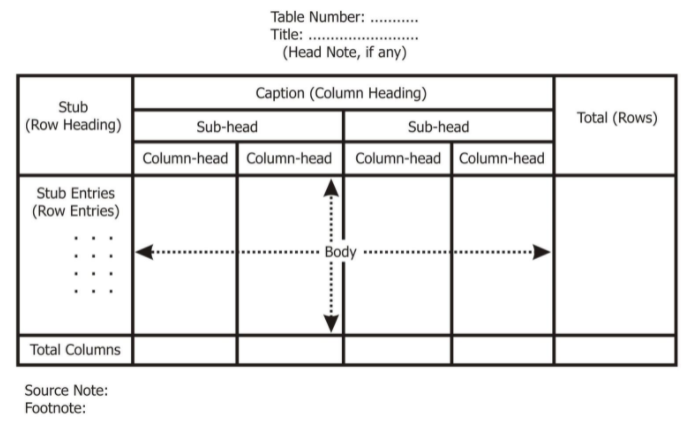
Explain any two requisites of a good table. Also draw a specimen table and label it properly.
- The essentials of good tables includes: headings, abbreviations, footnote and total in table. In singular form heading should be written.
- In heading abbreviation should not be used in heading, footnote should be used if necessary and in the ending of per row sub-total should be used.
- Following is a specimen table with proper labeling.
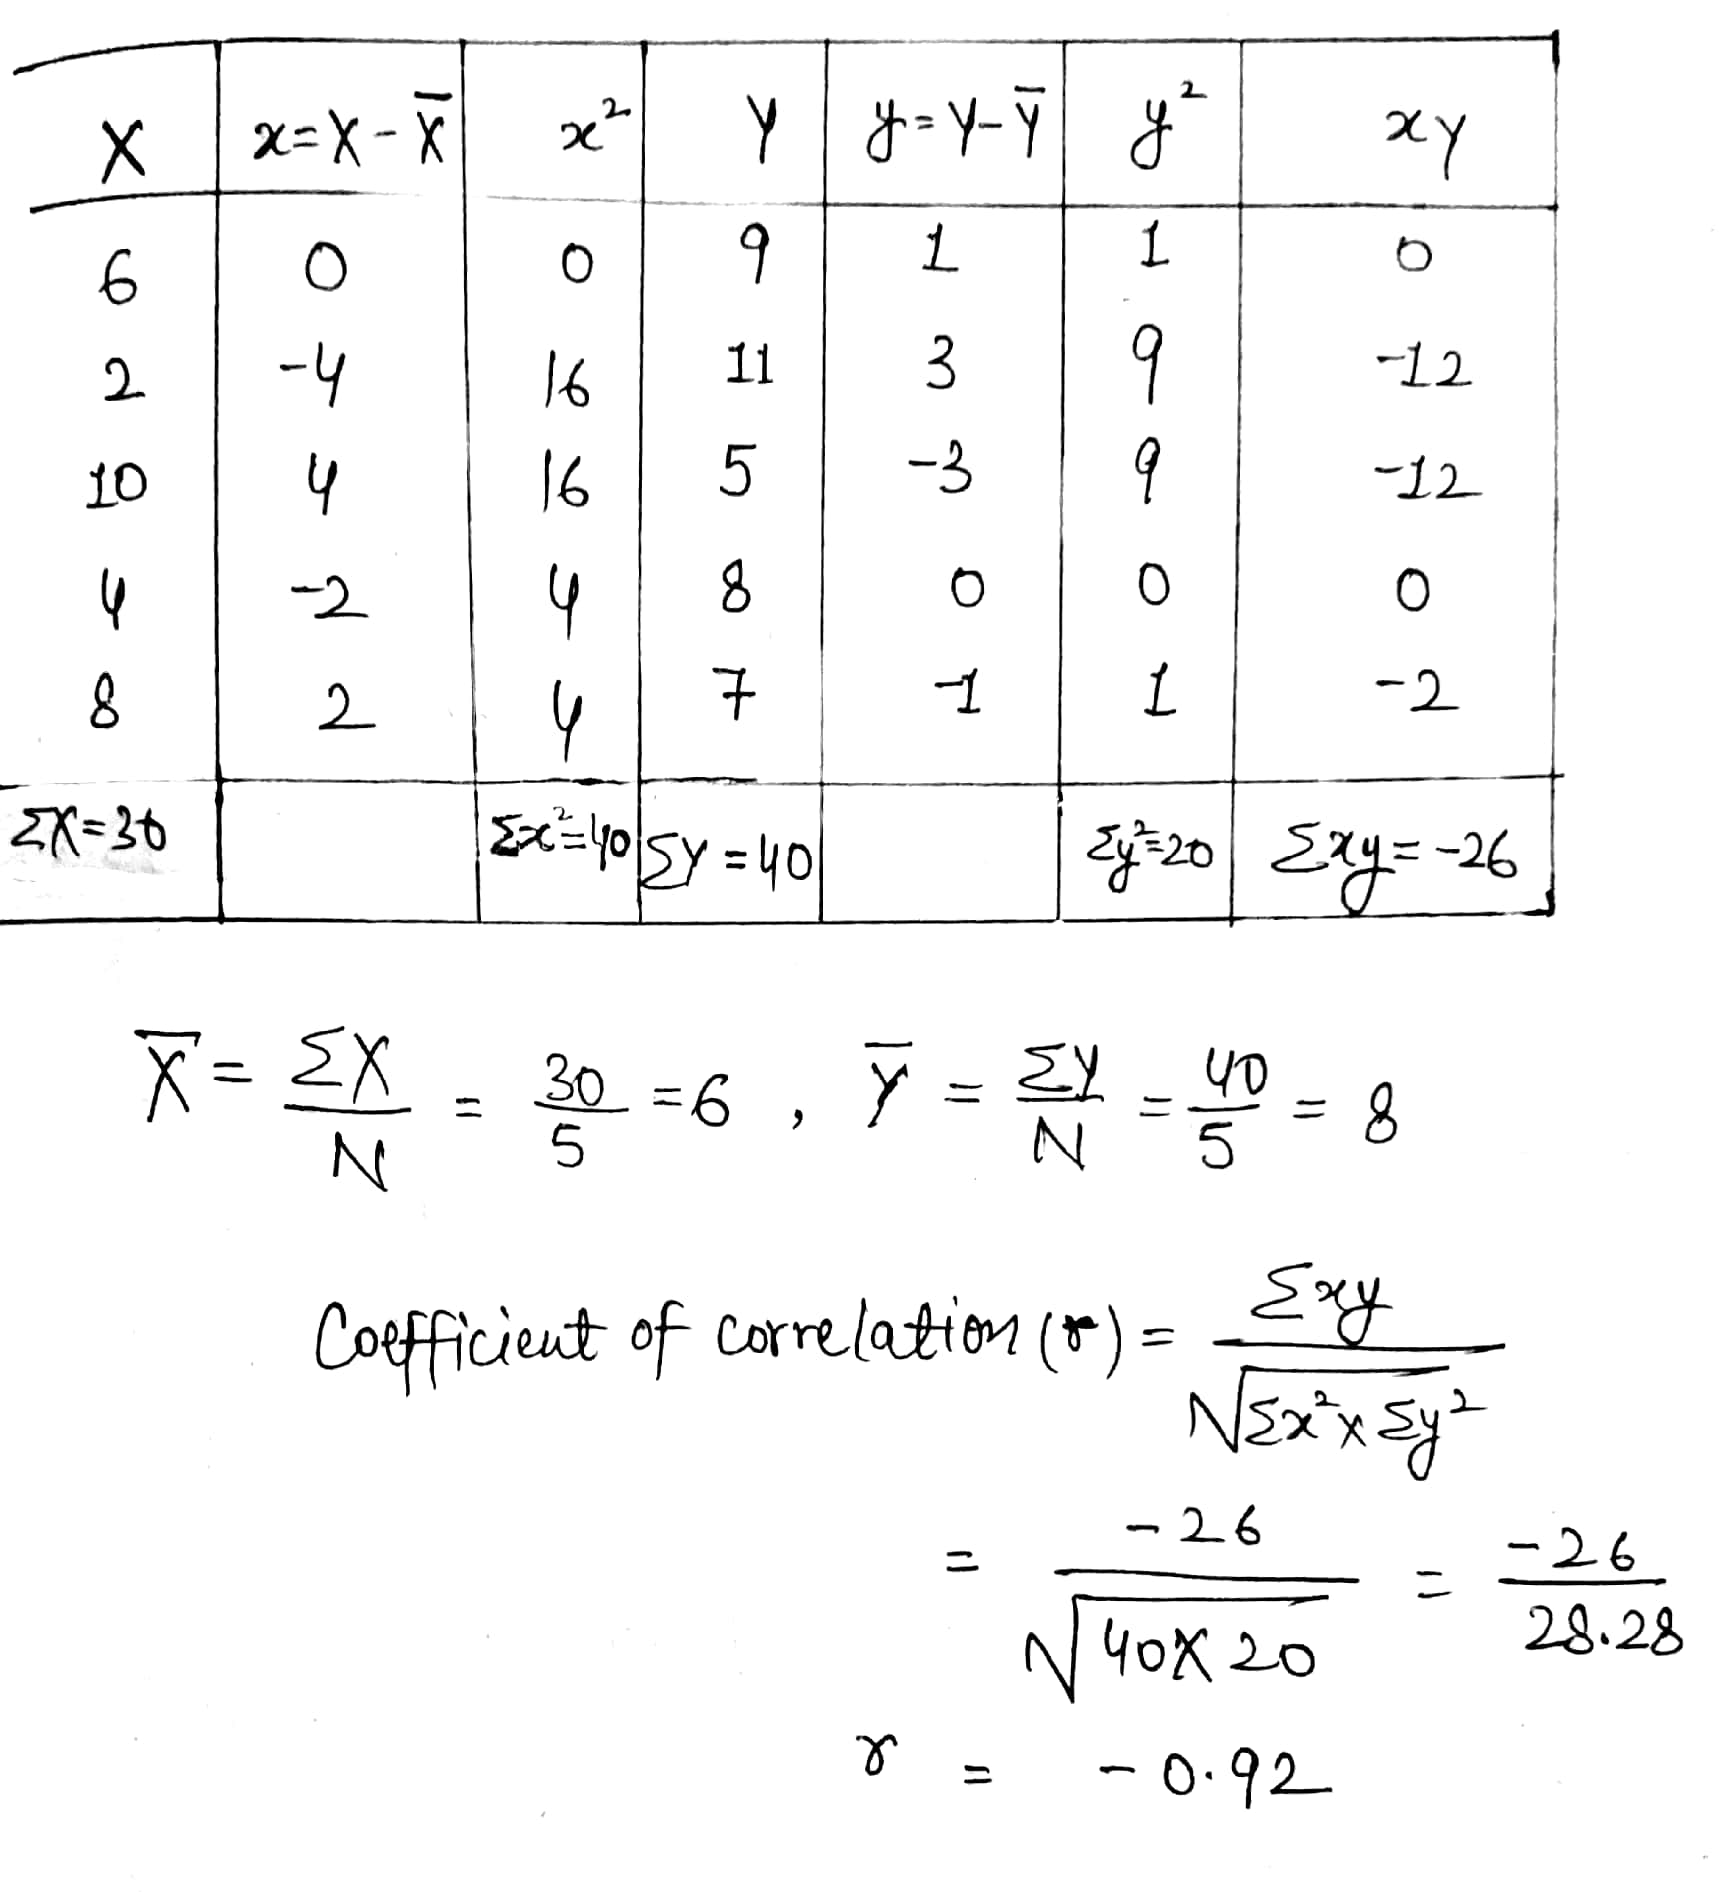
| X | 6 | 2 | 10 | 4 | 8 |
| Y | 9 | 11 | 5 | 8 | 7 |
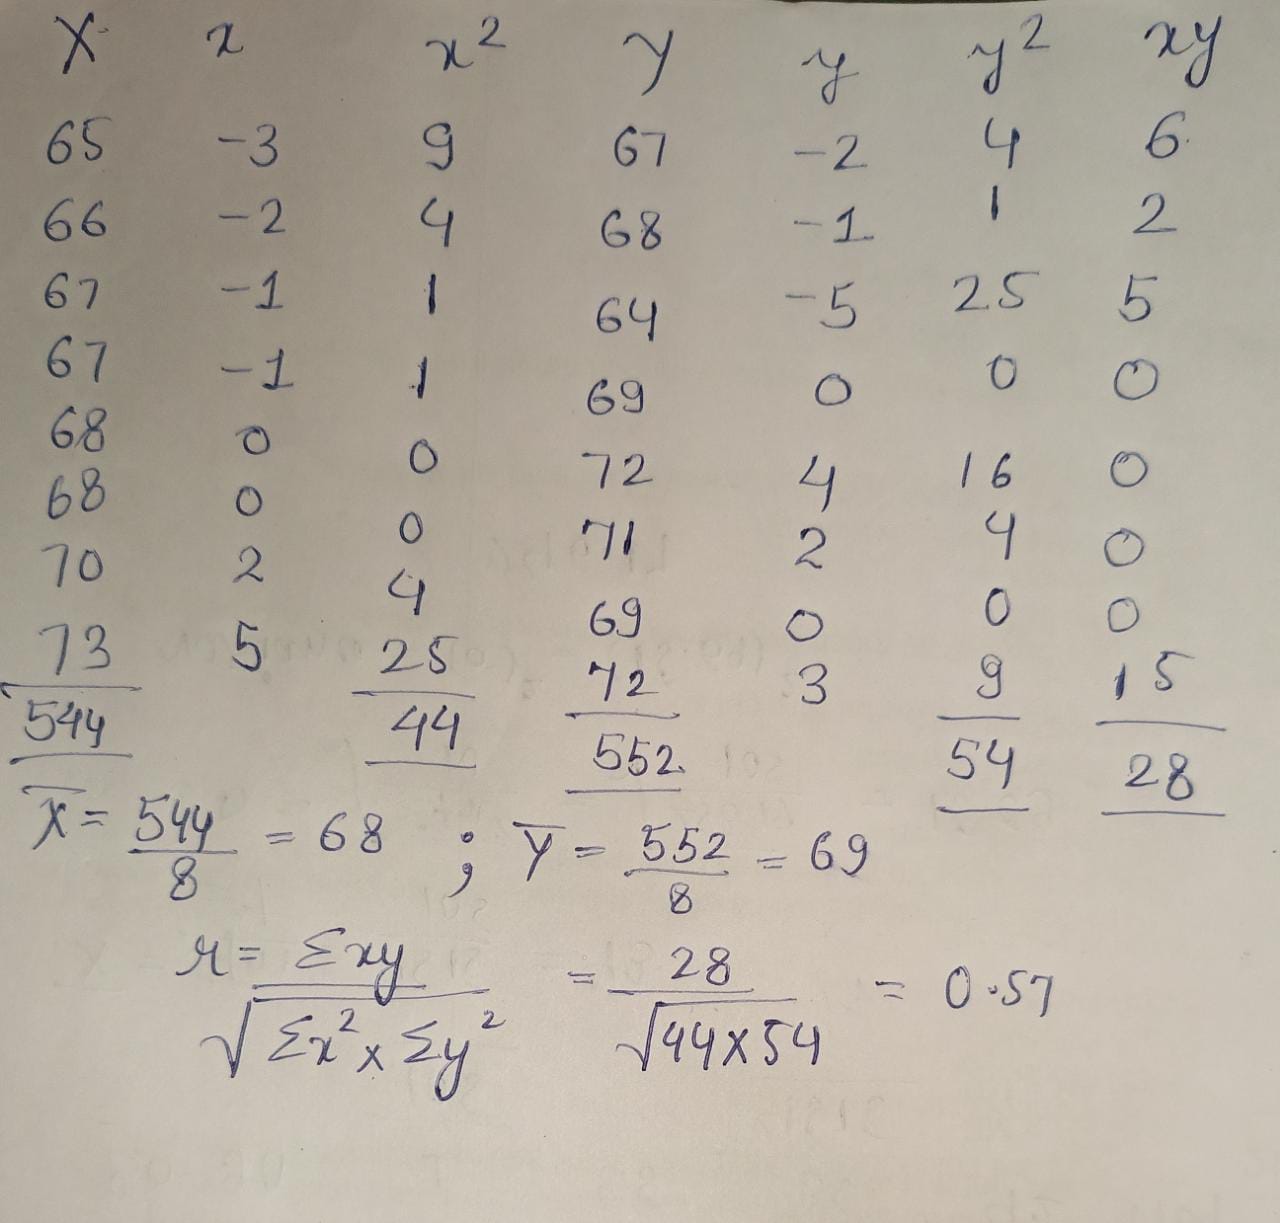
The heights of a group of fathers and son are given below:
| Height of father (in inches) | 65 | 66 | 67 | 67 | 68 | 68 | 70 | 73 |
| Height of son (in inches) | 67 | 68 | 64 | 69 | 72 | 71 | 69 | 72 |
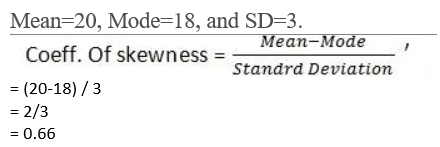
Calculate Karl Pearson coefficient of skewness when mean=20, mode=18, and SD=3.
Define dispersion.
Read the following passage and answer the given questions,
Karl Pearson (1867-1936) was the first person to give mathematical formula for
measuring the degree of relationship between two variables inThe Karl Pearson's coefficient of correlation is also known as 'Product Moment Correlation' or 'Simple Correlation Coefficient". It is the most popular and widely used method to calculate the correlation coefficient. It is denotes by (r is a pure number, i.e it has no unit).
i) Name the first person to give mathematical formula for measuring the degree of
relationship between two variables in 1980.ii) The Karl Pearson's coefficient of correlation is also known as _________
or ____________.
A measure of dispersion is a good supplement to the central value in understanding a frequency distribution. Comment.
Find the quartilc deviation of $$6, 12, 14, 16,18, 20$$ and $$24$$
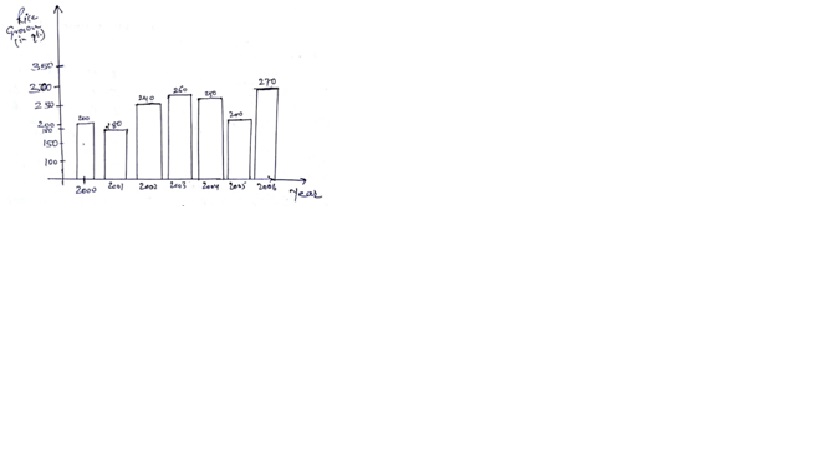
The following table shows the amount of rice grown by a farmer in different years:
| Years | Rice grown (in qt.) |
| 2000 | 200 |
| 2001 | 180 |
| 2002 | 240 |
| 2003 | 260 |
| 2004 | 250 |
| 2005 | 200 |
| 2006 | 270 |
|
Year |
2000 |
2001 |
2002 |
2003 |
2004 |
2005 |
2006 |
|
Rice grown(in qty) |
200 |
180 |
240 |
260 |
250 |
200 |
270 |
What are the different types of table?
What do you mean by "Tabulation of data"?
In a bar graph, the height of a bar is proportional to the ________
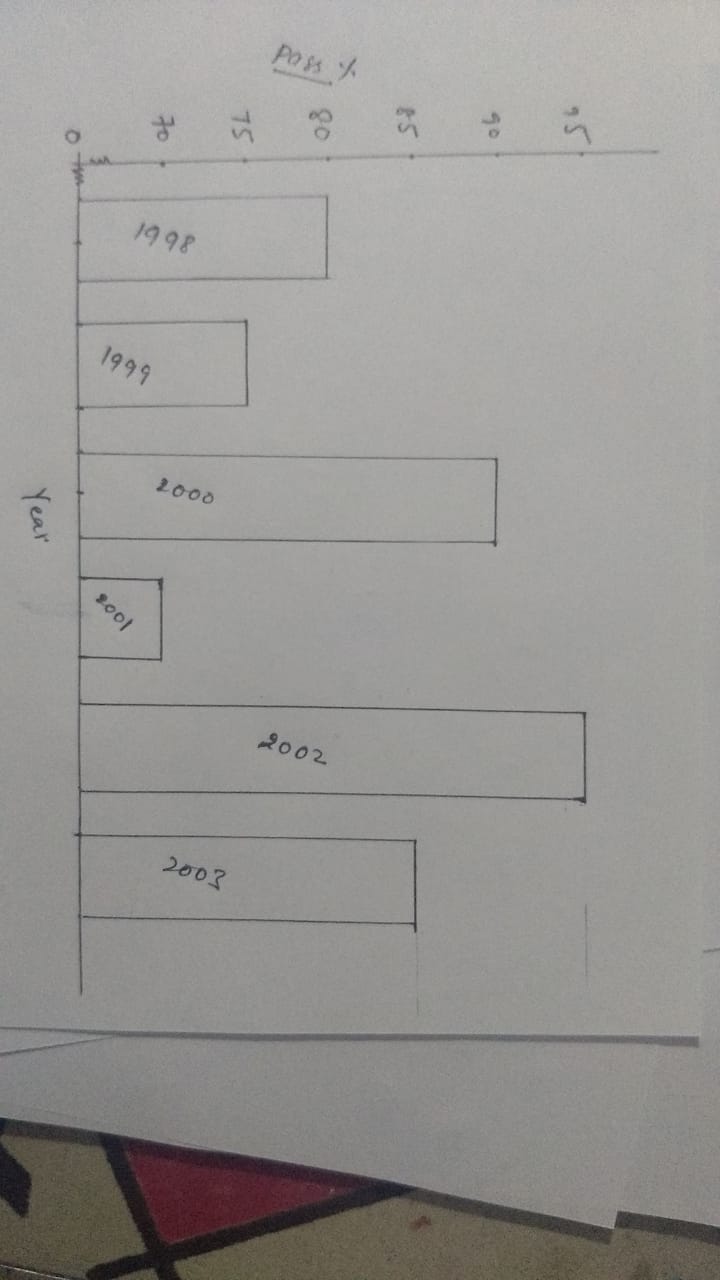
Draw a bar chart of the data representing pass $$\%$$ of students during the period $$1998-2003$$ given below :
| Year | 1998 | 1999 | 2000 | 2001 | 2002 | 2003 |
| Pass % | 80% | 75% | 90% | 70% | 95% | 85% |
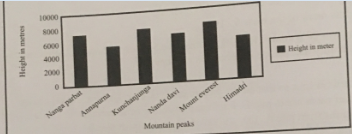
Which is the highest peak and what is it's height?
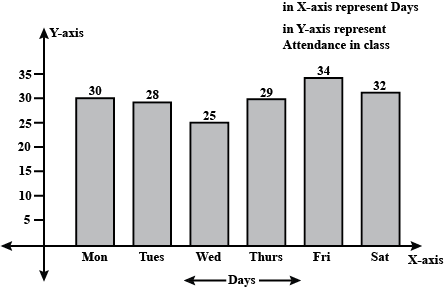
Draw bar graphs to show the following:
| Days | Attendance in Class |
| Mon. | 30 |
| Tues. | 28 |
| Wed. | 25 |
| Thurs. | 29 |
| Fri. | 34 |
| Sat. | 32 |
Write the height of the given peaks in ascending order.

Which peak is second highest and what is its height ?

The final marks in mathematics of 30 students are as follows:
$$53,61,48,60,78,68,55,100,67,90$$
$$75,88,77,37,84,58,60,48,62,56$$
$$44,58,52,64,98,59,70,39,50,60$$
What is the highest score?
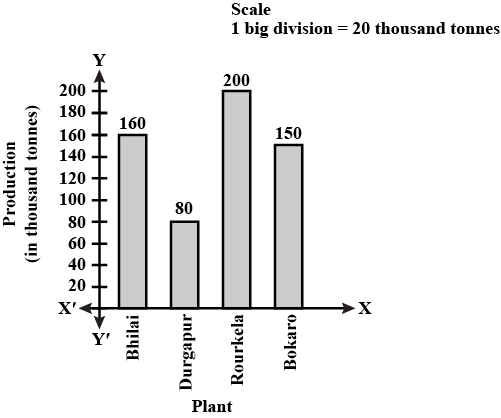
The production of saleable steel in some of the steel plants of our country during 1999 is given below:
| Plant | Bhilai | Durgapur | Rourkela | Bokaro |
| Production (In thousand tonnes) | 160 | 80 | 200 | 150 |
The weights of new born babies (in kg) in a hospital on a particular day are as follows:
$$2.3,2.2,2.1,2.7,2.6,3.0,2.5,2.9,2.8,3.1,2.5,2.8,2.7,2.9,2.4$$
How many babies weigh below 2.5 kg?
In a mathematics test following marks were obtained by 40 students of class VI. Arrange these marks in a table using, tally marks.
8 1 3 7 6 5 5 4 4 2
4 9 5 3 7 1 6 5 2 7
7 3 8 4 2 8 9 5 8 6
7 4 5 6 9 6 4 4 6 6
How many students obtained marks below 4?
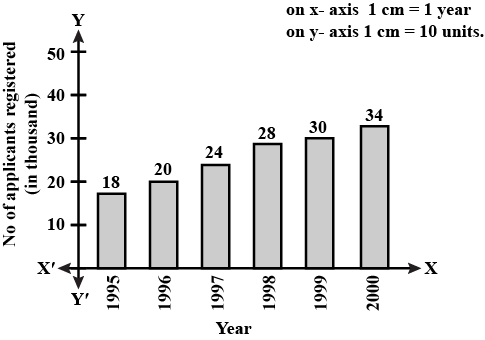
The following data gives the number (in thousands) of applicants registered with an Employment Exchange during. 1995-2000:
| year | 1995 | 1996 | 1997 | 1998 | 1999 | 2000 |
| Number of applicants registered (in thousands) | 18 | 20 | 24 | 28 | 30 | 34 |
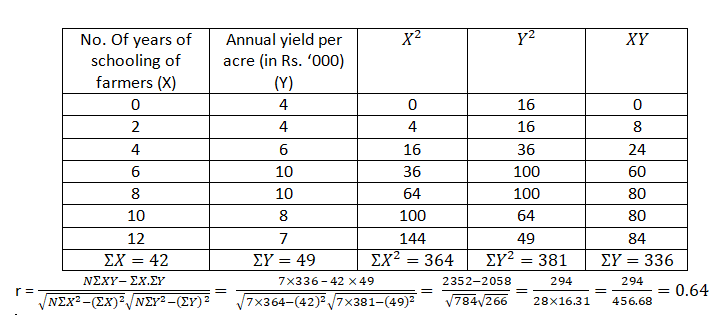
Calculate the Karl Pearson's coefficient of correlation between years of schooling of farmers and the annual yield per acre in (Rs.000).
| No. of years of schooling of farmers | Annual yield per acre (in Rs.'000) |
| 0 | 4 |
| 2 | 4 |
| 4 | 6 |
| 6 | 10 |
| 8 | 10 |
| 10 | 8 |
| 12 | 7 |
The following graph shows the journey made by two cyclists, one from A to B and The other from town B to A.
When cyclist ll reached town A, how far was cyclist l from town B?

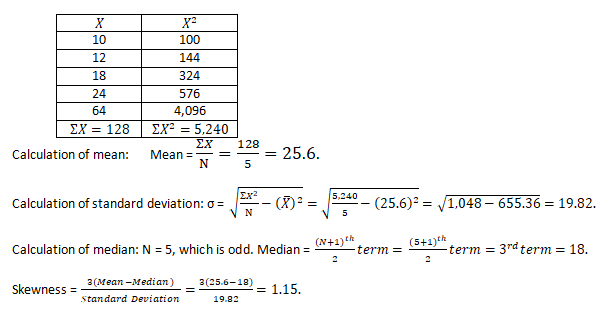
Calculate the Sk (Skewness) and comment on the result.
X
X2
10
100
12
144
18
324
24
576
64
4,096
|
X |
X2 |
|
10 |
100 |
|
12 |
144 |
|
18 |
324 |
|
24 |
576 |
|
64 |
4,096 |
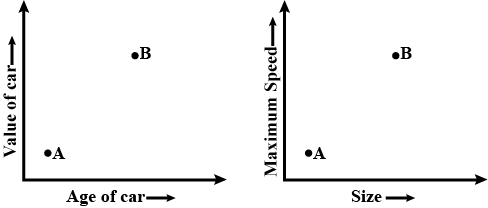
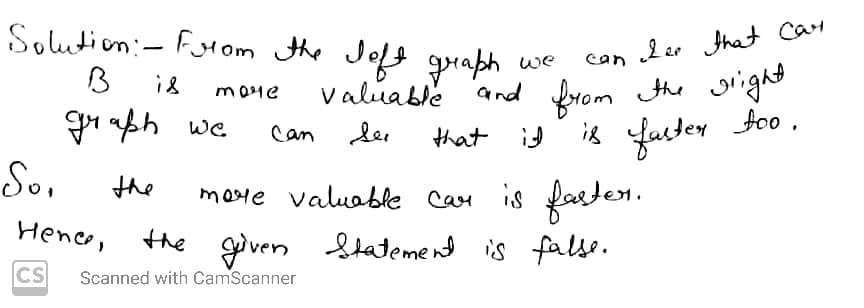
Thee two graph below compare Car A and Care B. The left graph shows the relationship between age and value. The right graph shows the relationship between size and maximum speed.
Use the graphs to determine whether each statement is ture or false, and explain your answer.
The more valuable car is slower.
Class 11 Commerce Applied Mathematics Extra Questions
- Basics Of Financial Mathematics Extra Questions
- Circles Extra Questions
- Descriptive Statistics Extra Questions
- Differentiation Extra Questions
- Functions Extra Questions
- Limits And Continuity Extra Questions
- Logarithm And Antilogarithm Extra Questions
- Mathematical And Logical Reasoning Extra Questions
- Number Theory Extra Questions
- Numerical Applications Extra Questions
- Permutations And Combinations Extra Questions
- Probability Extra Questions
- Relations Extra Questions
- Sequences And Series Extra Questions
- Set Theory Extra Questions
- Straight Lines Extra Questions
- Tangents And Its Equations Extra Questions