Index Numbers - Class 11 Commerce Economics - Extra Questions
The index number by the method of aggregates for the year $$2010$$, taking $$2000$$ as the base year, was found to be $$116$$. If sum of the prices in the year $$2000$$ is Rs. $$300$$, find the values of $$x$$ and $$y$$ in the data given below:
| Commodity | $$A$$ | $$B$$ | $$C$$ | $$D$$ | $$E$$ | $$F$$ |
| Price in the year $$2000$$(rs.) | $$50$$ | $$x$$ | $$30$$ | $$70$$ | $$116$$ | $$20$$ |
| Price in the year $$2010$$(rs.) | $$60$$ | $$24$$ | $$y$$ | $$80$$ | $$120$$ | $$28$$ |
The price relatives and weight of a set commodities are given below:
| Commodity | A | B | C | D |
| Price relative | 125 | 120 | 127 | 119 |
| Weight | $$x$$ | $$2x$$ | $$y$$ | $$y+3$$ |
Write any two uses of cost of living index number.
Calculate the cost of living index number of the following data-
| Item | Quantity (in kg) | Cost (in Rs.) per kg in base year | Cost (in Rs.) per kg in current year |
| Sugar | $$5$$ | $$17$$ | $$16$$ |
| Tea | $$1$$ | $$120$$ | $$134$$ |
| Pulse | $$5$$ | $$34$$ | $$40$$ |
| Ghee | $$2$$ | $$180$$ | $$190$$ |
| Wheat | $$30$$ | $$12$$ | $$15$$ |
| Rice | $$8$$ | $$20$$ | $$22$$ |
Match the following.
| II | Group-A | Group-B | |
| (1) | USA | (a) | was established in 1990 |
| (2) | HDI | (b) | is in the medium HD group |
| (3) | India | (c) | was established in 1979 |
| (4) | PQLI | (d) | is in the high HD group |
Explain any three characteristics of index number.
Write the names of construction of index number.
Calculate age specific death (A-SDR) rates for the following data:
| Age group (in years) | Population $$('000)$$ | Number of Deaths |
| Below $$10$$ | $$25$$ | $$50$$ |
| $$10-30$$ | $$30$$ | $$90$$ |
| $$30-45$$ | $$40$$ | $$160$$ |
| $$45-70$$ | $$20$$ | $$100$$ |
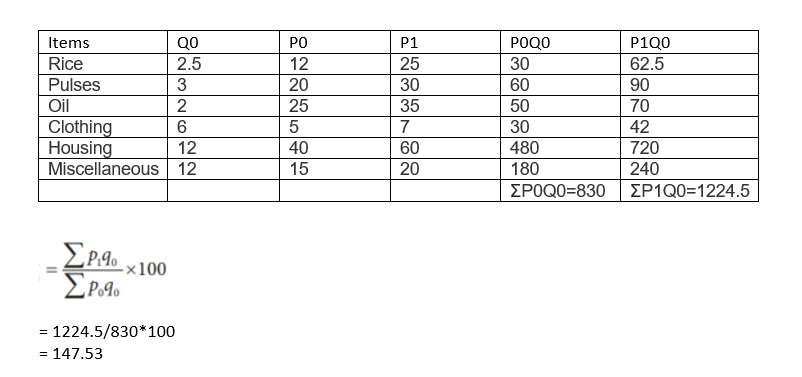
Calculate the cost of living index from the following data-
| Items | Annual Quantity Consumed | ||
| Base year | Given year | ||
| Rice | 2.5 Kg per month | Rs. 12 per kg | Rs. 25 per kg |
| Pulses | 3 Kg per month | Rs. 20 per kg | Rs. 30 per kg |
| Oil | 2 liter per month | Rs. 25 per liter | Rs. 35 per liter |
| Clothing | 6 meters per month | Rs. 5 per meter | Rs. 7 per meter |
| Housing | 12 month | Rs. 40 per month | Rs. 60 per month |
| Miscellaneous | 12 month | Rs. 15 per month | Rs. 20 per month |
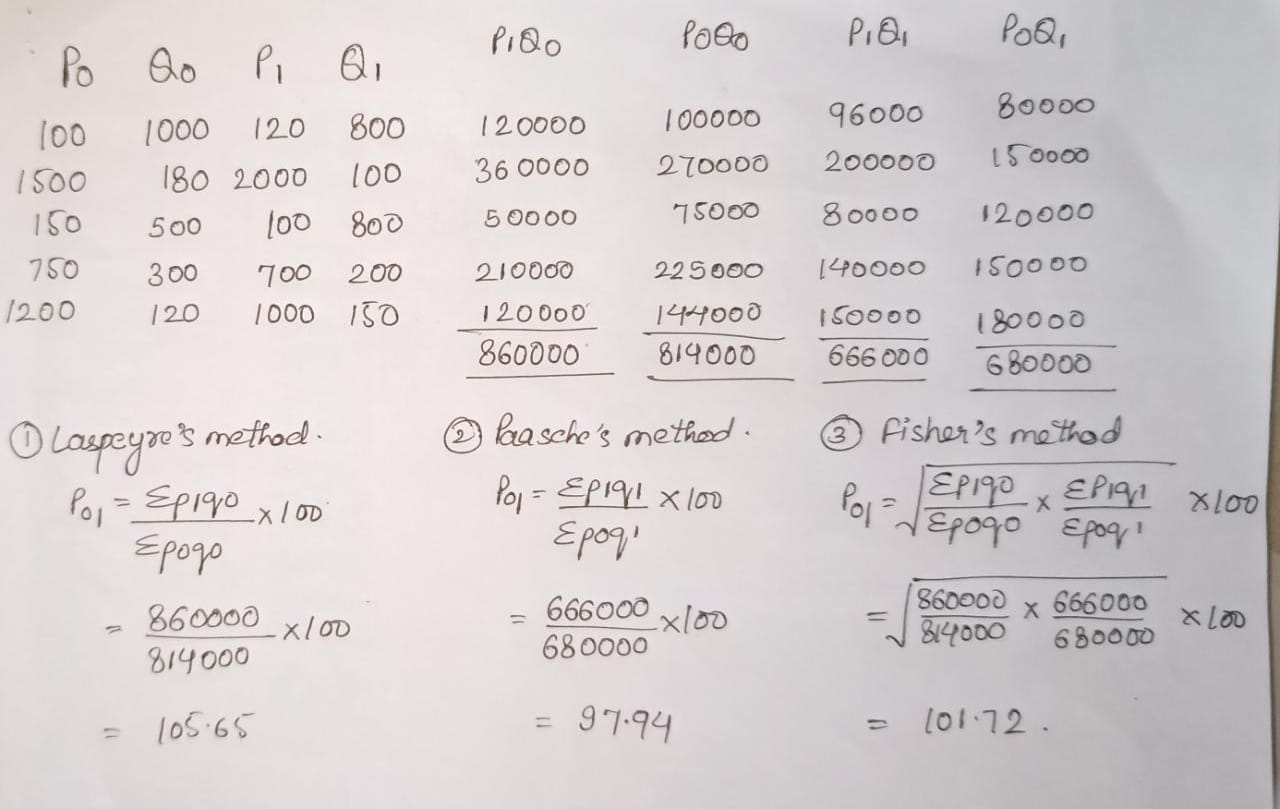
Calculate Laspeyres index number, Paasches Index number, and Fishers ideal index number.
| 2015 | 2020 | ||
| Price | Quantity | Price | Quantity |
| 100 | 1000 | 120 | 800 |
| 1500 | 180 | 2000 | 100 |
| 150 | 500 | 100 | 800 |
| 750 | 300 | 700 | 200 |
| 1200 | 120 | 1000 | 150 |
"Index number is an economical barometers." Explain.
From the following data construct a price index no. by using - Laspeyre's method and Paasche's
method:
| Commodity | P0 | Q0 | P1 | Q1 |
| A | 2 | 8 | 4 | 6 |
| B | 5 | 10 | 6 | 5 |
| C | 4 | 14 | 5 | 10 |
| D | 2 | 19 | 2 | 15 |
Compute (i) Laspeyre's (ii) Paashe's Index number from the following table:
| Items | P0 | Q0 | P1 | Q1 |
| A | 10 | 4 | 12 | 6 |
| B | 15 | 6 | 20 | 4 |
| C | 2 | 5 | 5 | 3 |
| D | 4 | 4 | 4 | 4 |
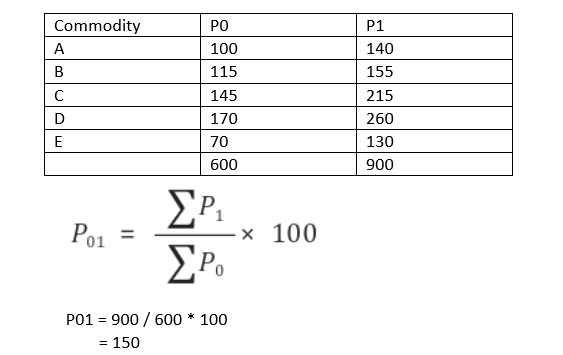
With the help of the following data calculate the index number for 2010 taking 2009 as the base year with the help of the Simple aggregative method.
| Commodity | Price in 2009 | Price in 2010 |
| A | 100 | 140 |
| B | 115 | 155 |
| C | 145 | 215 |
| D | 170 | 260 |
| E | 70 | 130 |
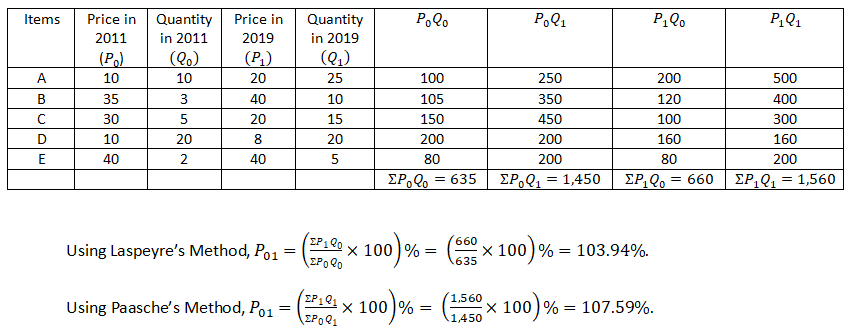
Calculate Laspeyer's & Paasche's Index number from the following data:
| Items | Price in 2011 | Quantity in 2011 | Price in 2019 | Quantity in 2019 |
| A | 10 | 10 | 20 | 25 |
| B | 35 | 3 | 40 | 10 |
| C | 30 | 5 | 20 | 15 |
| D | 10 | 20 | 8 | 20 |
| E | 40 | 2 | 40 | 5 |
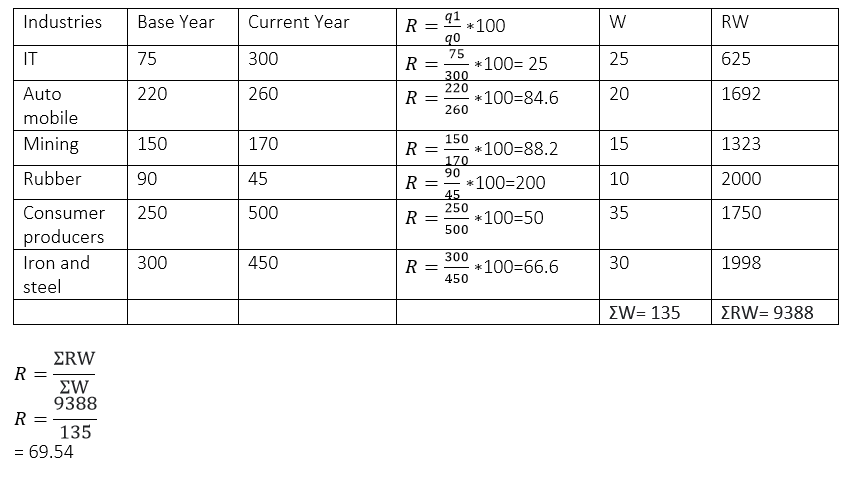
Construct index of Industrial production of 2012 with the help of the below given data:
| Industries | Output (units) | ||
| 2002 | 2012 | Weights | |
| IT | 75 | 300 | 25 |
| Auto mobile | 220 | 260 | 20 |
| Mining | 150 | 170 | 15 |
| Rubber | 90 | 45 | 10 |
| Consumer producers | 250 | 500 | 35 |
| Iron and steel | 300 | 450 | 30 |
Calculate the Laspeyre's index number from the following information:
Commodities
Price in
2018 (P0)
Quantity
in 2018 (Q0)
Price
in 2020 (P1)
A
3
1,000
5
B
2
1,500
4
C
2
1,200
3
D
5
1,800
6
|
Commodities |
Price in 2018 (P0) |
Quantity in 2018 (Q0) |
Price in 2020 (P1) |
|
A |
3 |
1,000 |
5 |
|
B |
2 |
1,500 |
4 |
|
C |
2 |
1,200 |
3 |
|
D |
5 |
1,800 |
6 |
Calculate index number by Laspeyre's method:
Goods
2020
2021`
P0
Q0
P1
Q1
A
2
10
1
6
B
5
5
2
4
C
3
10
1
2
D
4
2
1
1
E
2
1
3
5
|
Goods |
2020 |
2021` |
||
| P0
|
Q0 |
P1
|
Q1
|
|
|
A |
2 |
10 |
1 |
6 |
|
B |
5 |
5 |
2 |
4 |
|
C |
3 |
10 |
1 |
2 |
|
D |
4 |
2 |
1 |
1 |
|
E |
2 |
1 |
3 |
5 |
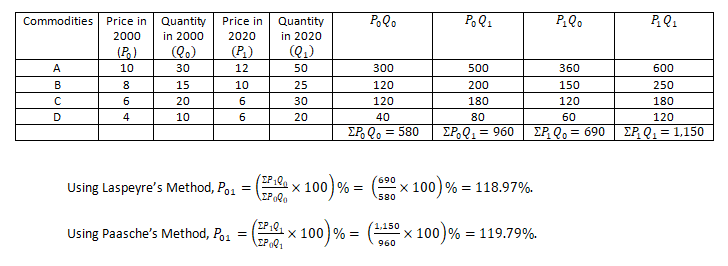
Construct the price index by Laspeyre's and Paasche's method from the following information:
Commodities
Price in
2000 ( Rs.)
Quantity
in 2000
Price
in 2020 (Rs.)
Quantity
in 2020
A
10
30
12
50
B
8
15
10
25
C
6
20
6
30
D
4
10
6
20
|
Commodities |
Price in 2000 ( Rs.) |
Quantity in 2000 |
Price in 2020 (Rs.) |
Quantity in 2020 |
|
A |
10 |
30 |
12 |
50 |
|
B |
8 |
15 |
10 |
25 |
|
C |
6 |
20 |
6 |
30 |
|
D |
4 |
10 |
6 |
20 |
From the following data, calculate price index numbers by: (i) Laspeyer's method and (ii) Paasche's
method
Items
Price (P0)
Quantity (Q0)
Price (P1)
Quantity (Q1)
A
20
8
40
6
B
50
10
60
5
C
40
15
50
15
D
20
20
20
25
|
Items |
Price (P0) |
Quantity (Q0) |
Price (P1) |
Quantity (Q1) |
|
A |
20 |
8 |
40 |
6 |
|
B |
50 |
10 |
60 |
5 |
|
C |
40 |
15 |
50 |
15 |
|
D |
20 |
20 |
20 |
25 |
Calculate index number of the following table, using Paasche's method:
Commodities | Base Year | Current Year | ||
| P0 | Q0 | P1 | Q1 | |
A | 2 | 10 | 4 | 5 |
B | 5 | 12 | 6 | 10 |
C | 4 | 20 | 5 | 15 |
D | 2 | 15 | 3 | 10 |
Calculate index number of the following table, using Laspeyre's method:
Commodities
Base
Year
Current
Year
P0
Q0
P1
Q1
A
2
10
4
5
B
5
12
6
10
C
4
20
5
15
D
2
15
3
10
|
Commodities |
Base Year |
Current Year |
||
| P0
|
Q0 |
P1
|
Q1
|
|
|
A |
2 |
10 |
4 |
5 |
|
B |
5 |
12 |
6 |
10 |
|
C |
4 |
20 |
5 |
15 |
|
D |
2 |
15 |
3 |
10 |
Calculate index number by Paasche's method:
Goods
2020
2021`
P0
Q0
P1
Q1
A
2
10
1
6
B
5
5
2
4
C
3
10
1
2
D
4
2
1
1
E
2
1
3
5
Goods | 2020 | 2021` | ||
| P0 | Q0 | P1 | Q1 | |
A | 2 | 10 | 1 | 6 |
B | 5 | 5 | 2 | 4 |
C | 3 | 10 | 1 | 2 |
D | 4 | 2 | 1 | 1 |
E | 2 | 1 | 3 | 5 |
The price of six different commodities for year $$2009$$ and year $$2011$$ are as follows:
| Commodities | $$A$$ | $$B$$ | $$C$$ | $$D$$ | $$E$$ | $$F$$ |
| Price in $$2009 (Rs)$$ | $$35$$ | $$80$$ | $$25$$ | $$30$$ | $$80$$ | $$x$$ |
| Price in $$2011 (Rs)$$ | $$50$$ | $$y$$ | $$45$$ | $$70$$ | $$120$$ | $$105$$ |
Calculate the index number for the year $$2014$$, with $$2010$$ as the base year by the weighted aggregate method from the following data :
| Commodity | Price in rupees $$(2010)$$ | Price in rupees $$(2014)$$ | Weight |
| $$A$$ | $$2$$ | $$4$$ | $$8$$ |
| $$B$$ | $$5$$ | $$6$$ | $$10$$ |
| $$C$$ | $$4$$ | $$5$$ | $$14$$ |
| $$D$$ | $$2$$ | $$2$$ | $$19$$ |
Compute (i) Laspeyre's (ii) Paashe's Index number from the following table:
| Items | Price of base year (Rs.) | Quantity of base year | Price of current year | Quantity of current year |
| A | 10 | 4 | 12 | 6 |
| B | 15 | 6 | 20 | 4 |
| C | 2 | 5 | 5 | 3 |
| D | 4 | 4 | 4 | 4 |
Calculate Laspeyre's Index number and Paasche's Index number.
2019
2020
Commodity
Price (P0)
Quantity (Q0)
Price (P1)
Price (Q1)
A
100
200
110
150
B
25
400
30
200
C
1,100
10
900
15
D
50
500
40
60
E
10
1,000
12
900
|
|
2019 |
2020 |
||
|
Commodity |
Price (P0)
|
Quantity (Q0) |
Price (P1)
|
Price (Q1)
|
|
A |
100 |
200 |
110 |
150 |
|
B |
25 |
400 |
30 |
200 |
|
C |
1,100 |
10 |
900 |
15 |
|
D |
50 |
500 |
40 |
60 |
|
E |
10 |
1,000 |
12 |
900 |
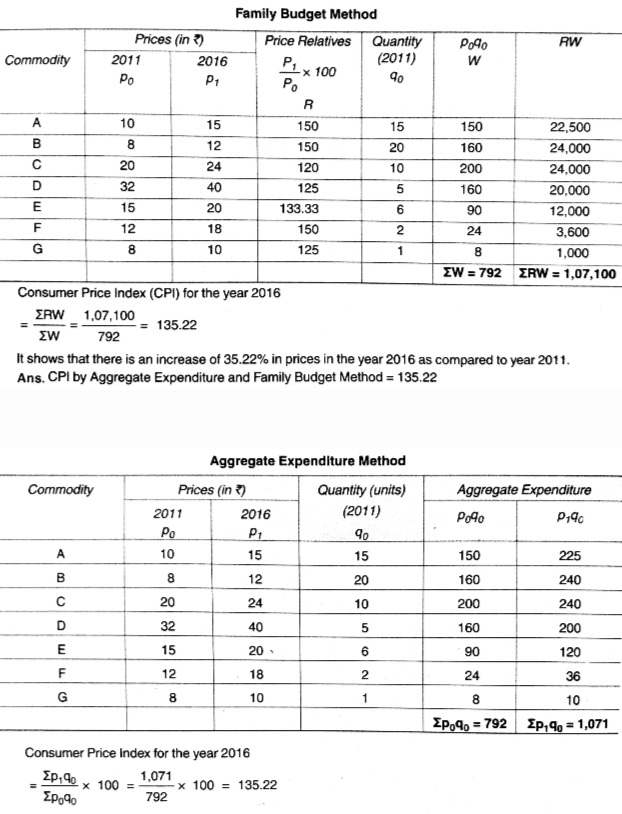
Calculate cost of living index, for the following data, using aggregate expenditure and family budget Method.
| Commodity | Price in 2011 | Price in 2016 | Quantity in 2011 |
| A | 10 | 15 | 15 |
| B | 8 | 12 | 20 |
| C | 20 | 24 | 10 |
| D | 32 | 40 | 5 |
| E | 15 | 20 | 6 |
| F | 12 | 18 | 2 |
| G | 8 | 10 | 1 |
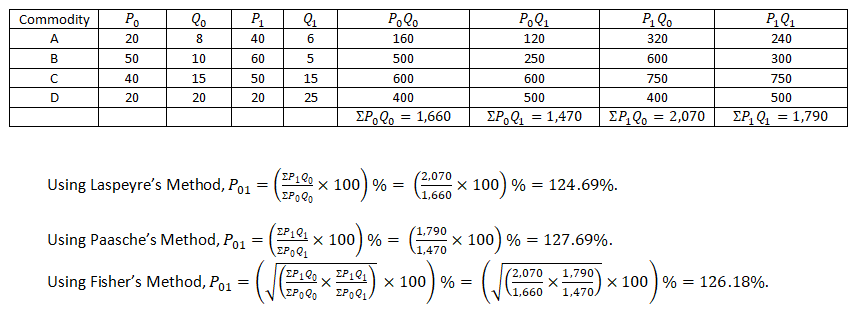
From the following data, calculate price index numbers for 2016 with 2011 as base by:
- Laspeyre's Method,
- Paasche's Method,
- Fisher's Method.
Commodity Price 2011 Quantity 2011 Price 2016 Quantity 2016 A 20 8 40 6 B 50 10 60 5 C 40 15 50 15 D 20 20 20 25
| Commodity | Price 2011 | Quantity 2011 | Price 2016 | Quantity 2016 |
| A | 20 | 8 | 40 | 6 |
| B | 50 | 10 | 60 | 5 |
| C | 40 | 15 | 50 | 15 |
| D | 20 | 20 | 20 | 25 |
Construct quantity index number of 2019 from the following data by:
(a) Laspeyre's method, and (b) Paasche's ethod
2018
2019
Commodity
Price
Quantity
Price
Quantity
A
20
60
24
100
B
16
30
20
50
C
12
40
12
60
D
8
20
12
40
|
|
2018 |
2019 |
||
|
Commodity |
Price
|
Quantity |
Price
|
Quantity
|
|
A |
20 |
60 |
24 |
100 |
|
B |
16 |
30 |
20 |
50 |
|
C |
12 |
40 |
12 |
60 |
|
D |
8 |
20 |
12 |
40 |
Class 11 Commerce Economics Extra Questions
- Collection Of Data Extra Questions
- Correlation Extra Questions
- Index Numbers Extra Questions
- Introduction To Economics Extra Questions
- Introduction To Microeconomics Extra Questions
- Market Equilibrium Extra Questions
- Measures Of Central Tendency Extra Questions
- Measures Of Dispersion Extra Questions
- Non-Competitive Markets Extra Questions
- Organisation Of Data Extra Questions
- Presentation Of Data Extra Questions
- Production And Costs Extra Questions
- Theory Of Consumer Behaviour Extra Questions
- The Theory Of The Firm Under Perfect Competition Extra Questions
- Use Of Statistical Tools Extra Questions
