Measures Of Dispersion - Class 11 Commerce Economics - Extra Questions
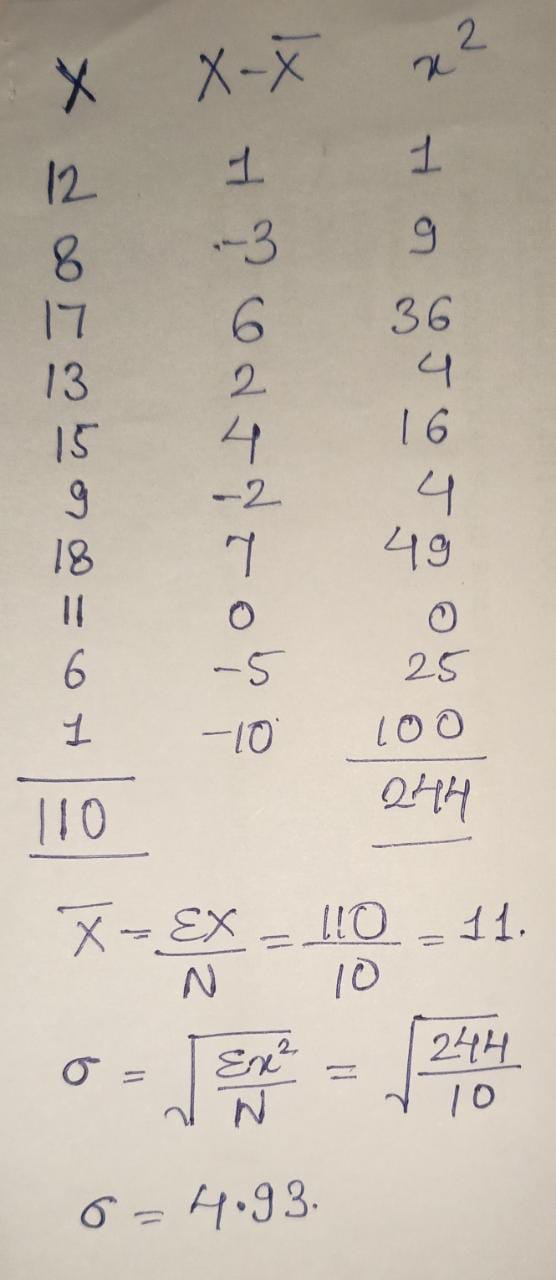
Find out the standard deviation from the following data:
| 12 | 8 | 17 | 13 | 15 | 9 | 18 | 11 | 6 | 1 |
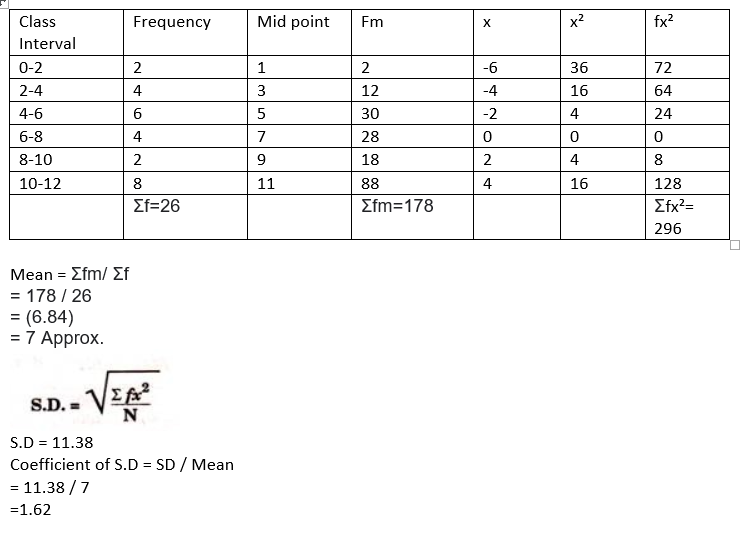
From the following table, find out Standard Deviation, Coefficient of standard deviation.
| Class Intervals | Frequency |
| 0-2 | 2 |
| 2-4 | 4 |
| 4-6 | 6 |
| 6-8 | 4 |
| 8-10 | 2 |
| 10-12 | 8 |
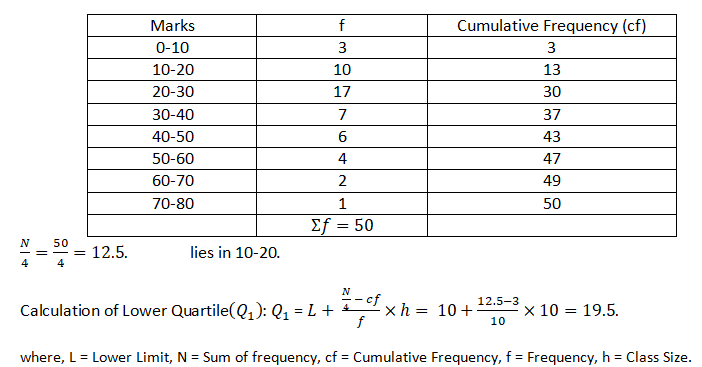
Find the lower quartile deviation (Q1):
| Marks | f |
| 0-10 | 3 |
| 10-20 | 10 |
| 20-30 | 17 |
| 30-40 | 7 |
| 40-50 | 6 |
| 50-60 | 4 |
| 60-70 | 2 |
| 70-80 | 3 |
Solution is as follows:
Calculate Standard Deviation of the following data:
|
Class Intervals |
Frequency |
|
1-3 |
40 |
|
3-5 |
30 |
|
5-7 |
20 |
|
7-9 |
10 |

Find out standard deviation:
X: 10, 15, 20, 25, 30, 35, 40.

Find Standard Deviation of the following distribution using Step Deviation Method (Assume mean = 27.5).Size (in cm.)
No. of Items
10-15
2
15-20
8
20-25
20
25-30
35
30-35
20
35-40
15
Size (in cm.) | No. of Items |
10-15 | 2 |
15-20 | 8 |
20-25 | 20 |
25-30 | 35 |
30-35 | 20 |
35-40 | 15 |

Calculate standard deviation from the following data using the assumed mean method and A = 5.
Marks
No. of students
0-2
2
2-4
4
4-6
6
6-8
4
8-10
2
10-12
6
|
Marks |
No. of students |
|
0-2 |
2 |
|
2-4 |
4 |
|
4-6 |
6 |
|
6-8 |
4 |
|
8-10 |
2 |
|
10-12 |
6 |

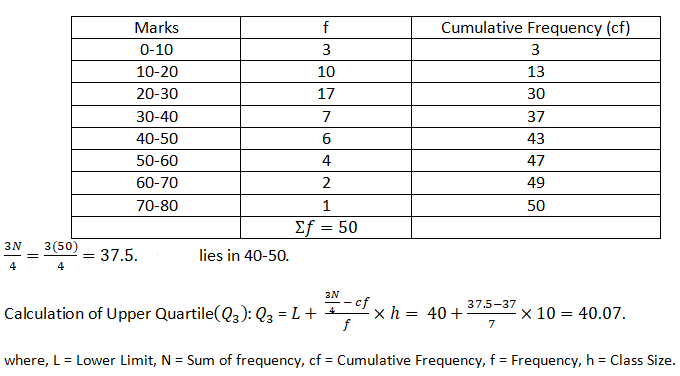
Find the upper quartile deviation (Q3):
| Marks | f |
| 0-10 | 3 |
| 10-20 | 10 |
| 20-30 | 17 |
| 30-40 | 7 |
| 40-50 | 6 |
| 50-60 | 4 |
| 60-70 | 2 |
| 70-80 | 3 |
Solution is given as follows:
Calculate standard deviation using step deviation method from the following information:
Class Interval | Frequency |
0-5 | 15 |
5-10 | 10 |
10-15 | 11 |
15-20 | 12 |
20-25 | 6 |
25-30 | 6 |
30-35 | 10 |
35-40 | 15 |
40-45 | 10 |
45-50 | 5 |

Calculate the standard deviation from the following data by step deviation method using 15 as assumed mean.
|
Class Interval |
Frequency |
|
10-20 |
4 |
|
20-30 |
8 |
|
30-40 |
8 |
|
40-50 |
16 |
|
50-60 |
12 |
|
60-70 |
6 |
|
70-80 |
4 |

Calculate the standard deviation using assumed mean method from the following information:
Weeks | COVID Patients (‘000) |
0-4 | 600 |
4-8 | 400 |
8-12 | 250 |
12-16 | 200 |
16-20 | 300 |
20-24 | 350 |
24-28 | 450 |
28-32 | 500 |
32-36 | 750 |
36-40 | 900 |

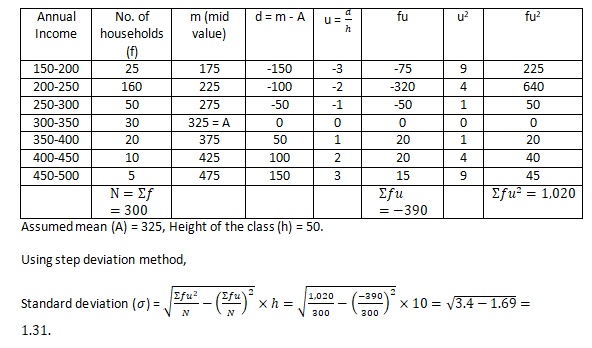
Distribution of annual income of 300 households in a locality is given below,
Calculate the standard deviation of the Income.
|
Annual Income |
No. of households |
|
150-200 |
25 |
|
200-250 |
160 |
|
250-300 |
50 |
|
300-350 |
30 |
|
350-400 |
20 |
|
400-450 |
10 |
|
450-500 |
5 |
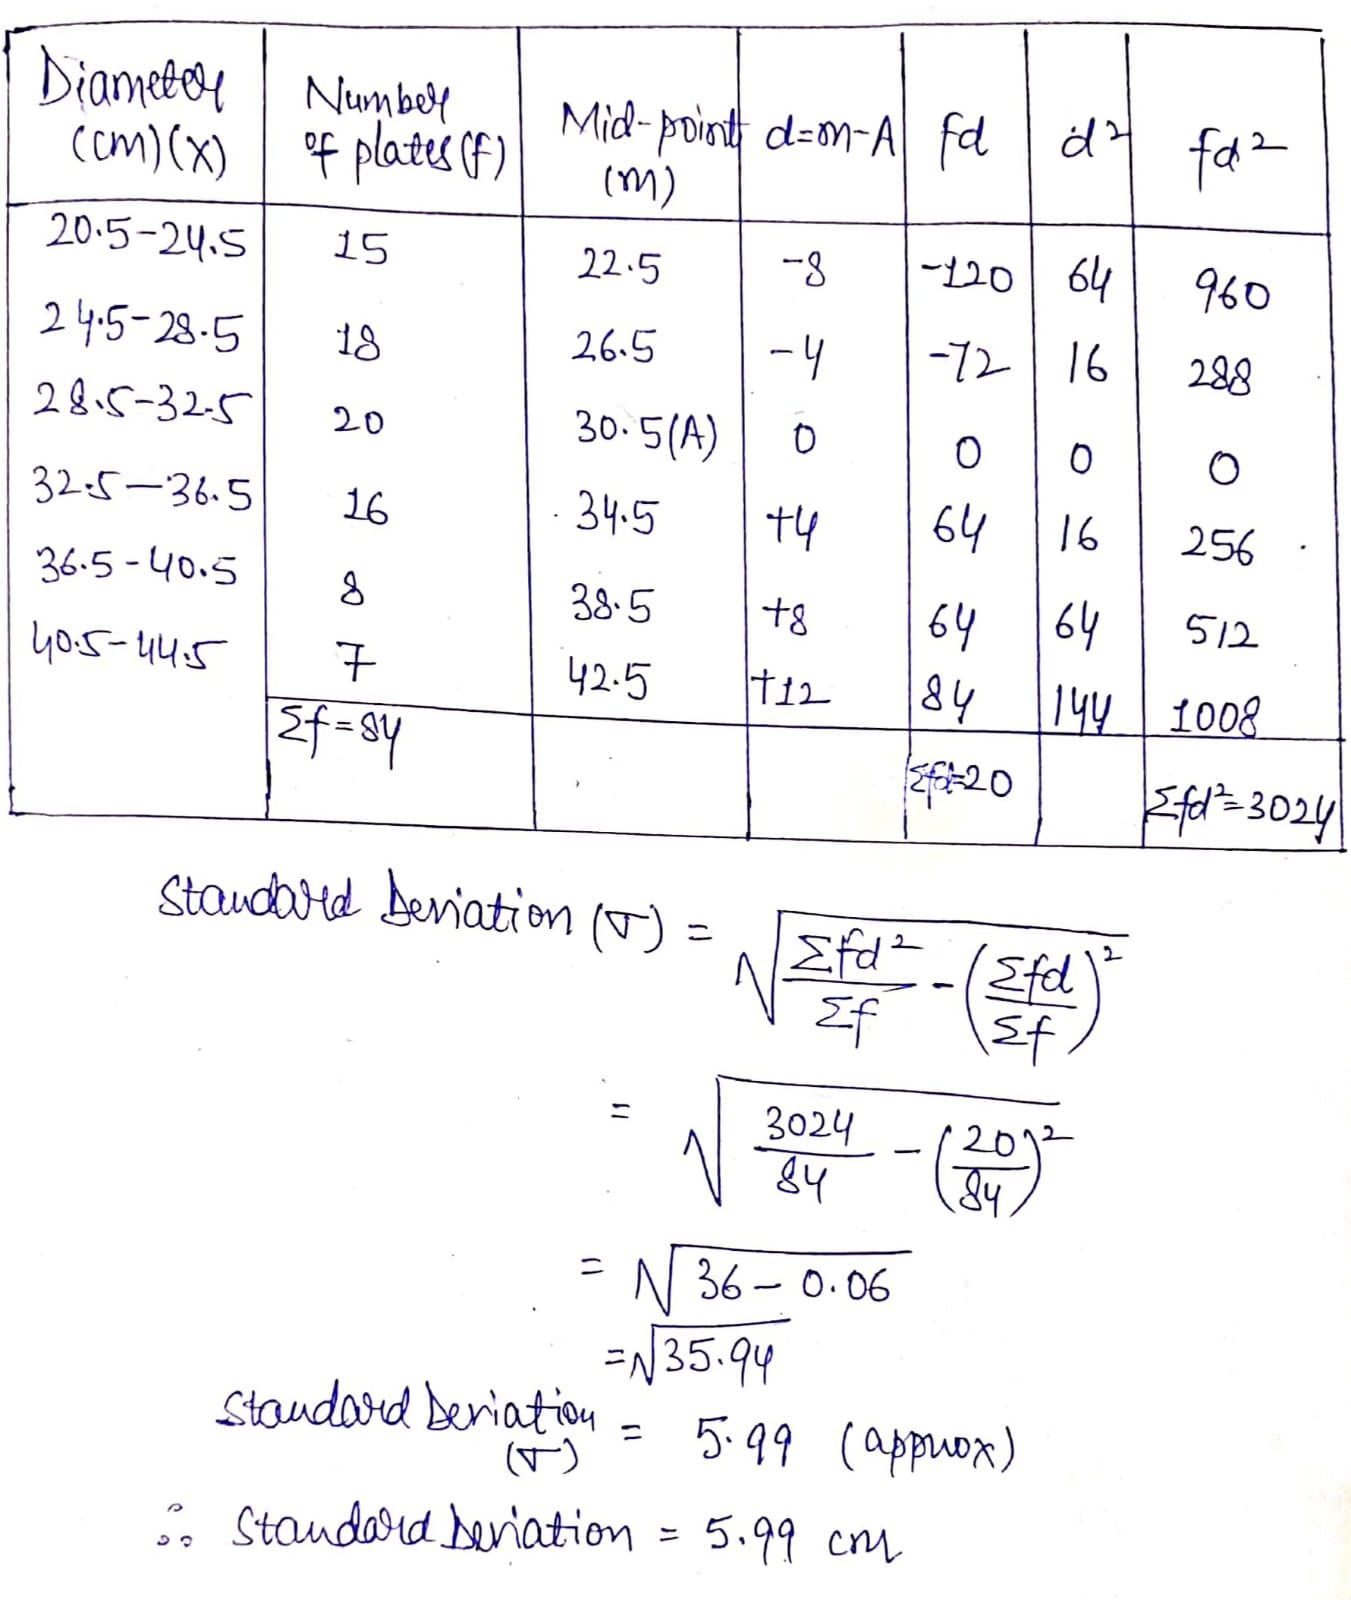
The measurements of the diameters (in cms) of the plates prepared in a factory are given below. Find its standard deviation.
| Diameter (cm) | 21-24 | 25-28 | 29-32 | 33-36 | 37-40 | 41-44 |
| Number of plates | 15 | 18 | 20 | 16 | 8 | 7 |
For two firms A and B belonging to same industry, the following details are available:
| Firm A | Firm B | |
| Number of employees | 100 | 200 |
| Average monthly wage | Rs.4,800 | Rs.5,100 |
| Standard deviation | Rs.600 | Rs.540 |
Find combined average monthly wage and the standard deviation of the wages of all the employees in both the firms.

Class 11 Commerce Economics Extra Questions
- Collection Of Data Extra Questions
- Correlation Extra Questions
- Index Numbers Extra Questions
- Introduction To Economics Extra Questions
- Introduction To Microeconomics Extra Questions
- Market Equilibrium Extra Questions
- Measures Of Central Tendency Extra Questions
- Measures Of Dispersion Extra Questions
- Non-Competitive Markets Extra Questions
- Organisation Of Data Extra Questions
- Presentation Of Data Extra Questions
- Production And Costs Extra Questions
- Theory Of Consumer Behaviour Extra Questions
- The Theory Of The Firm Under Perfect Competition Extra Questions
- Use Of Statistical Tools Extra Questions