Measures Of Central Tendency - Class 11 Commerce Economics - Extra Questions
Ina retail market, fruit vendors were selling mangoes kept in packing boxes. These boxes contained varying number of mangoes. The following was the distribution of mangoes according to the number of boxes.
| mangoes | 50-52 | 53-55 | 56-58 | 59-61 | 62-64 |
| No. of boxes | 15 | 110 | 135 | 115 | 25 |
If true then enter $$1$$ and if false then enter $$0$$
Find the mean of following distribution with step-deviation method to the nearest integer
| Class | 10 - 15 | 15 - 20 | 20 - 25 | 25 - 30 | 30 - 35 | 35 - 40 |
| Frequency | 5 | 6 | 8 | 12 | 6 | 3 |
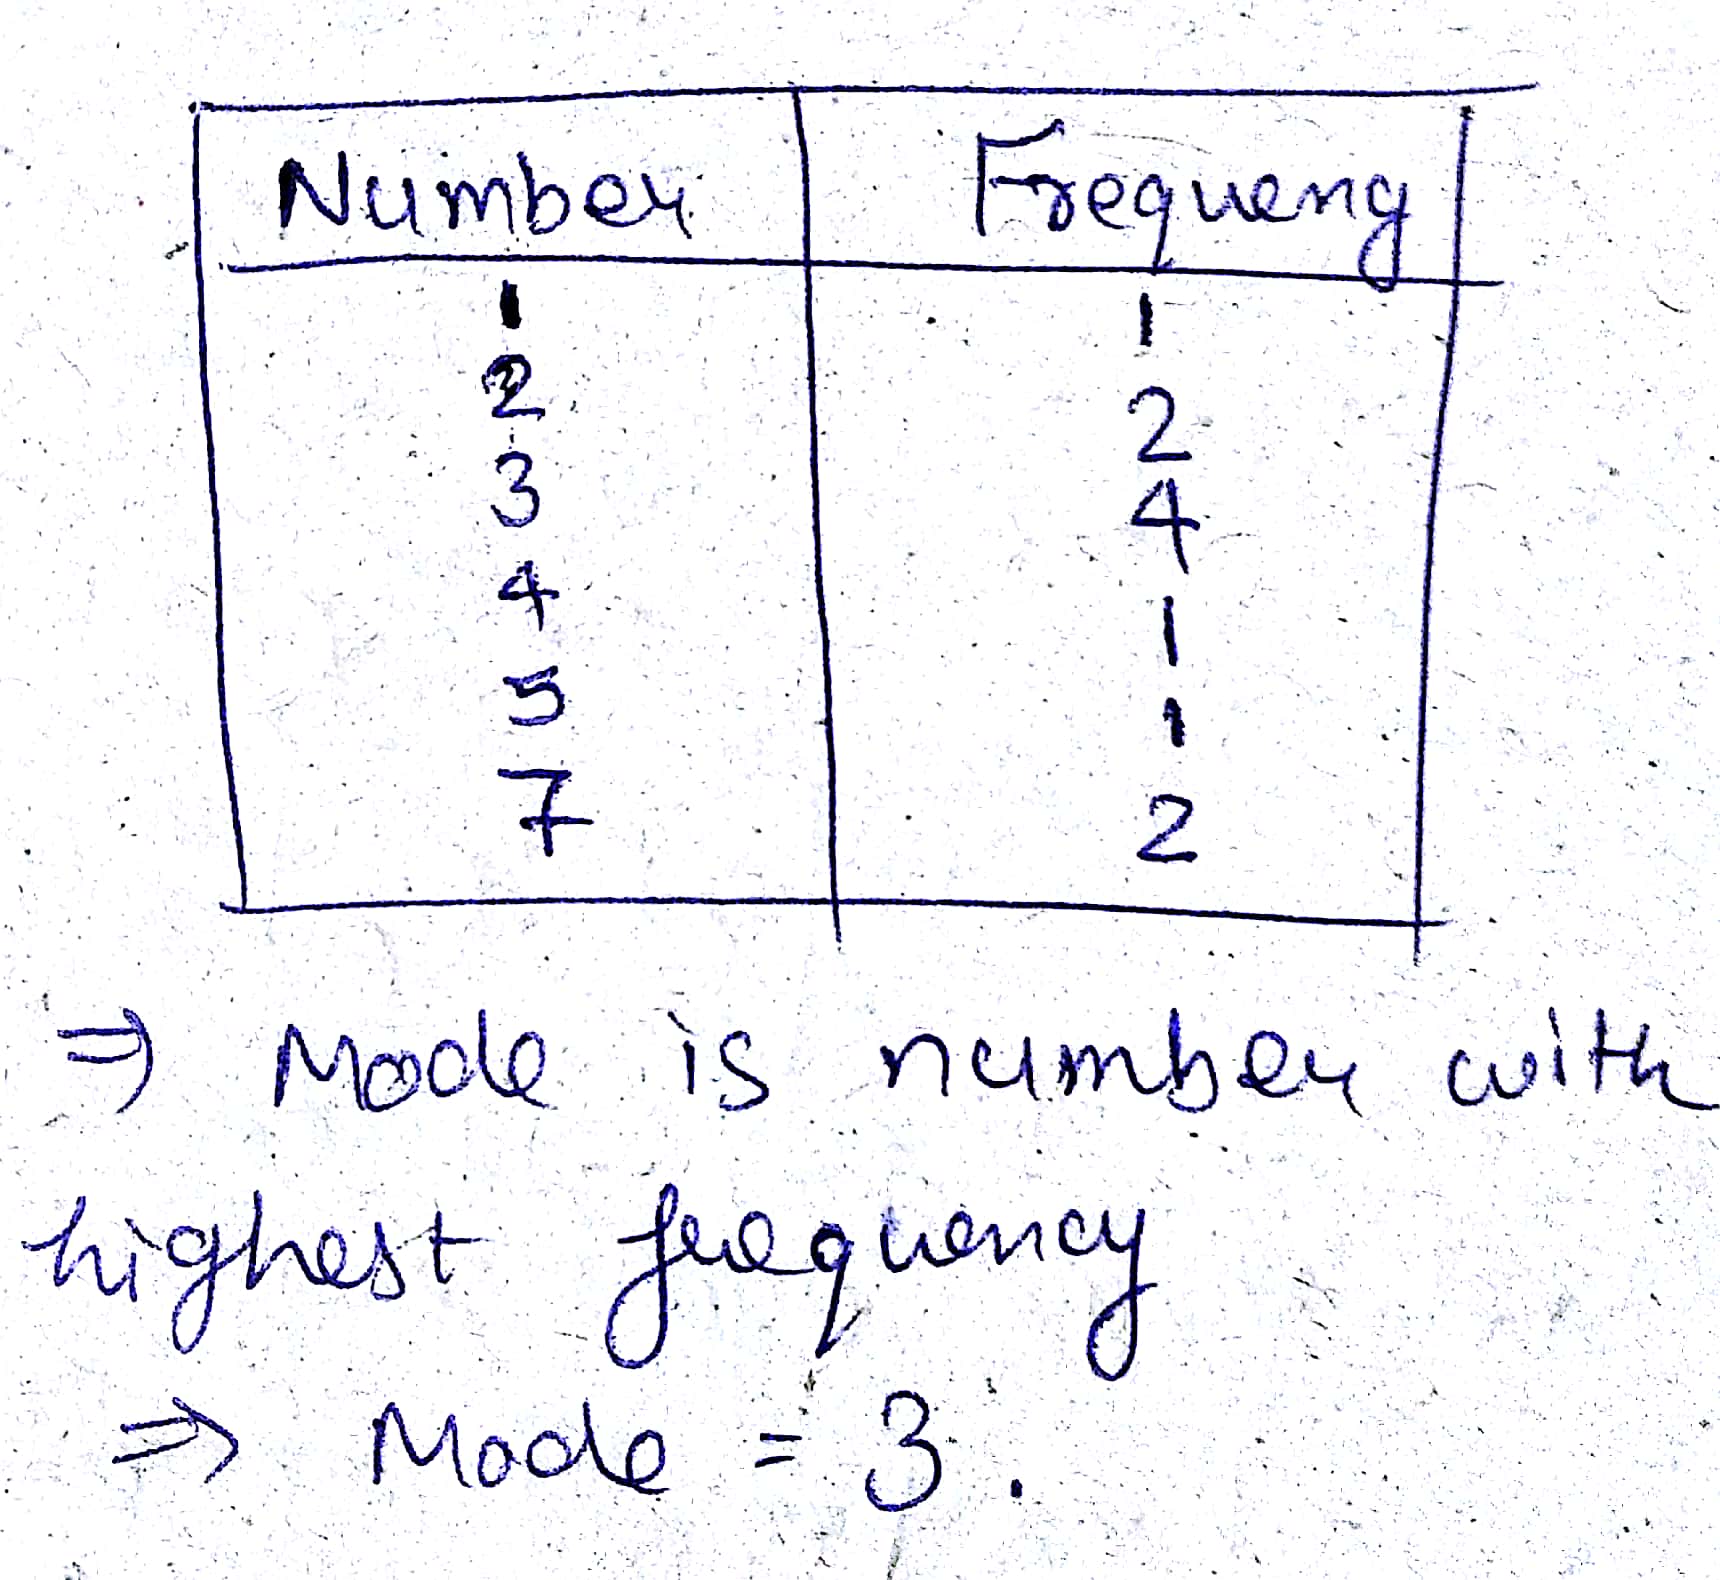
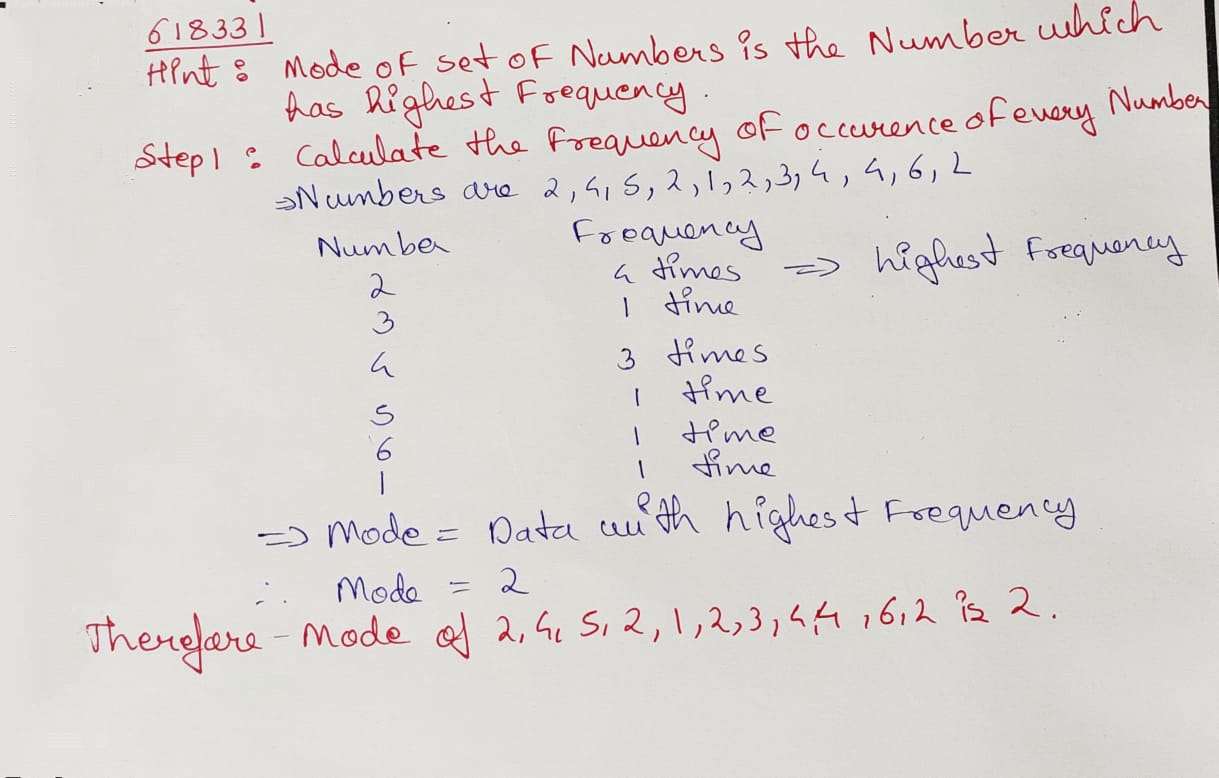
Find the mode of the given set of numbers-
$$1, 1, 2, 4, 3, 2, 1, 2, 2, 4$$
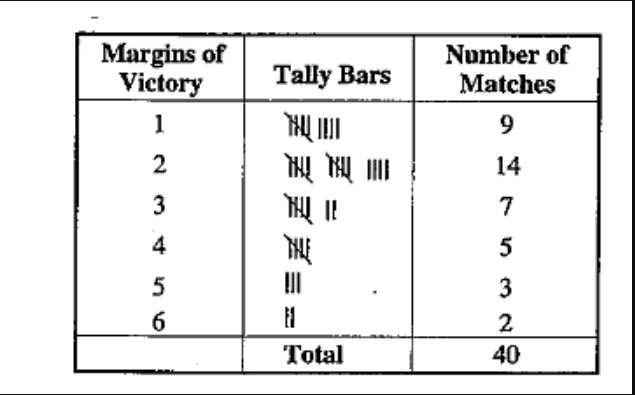
Following are the margins of victory in the football matches of a league.
$$1, 3, 2, 5, 1, 4, 6, 2, 5, 2, 2, 2, 4, 1, 2, 3, 1, 1,
2, 3, 2, 6, 4, 2, 1, 1, 4, 2, 1, 5, 3, 3, 2, 3, 2, 4, 2,
1, 2, 3$$, find the mode of this data.
Looking at the table, we can quickly say that $$2$$ is the mode since $$2$$ has occured the highest number of times. thus, most of the matches have been won with a victory margin of $$2$$ goals.
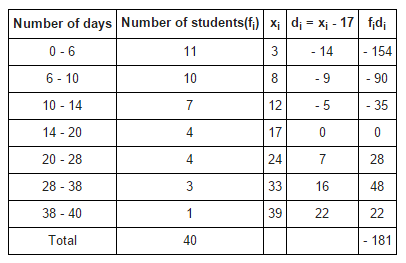
A class teacher has the following absentee record of $$40$$ students of a class for the whole term. Find the mean number of days a student was absent.
$$\left( { x }_{ i } \right) =\displaystyle\frac { Upper class limit + Lower class limit }{ 2 } $$
Taking 17 as assumed mean $$\left( a \right) $$, calculating $${ d }_{ i }$$ and $${ f }_{ i }{ d }_{ i }$$ as:
From the table:
$$\sum { { f }_{ i } } =40$$
$$\sum { { f }_{ i }{ d }_{ i } } =-181$$
Mean, $$\bar { x } =a+\displaystyle\frac { \sum { { f }_{ i }{ d }_{ i } } }{ \sum { { f }_{ i } } } $$
$$=17+\left( \displaystyle\frac { -181 }{ 40 } \right) $$
$$=17-4.525$$
$$=12.475$$
$$\approx 12.48$$
Therefore, the mean number of days $$= 12.48$$ days for which a student was absent.
Find the median of the data: $$15, 22, 9, 20, 6, 18, 11, 25, 14$$
Find the mode for the following data:
$$22, 36, 18, 22, 20, 34, 22, 42, 46,42$$
Find the median of the data: $$32, 30, 28, 31, 22, 26, 27, 21$$
Find the mode for the following data:
$$4, 3, 1, 5, 3, 7, 9, 6$$
Find the median of the data: $$26, 31, 33, 37, 43, 8, 26, 33$$
The following numbers are the sizes of shoes sold by a shop in a particular day. Find the mode.
$$6, 7, 8, 9, 10, 6, 7, 10, 7, 6, 7, 9, 7, 6$$
Find the mode of the data: $$5, 3, 3, 5, 7, 6, 3, 4, 3, 5, 8, 5$$
Find the mode for the data: $$15, 20, 22, 25, 30, 20, 15, 20, 12, 20$$
Calculate mean $$(\overline{X})$$, when $$\sum f_ix_i=100$$ and $$\sum f_i=20$$.
Find the mode of $$5, 6, 9, 6, 12, 3, 6, 11, 6, 7$$.
Find the mode of $$22, 25, 21, 22, 29, 25, 34, 37, 30, 22, 29, 25$$.
If $$\sum f_{i}x_{i} = 75$$ and $$\sum f_{i} = 15$$, then find the mean $$\overline {x}$$
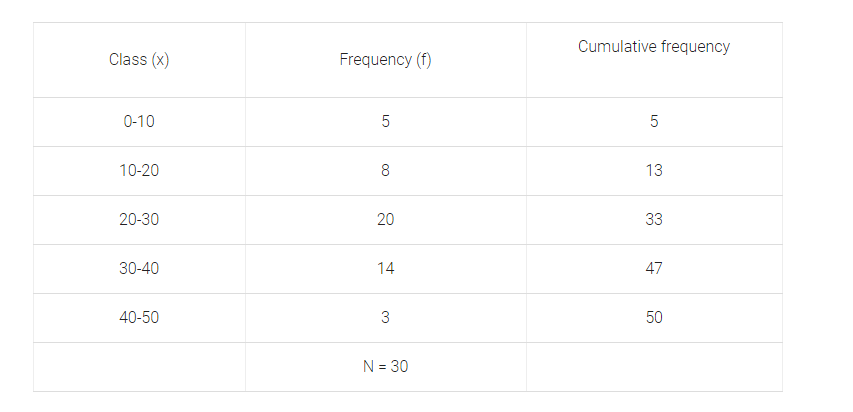
Calculate the arithmetic mean of given frequency distribution table.
| Class-interval | $$0-10$$ | $$10-20$$ | $$20-30$$ | $$30-40$$ | $$40-50$$ | $$50-60$$ |
| Frequency | $$7$$ | $$14$$ | $$28$$ | $$26$$ | $$16$$ | $$9$$ |
Find the mode of following numbers $$6, 3, 2, 6, 5, 6$$ and $$8$$.
The following table gives the number of children of $$150$$ families in a village.
| No. of children ($$x$$) | $$0$$ | $$1$$ | $$2$$ | $$3$$ | $$4$$ | $$5$$ |
| No. of families ($$f$$) | $$10$$ | $$21$$ | $$55$$ | $$42$$ | $$15$$ | $$7$$ |
If the mean of the following data is $$15$$, find $$p$$.
| $$x$$: | $$5$$ | $$10$$ | $$15$$ | $$20$$ | $$25$$ |
| $$f$$: | $$6$$ | $$p$$ | $$6$$ | $$10$$ | $$5$$ |
Find the mean of the following frequency distribution:
Class interval: 50-70 70-90 90-110 110-130 130-150 150-170 Frequency: $$18$$ $$12$$ $$13$$ $$27$$ $$8$$ $$22$$
| Class interval: | 50-70 | 70-90 | 90-110 | 110-130 | 130-150 | 150-170 |
| Frequency: | $$18$$ | $$12$$ | $$13$$ | $$27$$ | $$8$$ | $$22$$ |
Find the missing value of $$p$$ for the following distribution whose mean is $$12.58$$.
| $$x$$: | $$5$$ | $$8$$ | $$10$$ | $$12$$ | $$p$$ | $$20$$ | $$25$$ |
| $$f$$: | $$2$$ | $$5$$ | $$8$$ | $$22$$ | $$7$$ | $$4$$ | $$2$$ |
Find the mean of the following data:
| $$x$$ | $$19$$ | $$21$$ | $$23$$ | $$25$$ | $$27$$ | $$29$$ | $$31$$ |
| $$f$$ | $$13$$ | $$15$$ | $$16$$ | $$18$$ | $$16$$ | $$15$$ | $$13$$ |
If the mean of the following data is $$20.6$$. Find the value of $$p$$.
| $$x$$ | $$10$$ | $$15$$ | $$p$$ | $$25$$ | $$35$$ |
| $$f$$ | $$3$$ | $$10$$ | $$25$$ | $$7$$ | $$5$$ |
Find the missing frequency ($$p$$) for the following distribution whose mean is $$7.68$$
| $$x$$: | $$3$$ | $$5$$ | $$7$$ | $$9$$ | $$11$$ | $$13$$ |
| $$f$$: | $$6$$ | $$8$$ | $$15$$ | $$p$$ | $$8$$ | $$4$$ |
The arithmetic mean of the following data is $$14$$. Find the value of $$k$$.
| $$x$$: | $$5$$ | $$10$$ | $$15$$ | $$20$$ | $$25$$ |
| $$f$$: | $$7$$ | $$k$$ | $$8$$ | $$4$$ | $$5$$ |
Find the mean median and mode of $$20,15,25,7,25,17,5$$
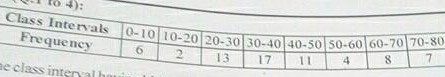
Find a if the mean mark is $$1$$.
| Mark | 0 | 1 | 2 | 3 | 4 |
| No. of students | a | 4 | 3 | 2 | 1 |
Calculate mean with step Deviation method from the following data.
| Marks | $$0-10$$ | $$10-20$$ | $$20-30$$ | $$30-40$$ | $$40-50$$ |
| No. of student | $$4$$ | $$6$$ | $$10$$ | $$20$$ | $$10$$ |
Find the mode of the following data:
$$120, 110, 130, 110, 120, 140, 130, 120, 140, 120.$$
Following are the lives in hours of $$15$$ pieces of the components of aircraft engine. Find the median.
$$715,724,725,710,729,745,694,699,696,712,734,728,716,705,719$$
| X | C.F. |
| Less than 10 | 12 |
| 10-20 | 19 |
| 20-30 | 28 |
| 30-40 | 30 |
| 40-50 | 40 |
Median = ?
The arithmetic mean for the following distribution is $$53$$. Find the value of $$p$$.
| $$Class$$ | $$0-20$$ | $$20-40$$ | $$40-60$$ | $$60-80$$ | $$80-100$$ |
| $$Frequency$$ | $$15$$ | $$18$$ | $$21$$ | $$p$$ | $$17$$ |
If the median of the scores $$\frac{x}{3},\frac{x}{2},\frac{x}{4},\frac{{2x}}{9},x\left( {x > 0} \right)$$ is 3, then find 'x'.
Find the mean of the following frequency distribution using steps deviation method.
| C.I | 0-100 | 100-200 | 200-300 | 30-400 | 400-500 | 500-600 | 600-700 |
| F | 10 | 15 | 25 | 25 | 10 | 10 | 5 |
Median of the data $$\dfrac{x}{3}, \dfrac{x}{6}, \dfrac{x}{9}. \dfrac{x}{2}, \dfrac{x}{8}, \dfrac{x}{4}$$ is $$5$$, then find the value of 'x'.
Calculate the mean of the following data, using direct method:
| Class | 25-35 | 35-45 | 45-55 | 55-65 | 65-75 |
| Frequency | 6 | 10 | 8 | 12 | 4 |
Calculate the mean of the following frequency distribution.
| Class | $$90-100$$ | $$100-110$$ | $$110-120$$ | $$120-130$$ | $$130-140$$ |
| Frequency | $$18$$ | $$78$$ | $$80$$ | $$100$$ | $$72$$ |
If the mean of a data is $$20.2$$. Find the value of m.
| Observation | $$10$$ | $$15$$ | $$20$$ | $$25$$ | $$30$$ |
| Frequency | $$6$$ | $$8$$ | m | $$10$$ | $$6$$ |
Find the mean of the first five whole numbers.
The data given below shows the number of goals scored by a football team over $$30$$ games
4 | 3 | 2 | 1 | 4 | 0 | 1 | 0 | 5 | 1 | 0 | 0 | 1 | 4 | 3 |
2 | 1 | 0 | 1 | 3 | 4 | 2 | 0 | 1 | 0 | 3 | 2 | 1 | 1 | 0 |
Find the mean of each of the data. $$8,-2,9,6,13,17,12$$
The following table given the weekly wages (in Rs.) of workers in a factory:
| Weekly wages (in Rs.) | $$50-55$$ | $$55-60$$ | $$60-65$$ | $$65-70$$ | $$70-75$$ | $$75-80$$ | $$80-85$$ | $$85-90$$ |
| No. of workers | $$5$$ | $$20$$ | $$10$$ | $$10$$ | $$9$$ | $$6$$ | $$12$$ | $$8$$ |
The mean.
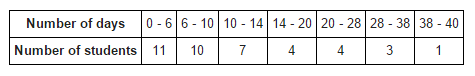
A class teacher has the following absentee record of $$40$$ students of a class for the whole term. Find the mean number of days a student was absent.
| Number of days | $$0-6$$ | $$6-10$$ | $$10-14$$ | $$14-20$$ | $$20-28$$ | $$28-38$$ | $$38-40$$ |
| Number of students | $$11$$ | $$10$$ | $$7$$ | $$4$$ | $$4$$ | $$3$$ | $$1$$ |
Find mean of the following data by using step-deviation method
| Class | 10-14 | 15-19 | 20-24 | 25-29 | 30-34 |
| Frequency | $$15$$ | $$110$$ | $$135$$ | $$115$$ | $$25$$ |
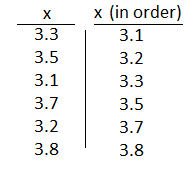
Find the median of the data: $$3.3,3.5,3.1,3.7,3.2,3.8$$
Find the median of the following data: $$14, 16, 14, 12, 11, 14, 16, 12, 10, 8$$.
The following distribution gives ages of $$1000$$ persons who visited a shopping centre on sunday:
| Age(in years) | $$0-10$$ | $$10-20$$ | $$20-30$$ | $$30-40$$ | $$40-50$$ | $$50-60$$ | $$60-70$$ |
| Number of persons | $$105$$ | $$222$$ | $$220$$ | $$138$$ | $$102$$ | $$113$$ | $$100$$ |
The following table given the weekly wages (in Rs.) of workers in a factory:
| Weekly wages (in Rs.) | $$50-55$$ | $$55-60$$ | $$60-65$$ | $$65-70$$ | $$70-75$$ | $$75-80$$ | $$80-85$$ | $$85-90$$ |
| No. of workers | $$5$$ | $$20$$ | $$10$$ | $$10$$ | $$9$$ | $$6$$ | $$12$$ | $$8$$ |
Find the median of first eight $$(8)$$ positive composite numbers.
The following observations have been arranged in ascending order. if the median of these observations is 58, find the value of $$x$$.
$$24$$, $$27$$, $$43$$, $$48$$, $$x-1$$, $$x+3$$, $$ 68$$, $$73$$, $$80$$, $$90$$.
Calculate Mean, Median and Mode for the following data. Which of these three measures if minimum?
| Marks s(out of 15) | $$7$$ | $$4$$ | $$10$$ | $$9$$ | $$15$$ | $$12$$ | $$7$$ | $$9$$ | $$9$$ |
Find the median of $$64$$ and $$225$$.
Find the missing frequency $$f_{1}$$ and $$f_{2}$$ in the table given below, it is being given that the mean of the given frequency distribution is $$50$$.
| Class | $$0-20$$ | $$20-40$$ | $$40-60$$ | $$60-80$$ | $$80-100$$ | Total |
| Frequency | $$17$$ | $$f_{1}$$ | $$32$$ | $$f_{2}$$ | $$19$$ | $$120$$ |
The lengths of $$50$$ leaves of a plant are measured corrcct he nearest milimetre and the data obtained is represent in the following table.
| Length $$(mm)$$ | $$109-117$$ | $$118-126$$ | $$127-135$$ | $$136-144$$ | $$145-153$$ | $$154-162$$ | $$163-171$$ |
| No of leaves | $$4$$ | $$6$$ | $$14$$ | $$13$$ | $$6$$ | $$4$$ | $$3$$ |
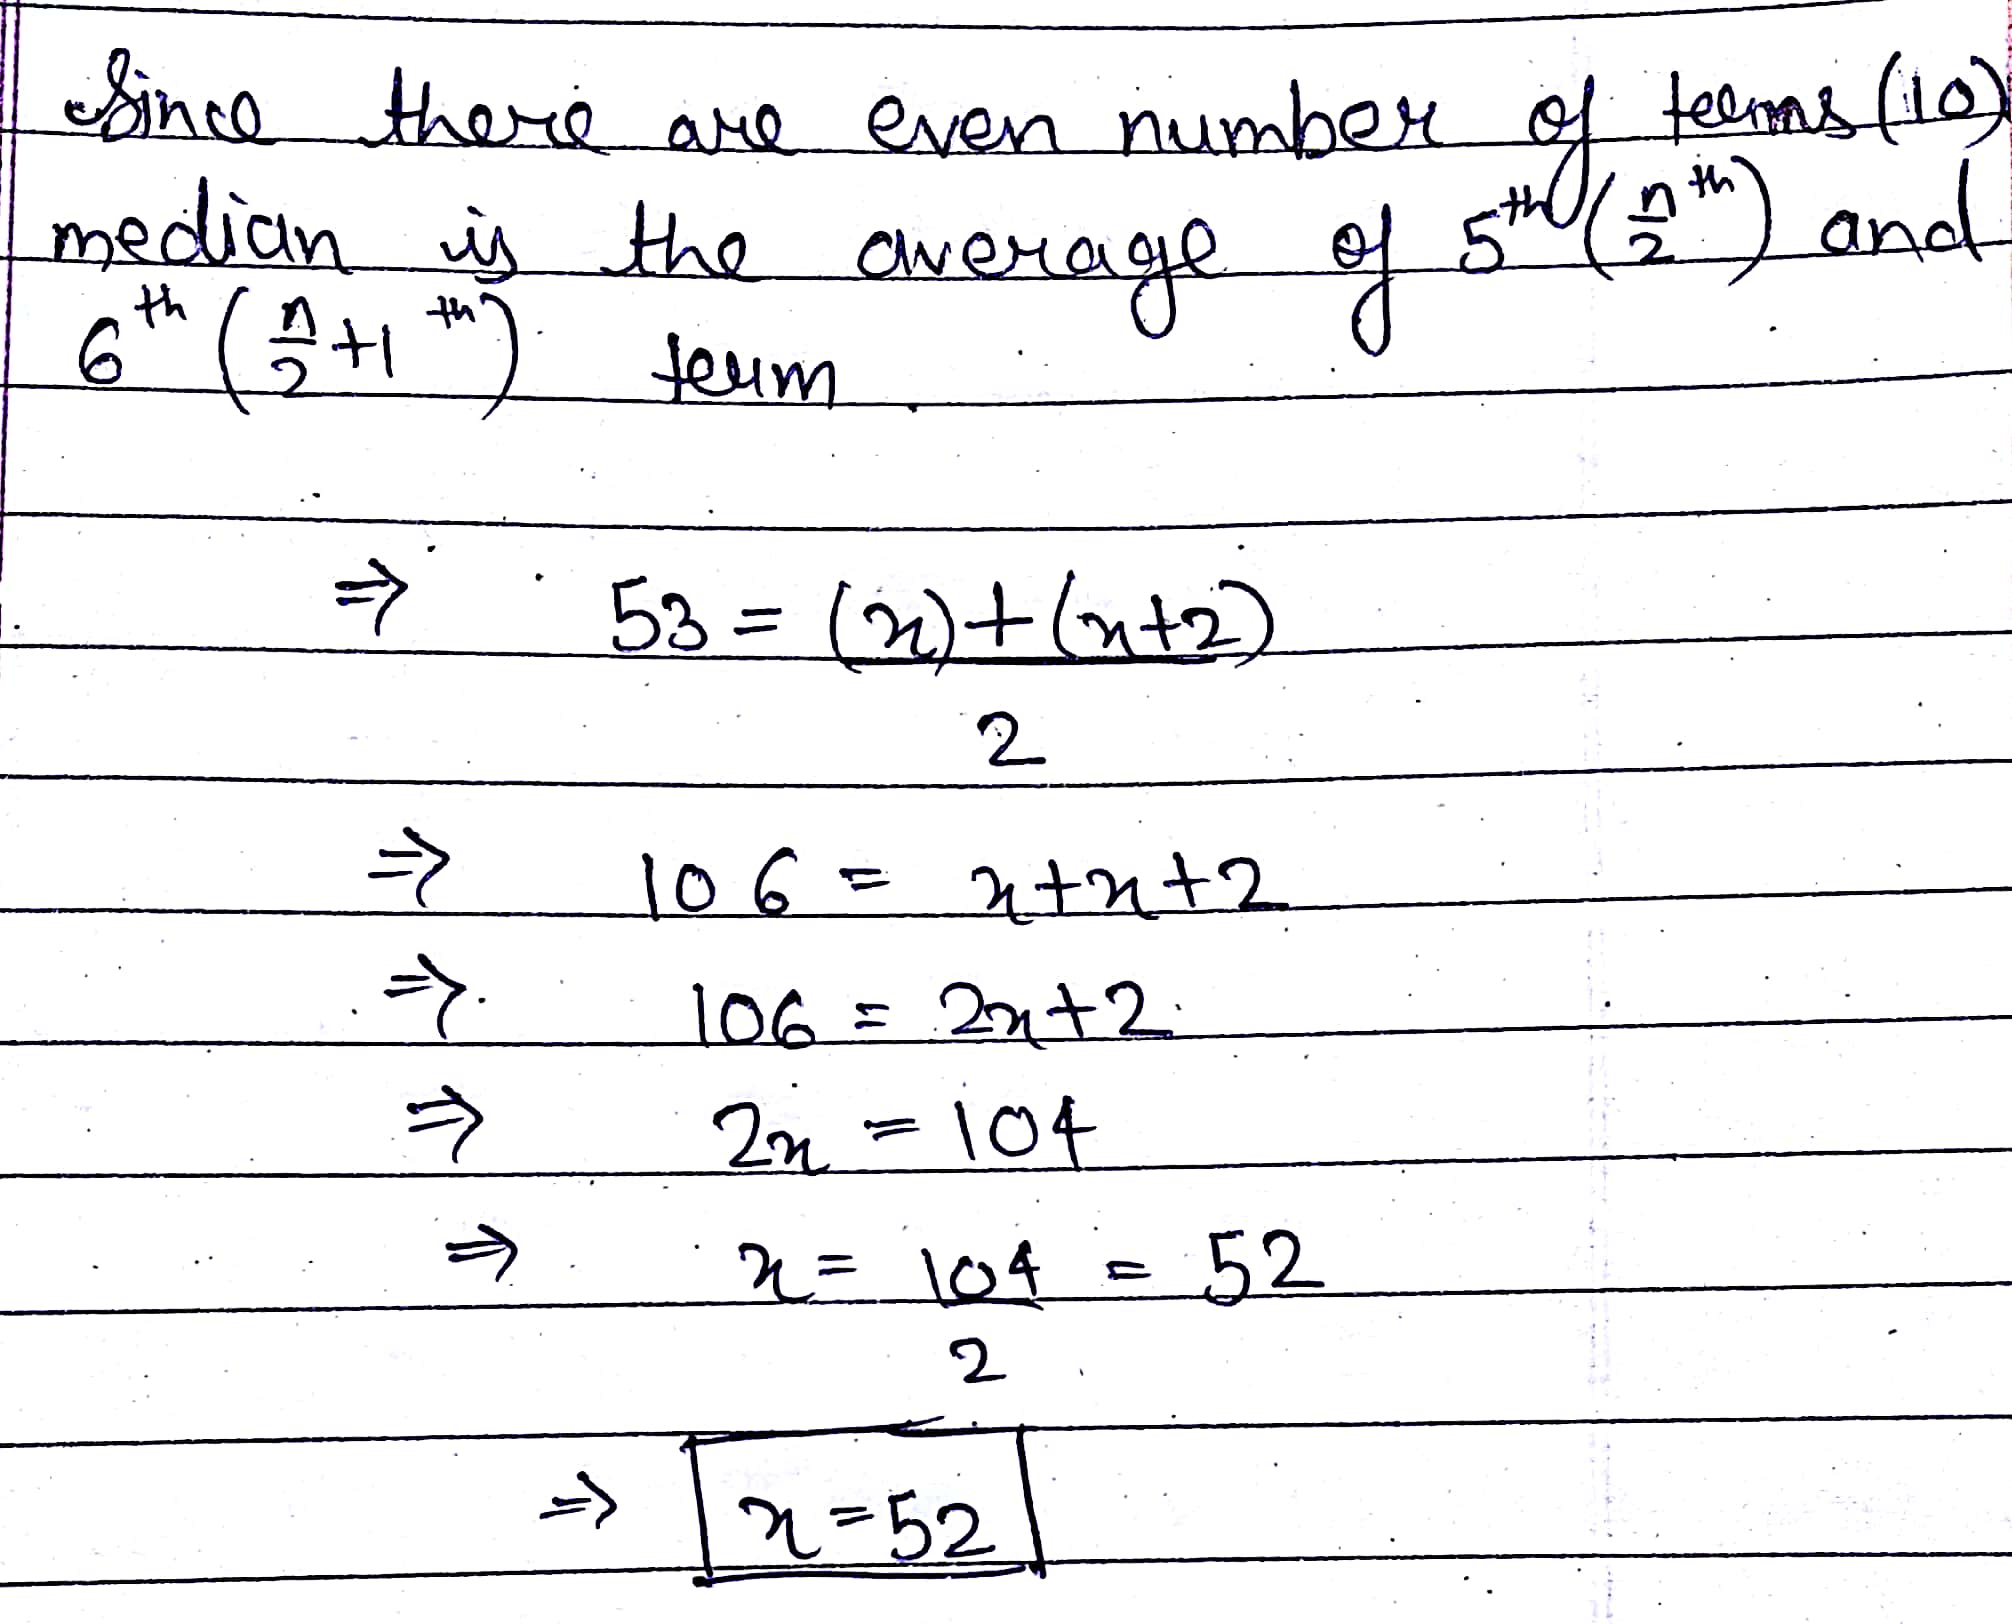
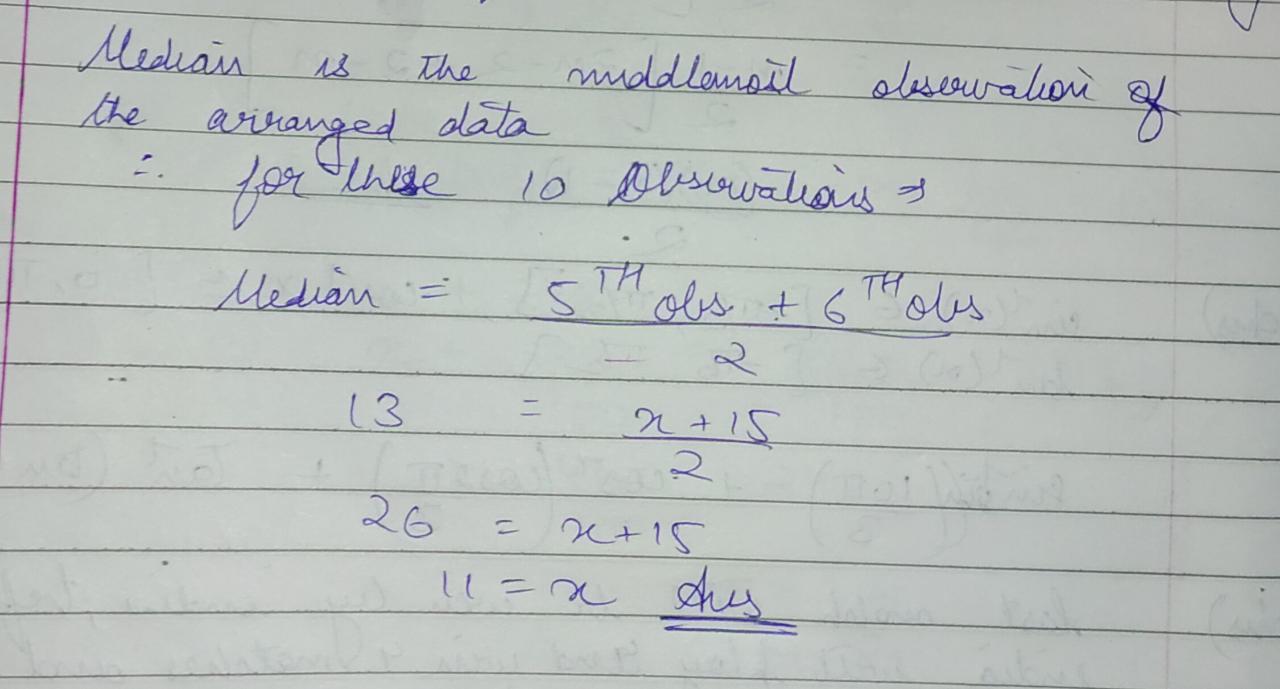
There are 10 observations arranged in ascending order as given below.
$$45,47,50,52,x,x+2,60,62,63,74.$$
The median of these observation is $$53$$. Find the value of $$x$$
(a)The class interval having highest frequency is-
(b)The class-mark of class 50-60 is-
(c)The size of each class intervals is-
Find the mode of $$90,55,67,55,75,40,35,55,95$$
Find the median of the data $$13,16,12,14,19,12,14,13$$.
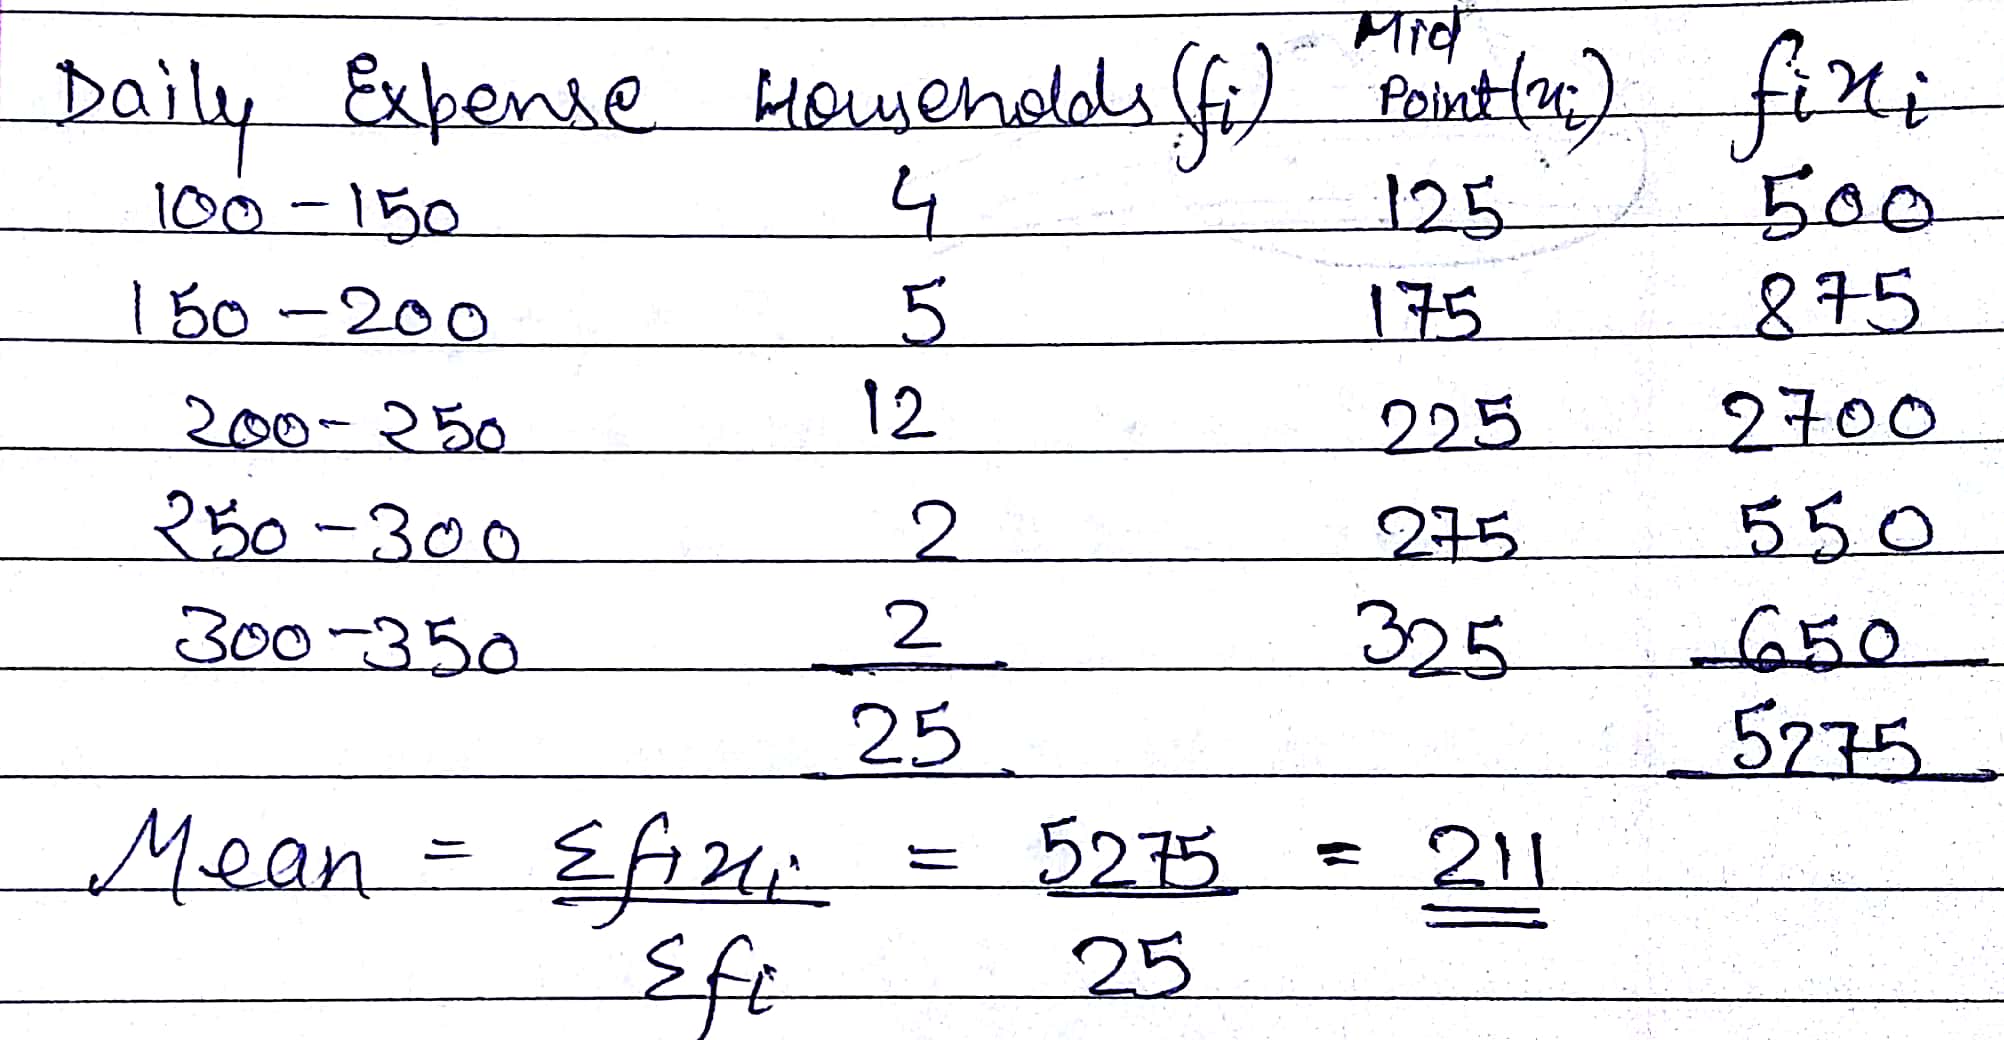
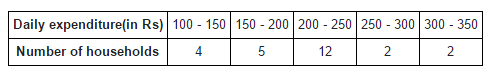
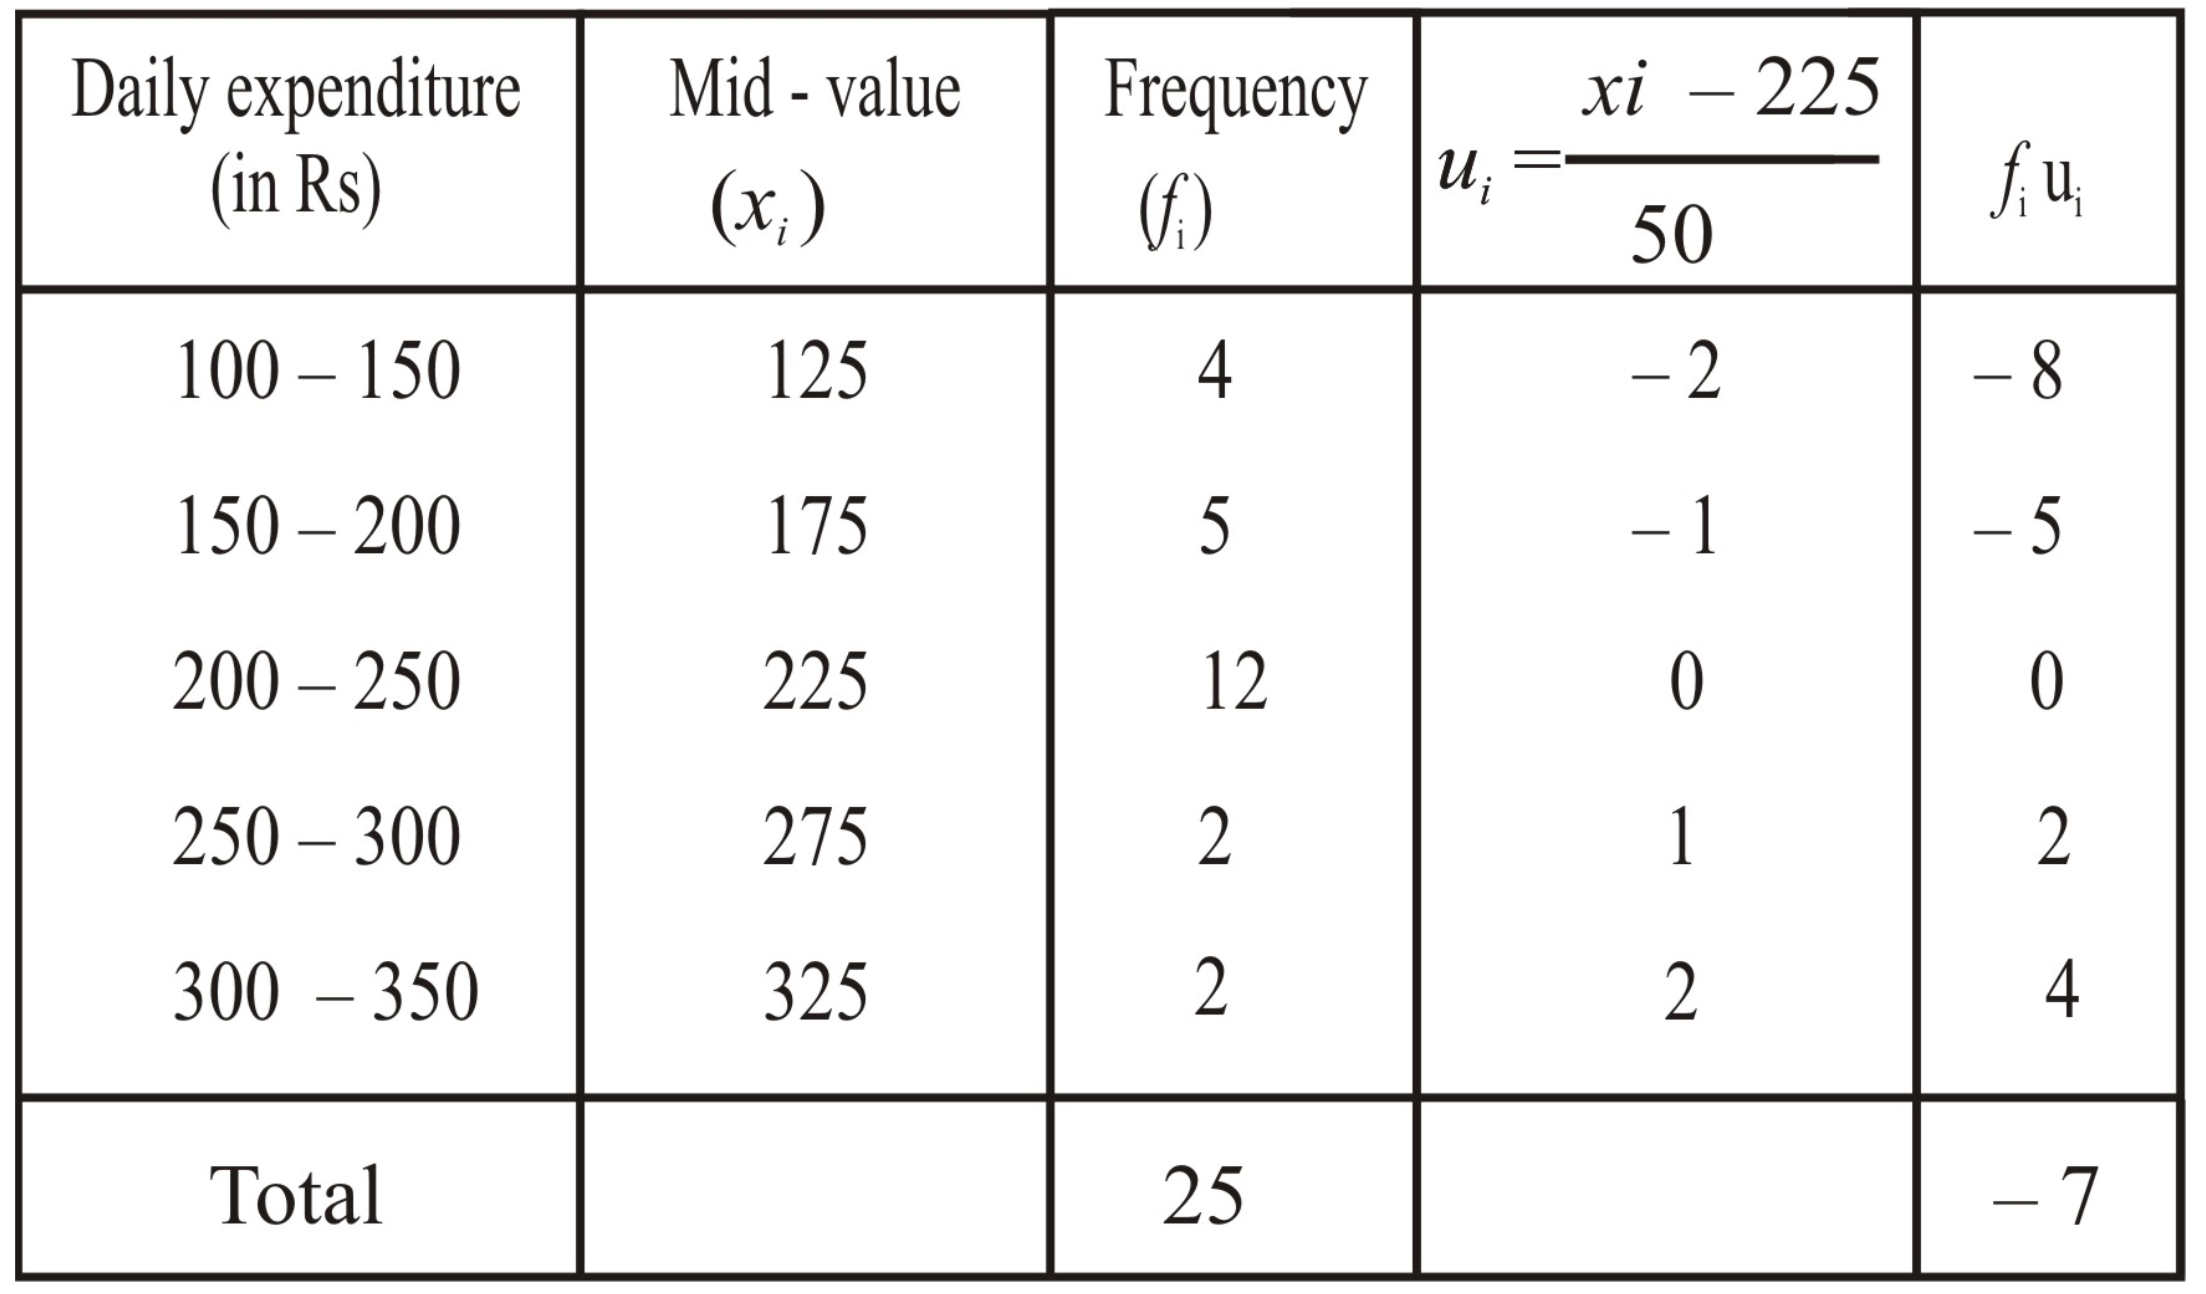
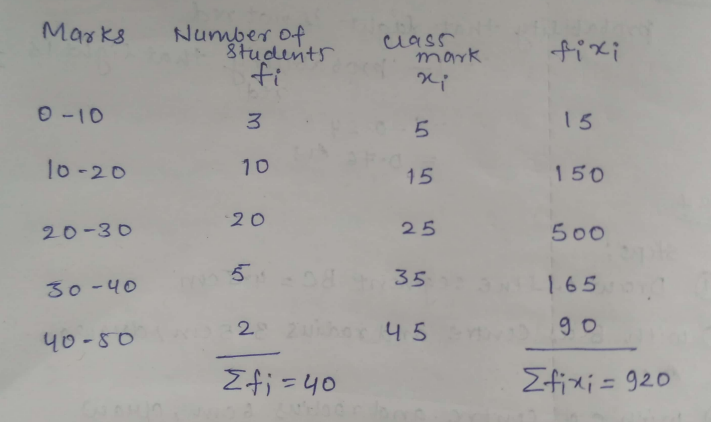
The table below- shows the daily expenditure on food of $$25$$ households in a locality.
| Daily expenses (in Rs.) | 100-150 | 150-200 | 200-250 | 250-300 | 300-350 |
| No. of households | 4 | 5 | 12 | 2 | 2 |
| Daily Expense | Households (fi) | Mid Point (xi) | fi xi |
| 100 - 150 | 4 | 125 | 500 |
| 150 - 200 | 5 | 175 | 875 |
| 200 - 250 | 12 | 225 | 2700 |
| 250 - 300 | 2 | 275 | 550 |
| 300 - 350 | 2 | 325 | 650 |
| 25 | 5275 |
Find the mean of the following distribution by step-deviation method:
| Daily expenditure (in Rs.) | $$100-150$$ | $$150-200$$ | $$200-250$$ | $$250-300$$ | $$300-350$$ |
| No. of households | $$4$$ | $$5$$ | $$12$$ | $$2$$ | $$2$$ |
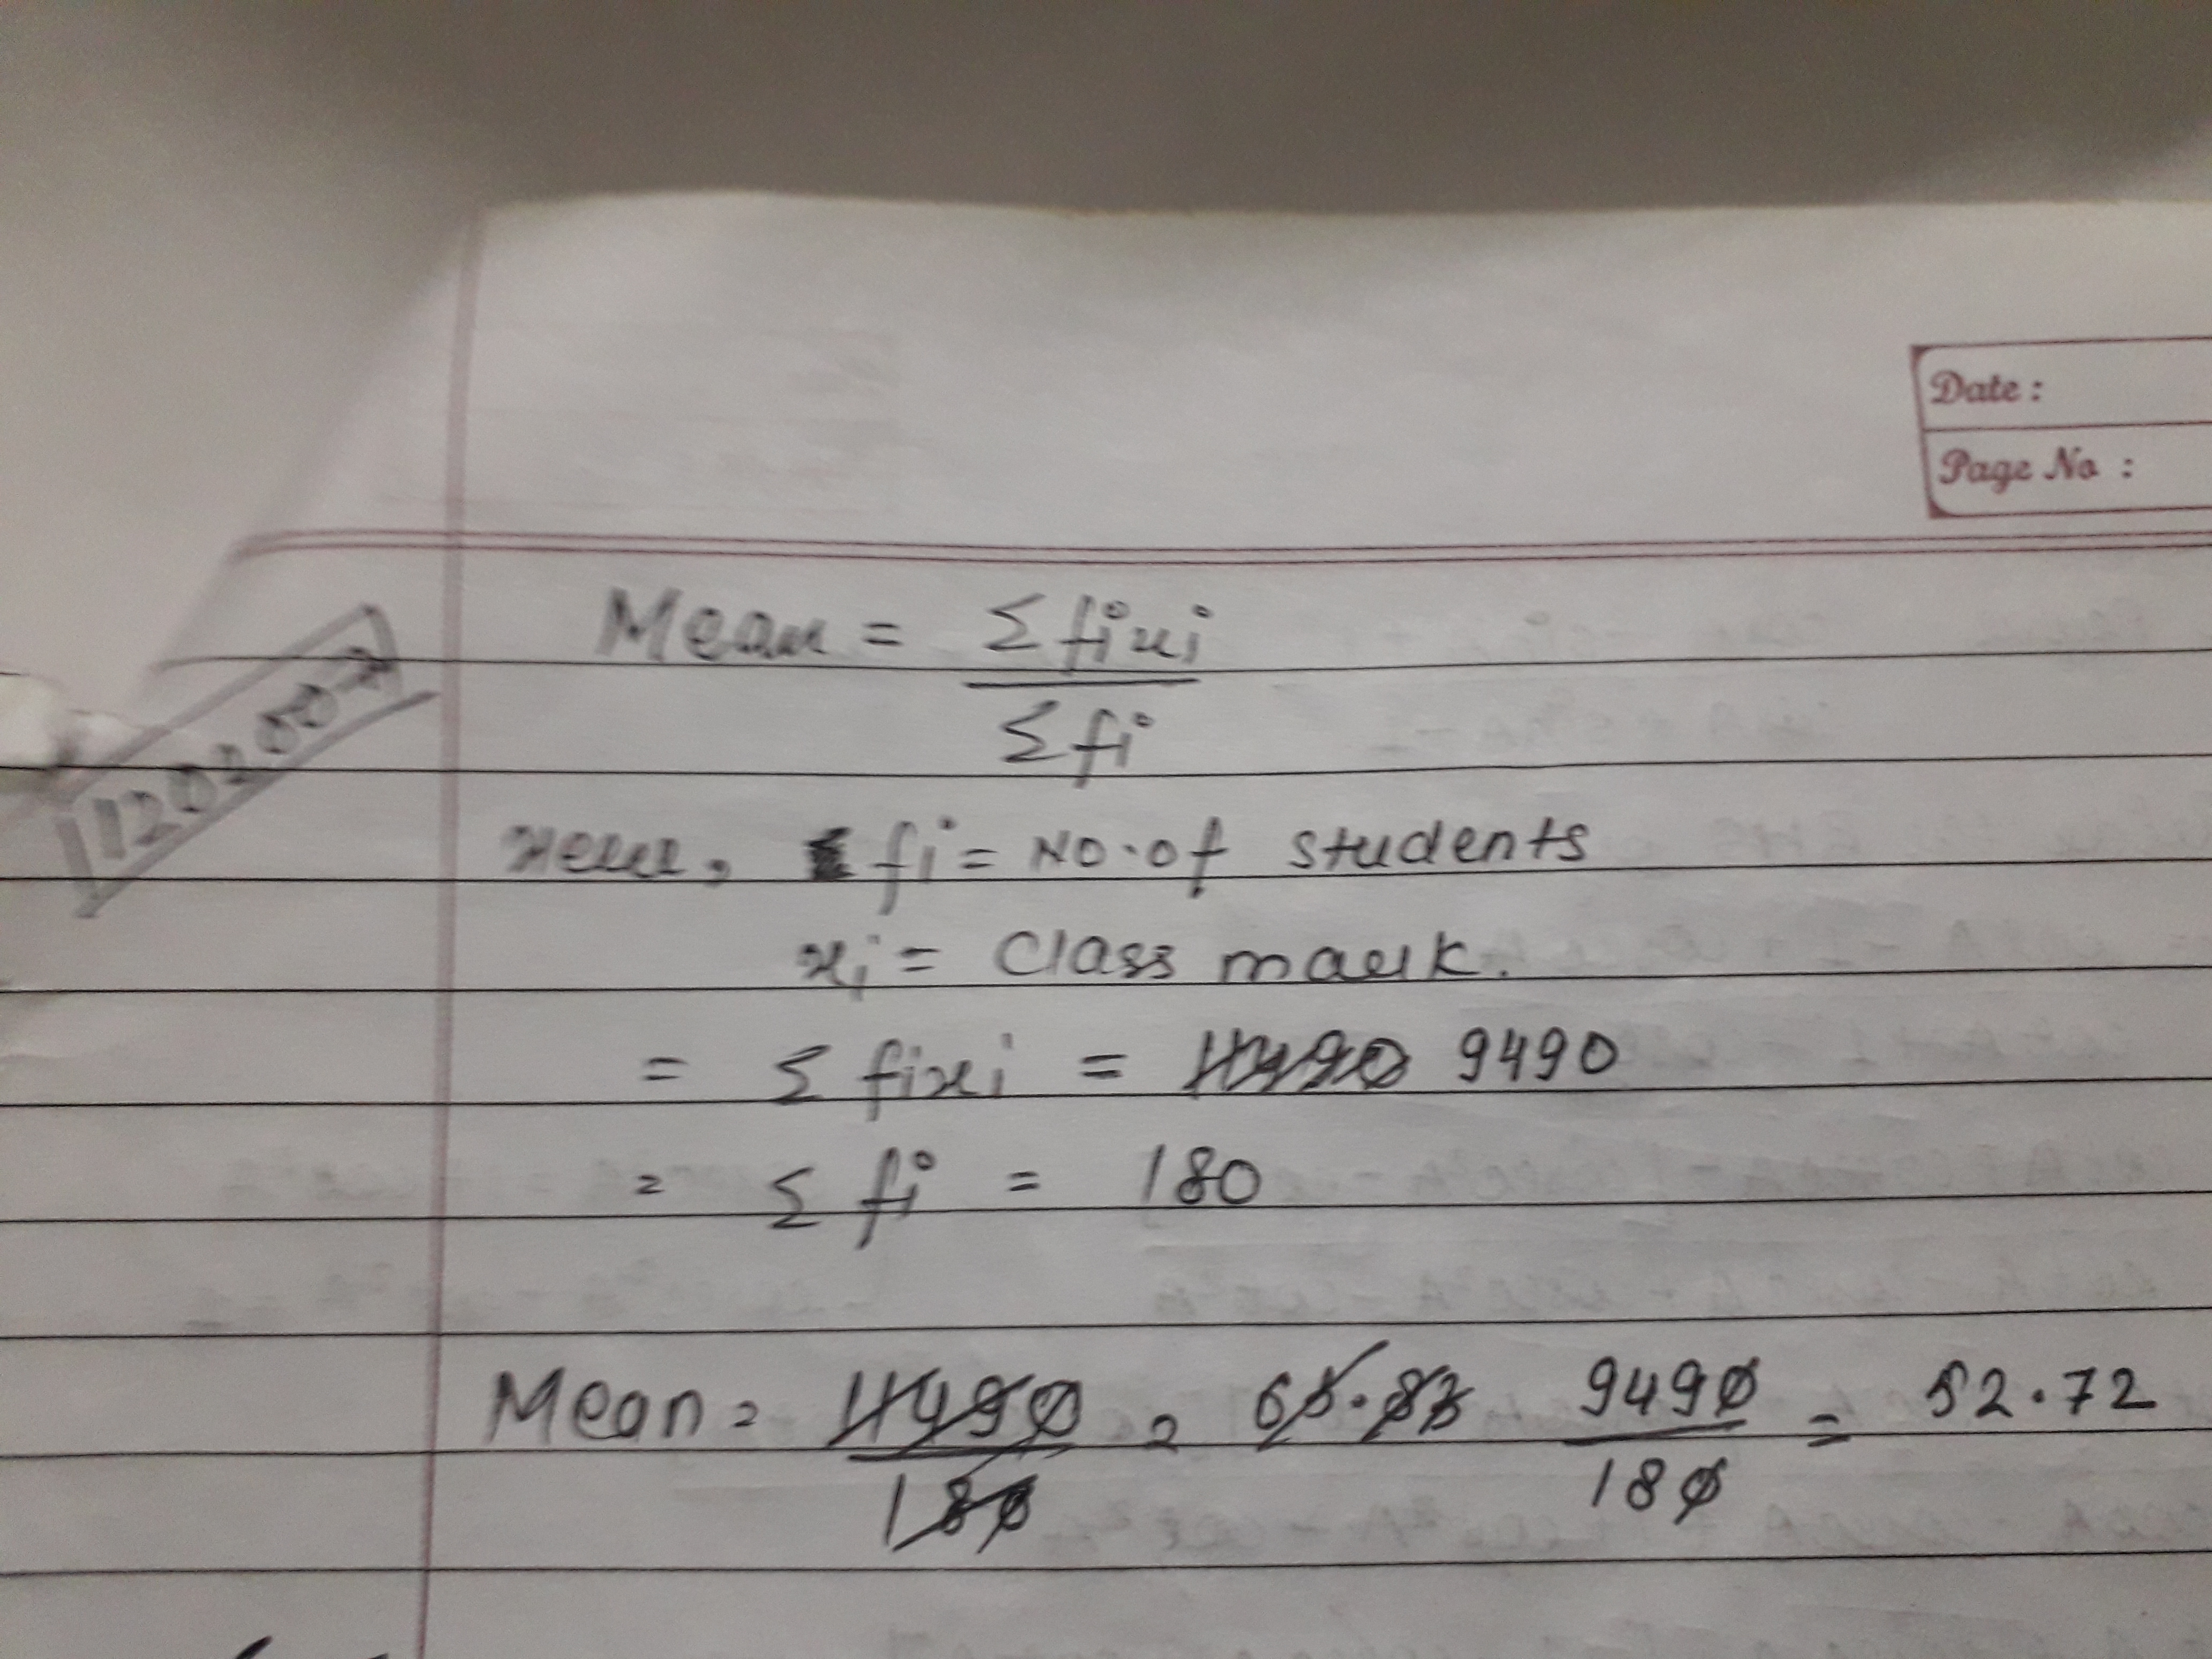
Find mean:
The marks obtained by 200 students are given below :
| Marks | No of students |
| 0-10 | 5 |
| 10-20 | 10 |
| 20-30 | 11 |
| 30-40 | 20 |
| 40-50 | 27 |
| 50-60 | 38 |
| 60-70 | 40 |
| 70-80 | 09 |
| 80-90 | 14 |
| 90-100 | 6 |
Find the mean salary of $$80$$ workers of a factory from the following tables:
| Salary (in Rs} | Numbers of workers |
| $$5000$$ | $$22$$ |
| $$6000$$ | $$18$$ |
| $$7000$$ | $$15$$ |
| $$8000$$ | $$10$$ |
| $$9000$$ | $$8$$ |
| $$10000$$ | $$7$$ |
The following table draws the income of finance of a grape season find the mean of their income.
| Income (thousand Rs) | $$20-30$$ | $$30-40$$ | $$40-50$$ | $$50-60$$ |
| Farmer | $$10$$ | $$11$$ | $$15$$ | $$16$$ |
| Mark obtained | 25-35 | 35-45 | 45-55 | 55-65 | 65-75 | |
| Number of students | 7 | 31 | 33 | 17 | 11 |
From one footwear shop, $$12$$ pairs of chappals were sold. The sizes of these chappals are given below. Find their mode: $$7,8,6,7,7,5,9,7,6,7,8,7$$
In the following table, the toll paid by drives and the number of vehicles is shown. Find the mean of the toll by assumed mean method.
| Toll (Rupees) | $$300-400$$ | $$400-500$$ | $$500-600$$ | $$600-700$$ | $$700-800$$ |
| No. of vehicles | $$80$$ | $$110$$ | $$120$$ | $$70$$ | $$40$$ |
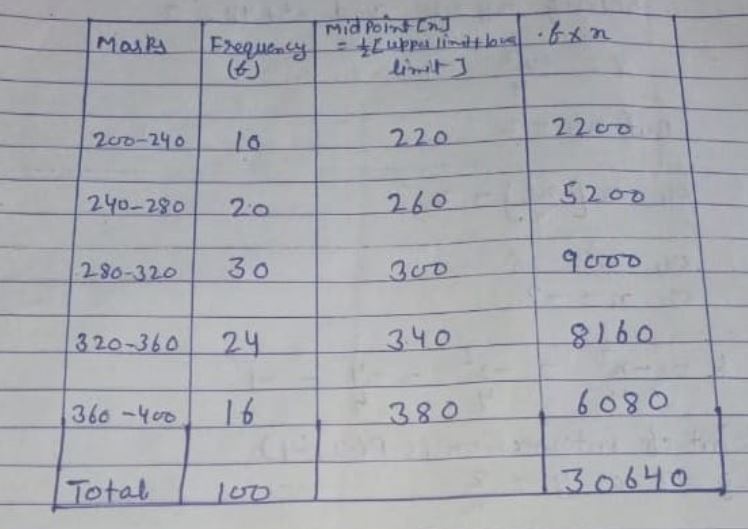
The marks obtained in an examination of $$400$$ marks is given in the following frequency distribution table. Find the mean of the distribution.
| Marks | 200-240 | 240-280 | 280-320 | 320-360 | 360-400 |
| Frequency | 10 | 20 | 30 | 24 | 16 |
Calculate the mean from the following data:

Find the median of :
(i) 5,7,9,11,15,17,2,23 and 19
In the following table age distribution of patient in the city, suffering from some diseases is given that the average age ( in years) per patient.
| Age | No. of patient |
| 5-14 | 6 |
| 15-24 | 11 |
| 24-24 | 21 |
| 35-44 | 23 |
| 45-54 | 54 |
| 55-60 | 5 |
Find the mode of the given set of numbers $$2,3,5,3,4,7,3,2,1,7,3$$.
The amount collected by $$15$$ students for flood relief find is given below. Answer the following.
| Amount | Number of students |
| $$0-10$$ | $$3$$ |
| $$10-20$$ | $$4$$ |
| $$20-30$$ | $$5$$ |
| $$30-40$$ | $$2$$ |
| $$40-50$$ | $$1$$ |
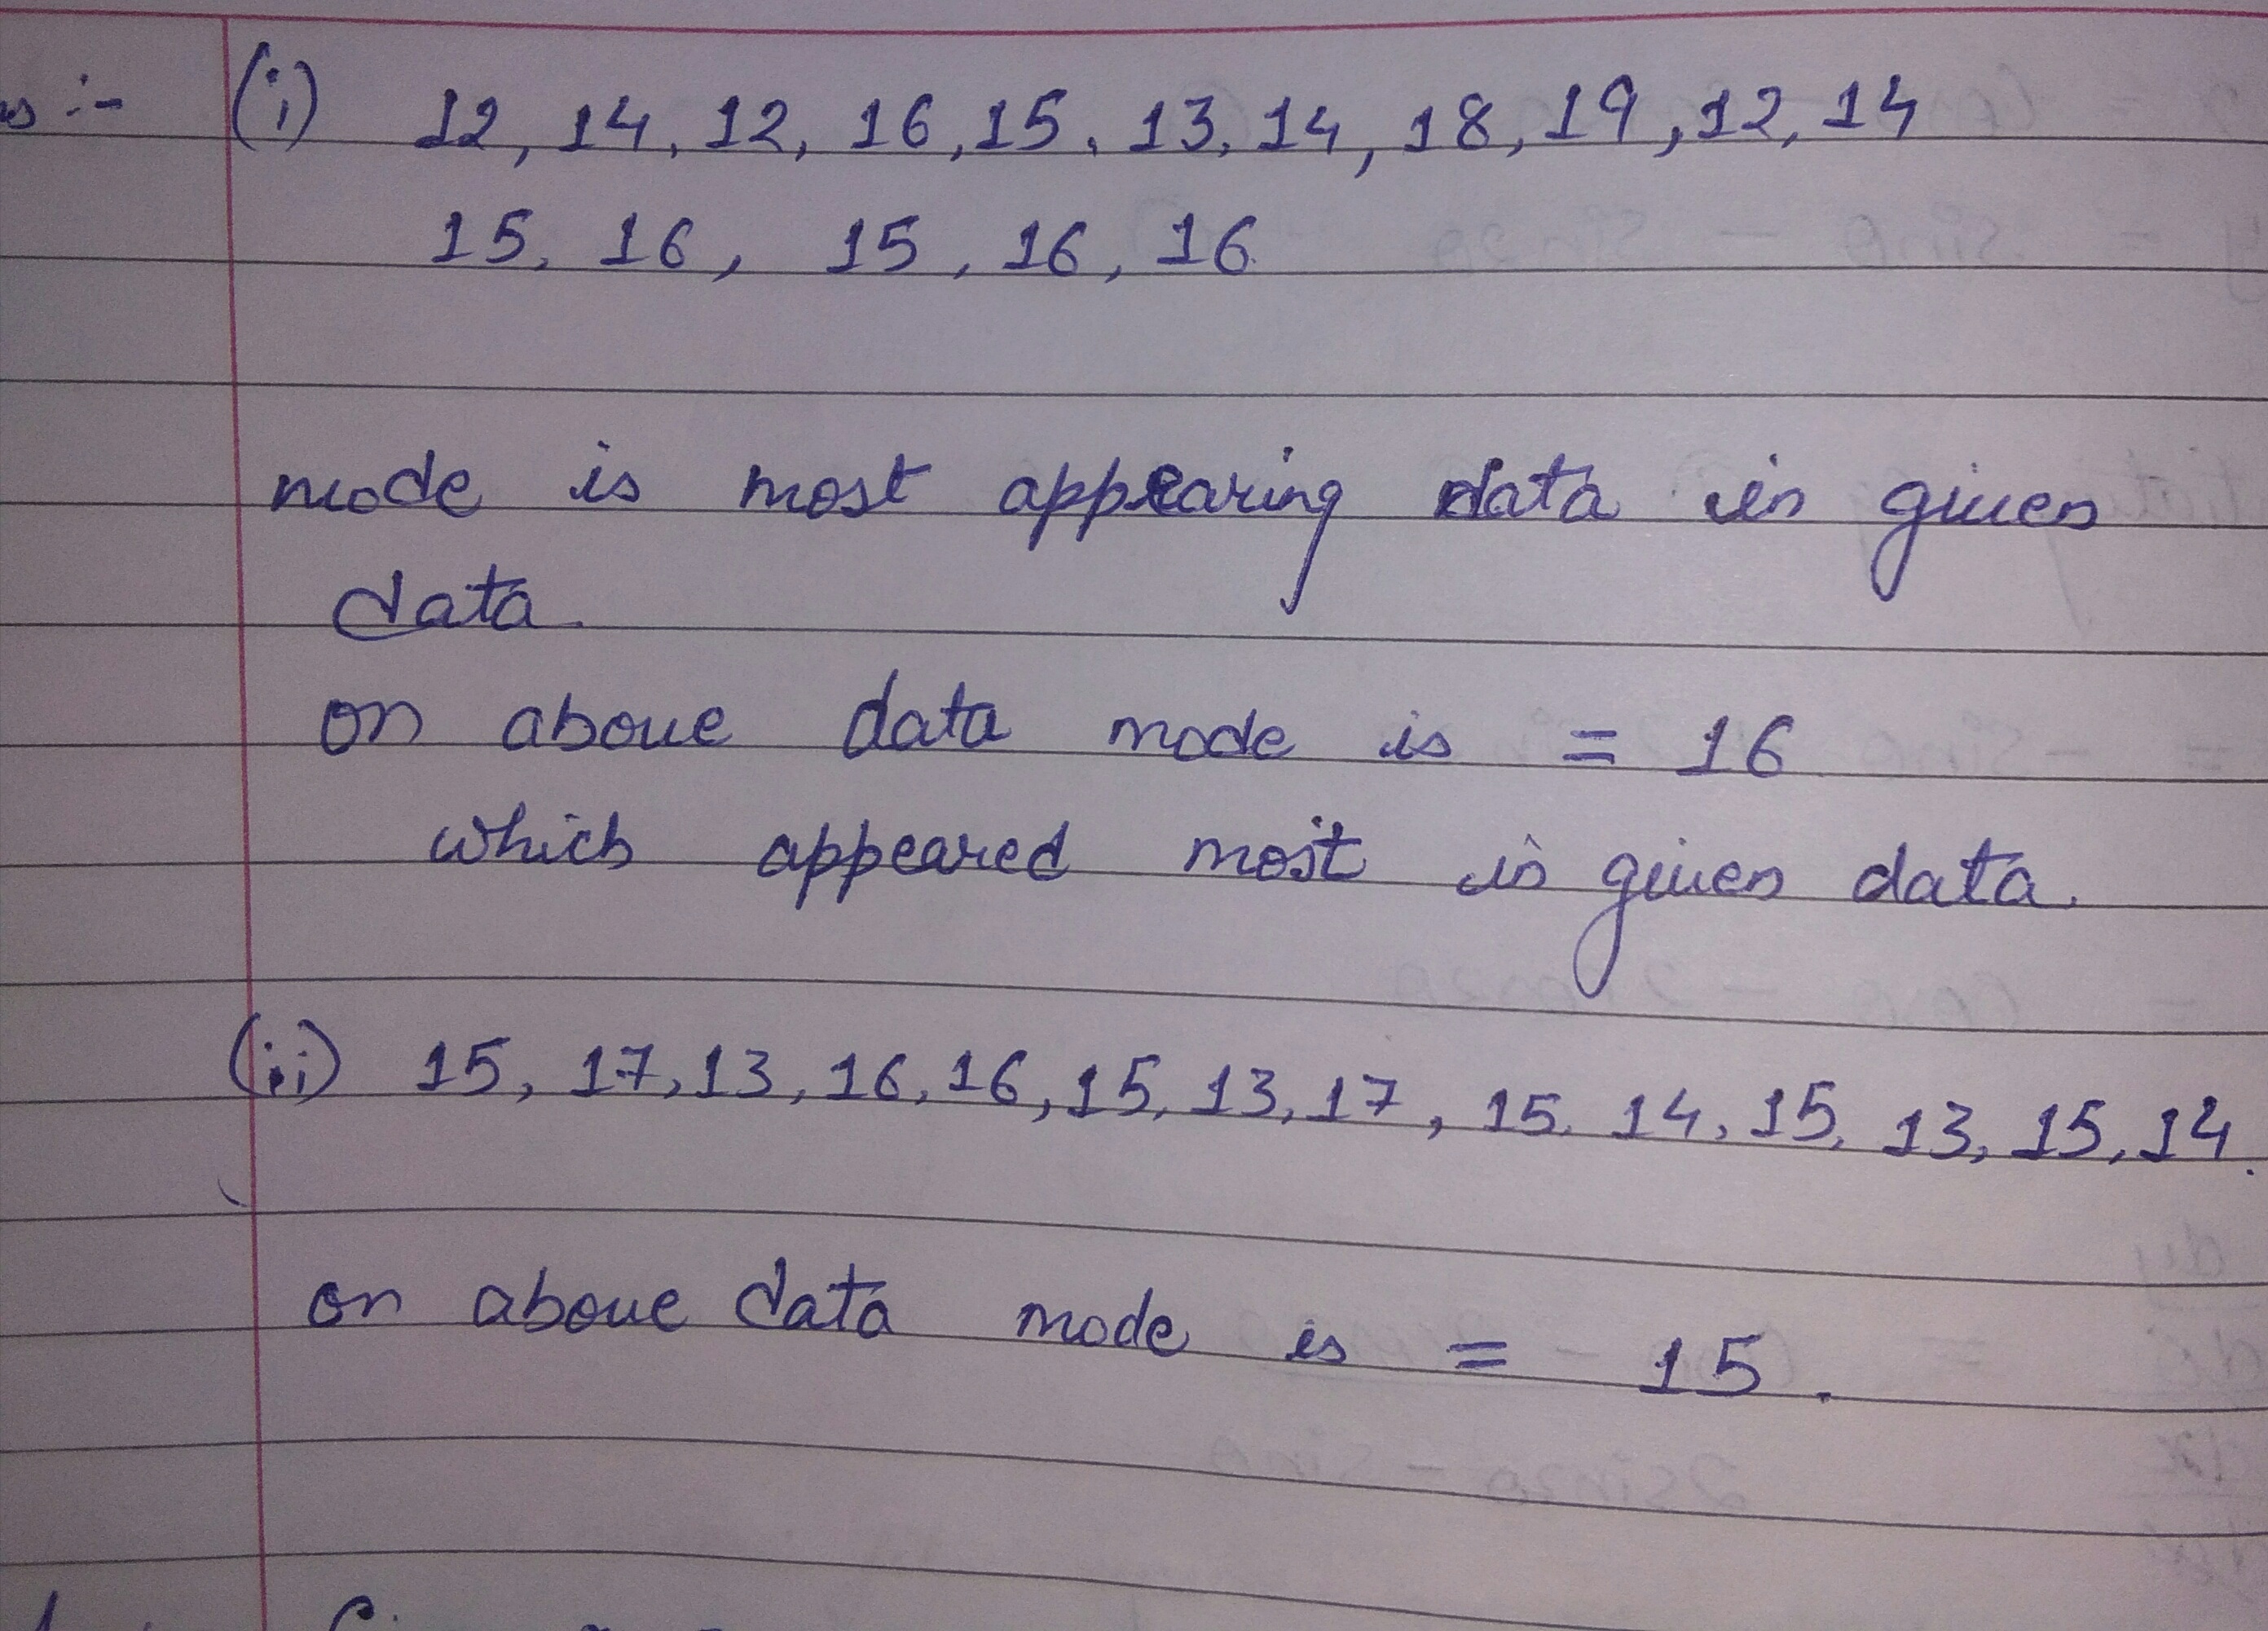
Find the mode of the following data
i) $$12,14,12,16,15,13,14,18,19,12,14,15,16,15,16,16,$$
ii) $$15,17,13,16,16,15,13,15,17,15,14,15,13,15,14,$$
Mean for the following frequency distribution table.
| 0-5 | 5-10 | 10-15 | 15-20 | 20-25 | 25-30 |
| 5 | 3 | 9 | 10 | 8 | 5 |
Find the median of 72, 66, 87, 92, 63, 78.
Find the mean of the following distribution
| 300-400 | 400-500 | 500-600 | 600-700 | 700-800 | 800-900 | |
| No. of girls | 4 | 18 | 9 | 7 | 6 | 3 |
A sequence, $$a,ax,ax^{2}, ......, ax^{n}$$, has odd number of terms. Find its median.
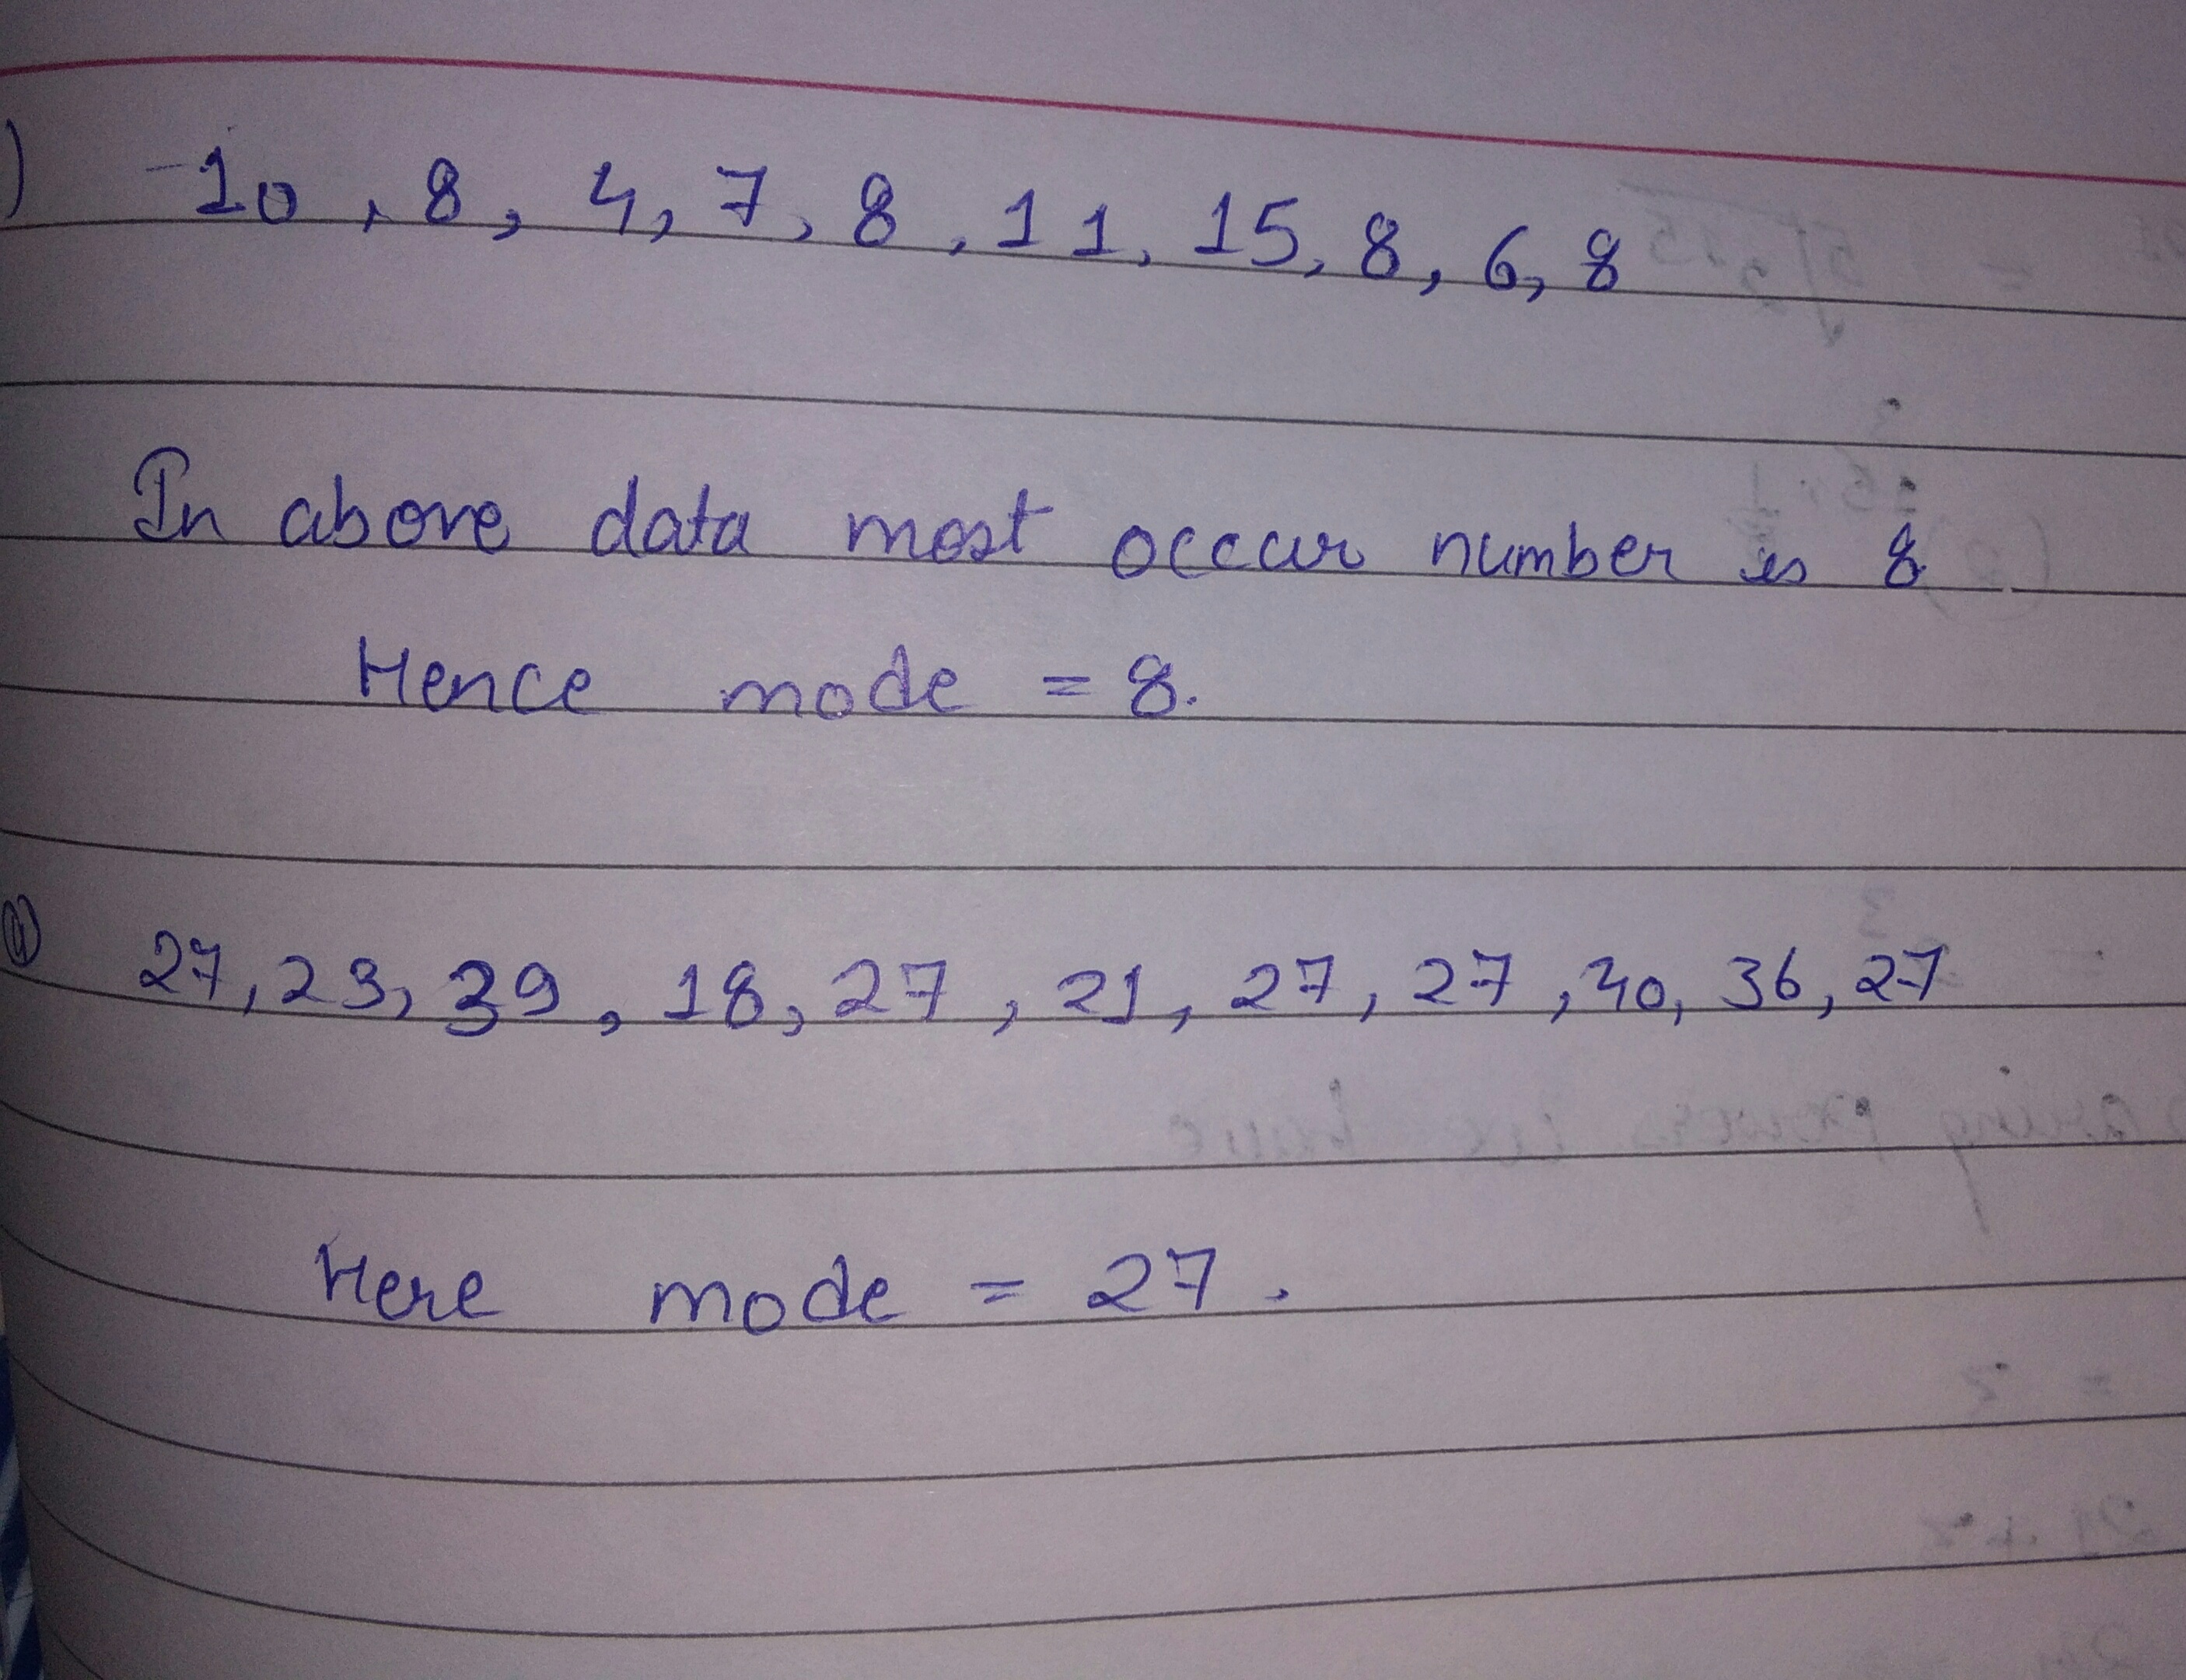
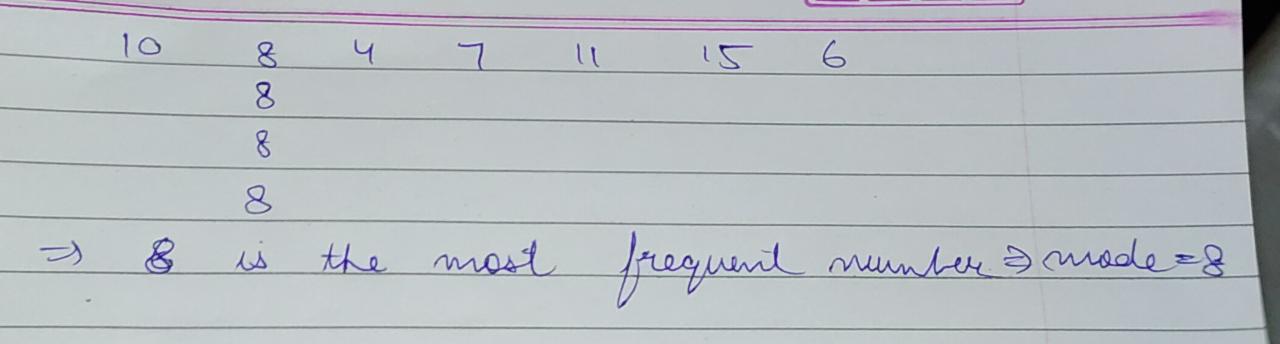
Find the mode of the data :
(i) 10,8,4,7,8,11,15,8,6,8,
(ii) 27,23,39,18,27,21,27,27,40,36,27
Calculate the mean of the distribution given below using the shortcut method.
| marks | 11-20 | 21-30 | 31-40 | 41-50 | 51-60 | 61-70 | 71-80 |
| number of students | 2 | 6 | 10 | 12 | 9 | 7 | 4 |
The arithmetic mean of following data is $$17$$. find the value of $$P$$.
| Term(x) | 10 | 15 | 20 | 25 |
| Frequency(f) | 7 | 10 | P | 6 |
Following observations have been written in ascending order. If median of the data is $$22$$ then find the value of $$x$$.
$$11, 12, 14, 16, 18, x+2, x+4, 30, 32, 35, 41$$
If the numbers $$3,6,7,10,x,15,19,20,25,28$$ are in ascending order and their median is $$13$$. Calculate the value of $$x$$.
The average weight of 3 students P,Q and R is 84kg.Anothe students S joins the group and the average becomes 80kg. If another man T whose weight is 3kg more than that of S, replaces P, then the average weight of Q,R,S and T becomes 79 kg then the weight of P is
The average salary of all the workers in factory isThe average salary of 9 mechanic is 5000 and for the rest of the workers itFind the total number of workers in the factory. a
$$15$$ student secured the following marks in a test in Statistic. Find the median marks
35, 28,13,17,20,30,19,29,11,10,29,23,18, 25,17
Find the mode of the data:
10,8,4,7,8,11,15,8,6,8
For the following distribution, find the mean:
| Class Marks | $$10$$ | $$20$$ | $$30$$ | $$40$$ | $$50$$ | $$60$$ |
| No of students | $$3$$ | $$1$$ | $$2$$ | $$7$$ | $$8$$ | $$5$$ |
Write the empirical relationship between the three measures of central tendency?
Find the median and mode of the data: $$35,32,35,42,38,32,34$$
Find the median of $$\dfrac{2}{3}, \dfrac{4}{5}, \dfrac{1}{2}, \dfrac{3}{4}, \dfrac{6}{5}$$.
Write the formula to find mean for grouped data direct method.
The weights of new born babies (in kg) in a hospital on a particular day are as follows:$$2.3, 2.2, 2.1, 2.7, 2.6, 3.0, 2.5, 2.9, 2.8, 3.1, 2.5, 2.8, 2.7, 2.9, 2.4$$Determine the range.
If the variable takes the values $$\displaystyle 0, 1, 2, \cdots ,n$$ with frequencies proportional to $$\displaystyle q^{n},^{n}C_{r}q^{n-1}p,^{n}C_{2}q^{n-2}p^{2},\cdots ,p^{n}$$ where $$p+q=1,$$ then show that mean square deviation is $$\displaystyle n^{2}p^{2}+npq$$ and variance is $$npq. $$
Find' the average marks of student from the following data:
| Marks | No. of students |
| Above 0 | 80 |
| Above 10 | 78 |
| Above 20 | 71 |
| Above 30 | 65 |
| Above 40 | 53 |
| Above 50 | 45 |
| Above 60 | 25 |
| Above 70 | 14 |
| Above 80 | 10 |
| Above 90 | 8 |
| Above 100 | 0 |
If true then enter $$1$$ and if false then enter $$0$$
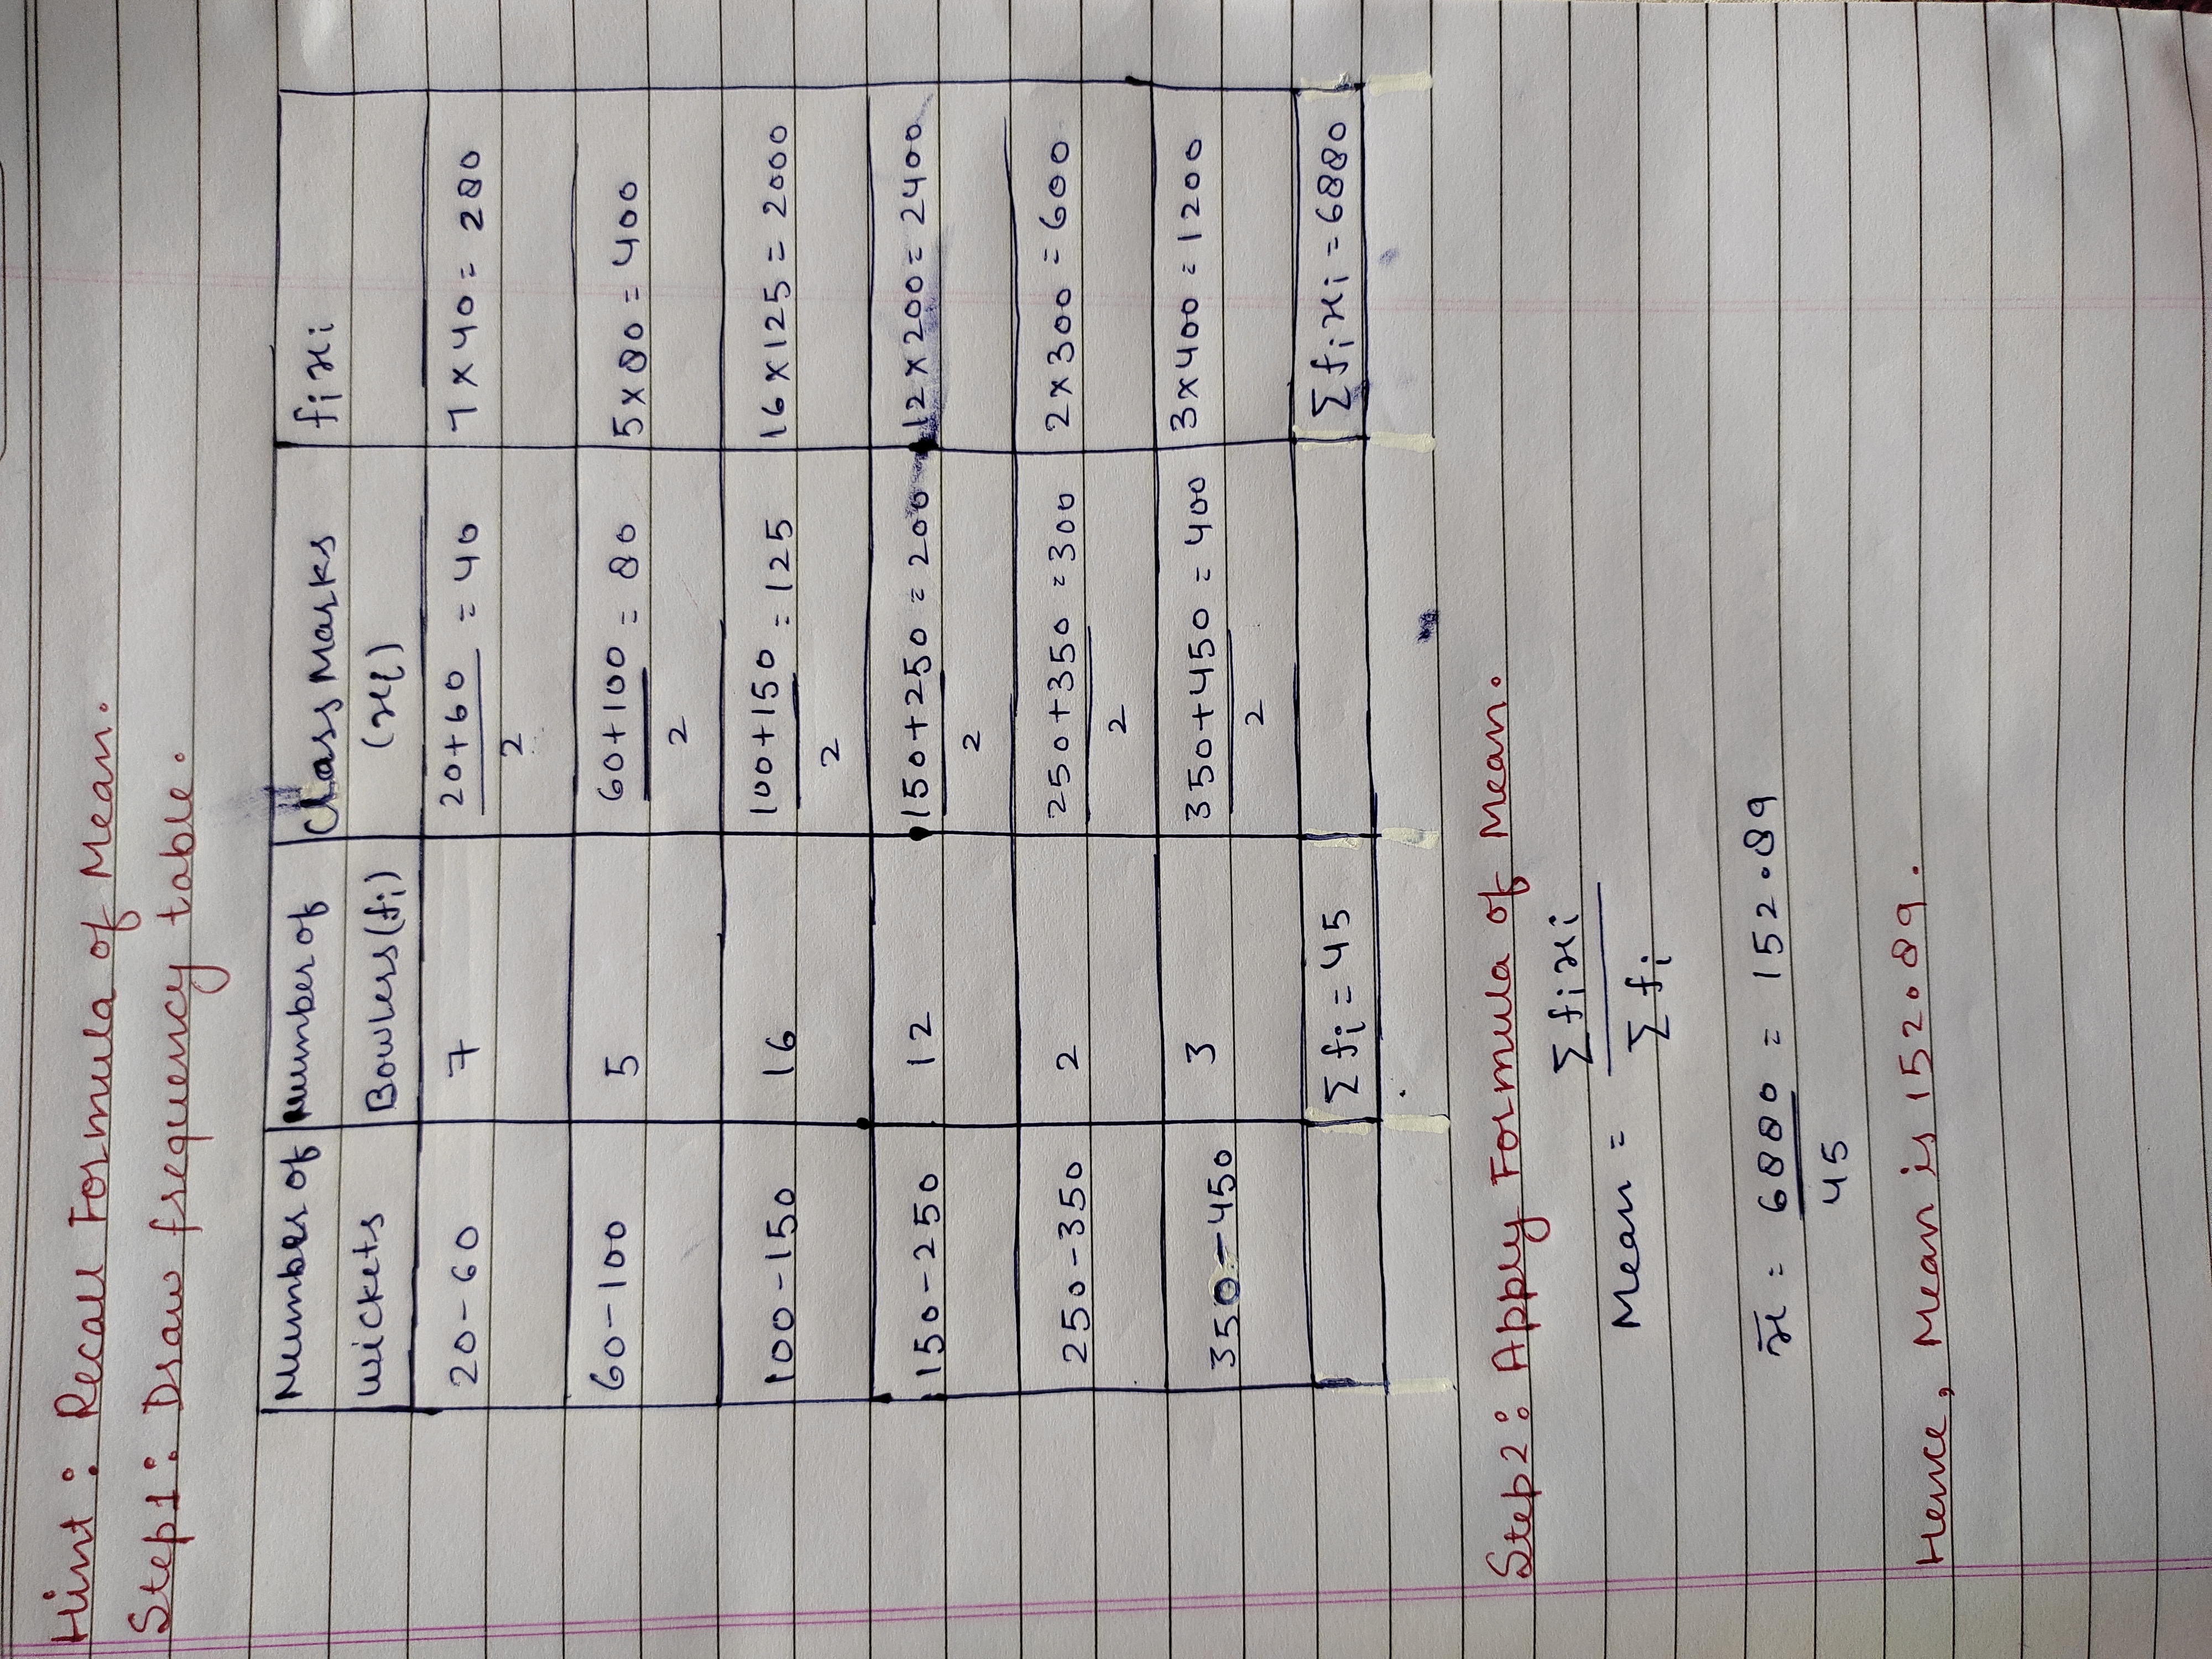
The distribution below shows the number of wickets taken by bowlers in one day' cricket matches. Find the mean number of wickets by choosing a suitable method. What does the mean signify?
| No. of wickets | No. of bowlers |
| 20-60 | 7 |
| 60-100 | 5 |
| 100-150 | 16 |
| 150-250 | 12 |
| 250-350 | 2 |
| 350-450 | 3 |
If true, then enter $$1$$ and if false, then enter $$0$$
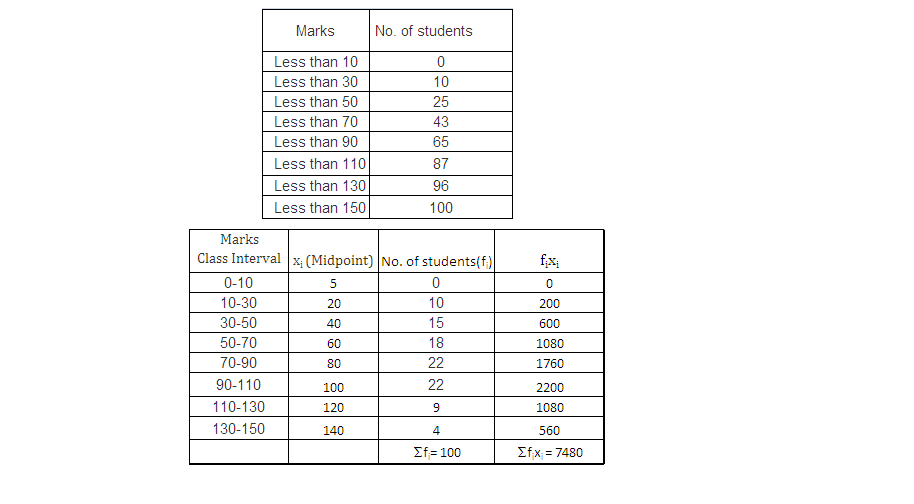
Compute the mean for the following data:
| Marks | No. of students |
| Less than 10 | 0 |
| Less than 30 | 10 |
| Less than 50 | 25 |
| Less than 70 | 43 |
| Less than 90 | 65 |
| Less than 110 | 87 |
| Less than 130 | 96 |
| Less than 150 | 100 |
If true then enter $$1$$ and if false then enter $$0$$
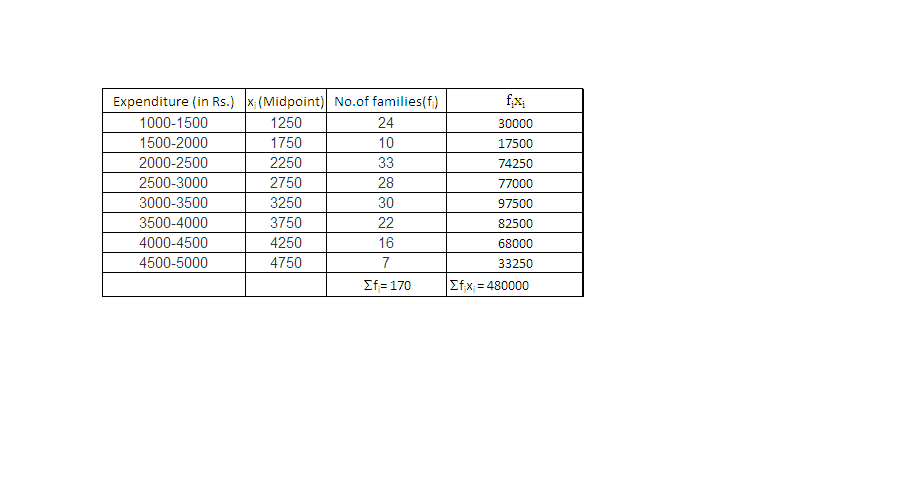
The following table gives the distribution of expenditures of different families on education. Find the mean expenditure on education of a family.
| Expenditure (in. Rs.) | No. of families |
| 1000-1500 | 24 |
| 1500-2000 | 10 |
| 2000-2500 | 33 |
| 2500-3000 | 28 |
| 3000-3500 | 30 |
| 3500-4000 | 22 |
| 4000-4500 | 16 |
| 4500-5000 | 7 |
If true then enter $$1$$ and if false then enter $$0$$
For\quad grouped\quad data\quad when\quad Class\quad Interval\quad \quad is\quad given,\quad we\quad find\quad the\quad Class\quad Mark.\\ Class\quad Mark\quad =\quad mid\quad point\quad of\quad an\quad interval\quad =\quad \frac { \left( Lower\quad limit\quad +\quad Upper\quad limit \right) }{ 2 } \\ Class\quad Mark\quad is\quad taken\quad as\quad { x }_{ i }\quad for\quad each\quad class\quad interval,\quad find\quad { x }_{ i }{ f }_{ i }.\quad \\ Now\quad Mean\quad Expenditure\quad =\quad \frac { \Sigma { x }_{ i }{ f }_{ i } }{ \Sigma { f }_{ i } } =\quad \frac { 480000 }{ 170 } =\quad 2823.529\quad =\quad Rs.2823.53\\
$$
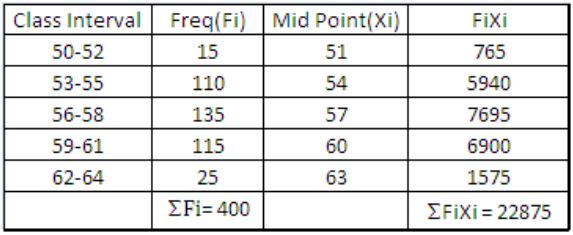
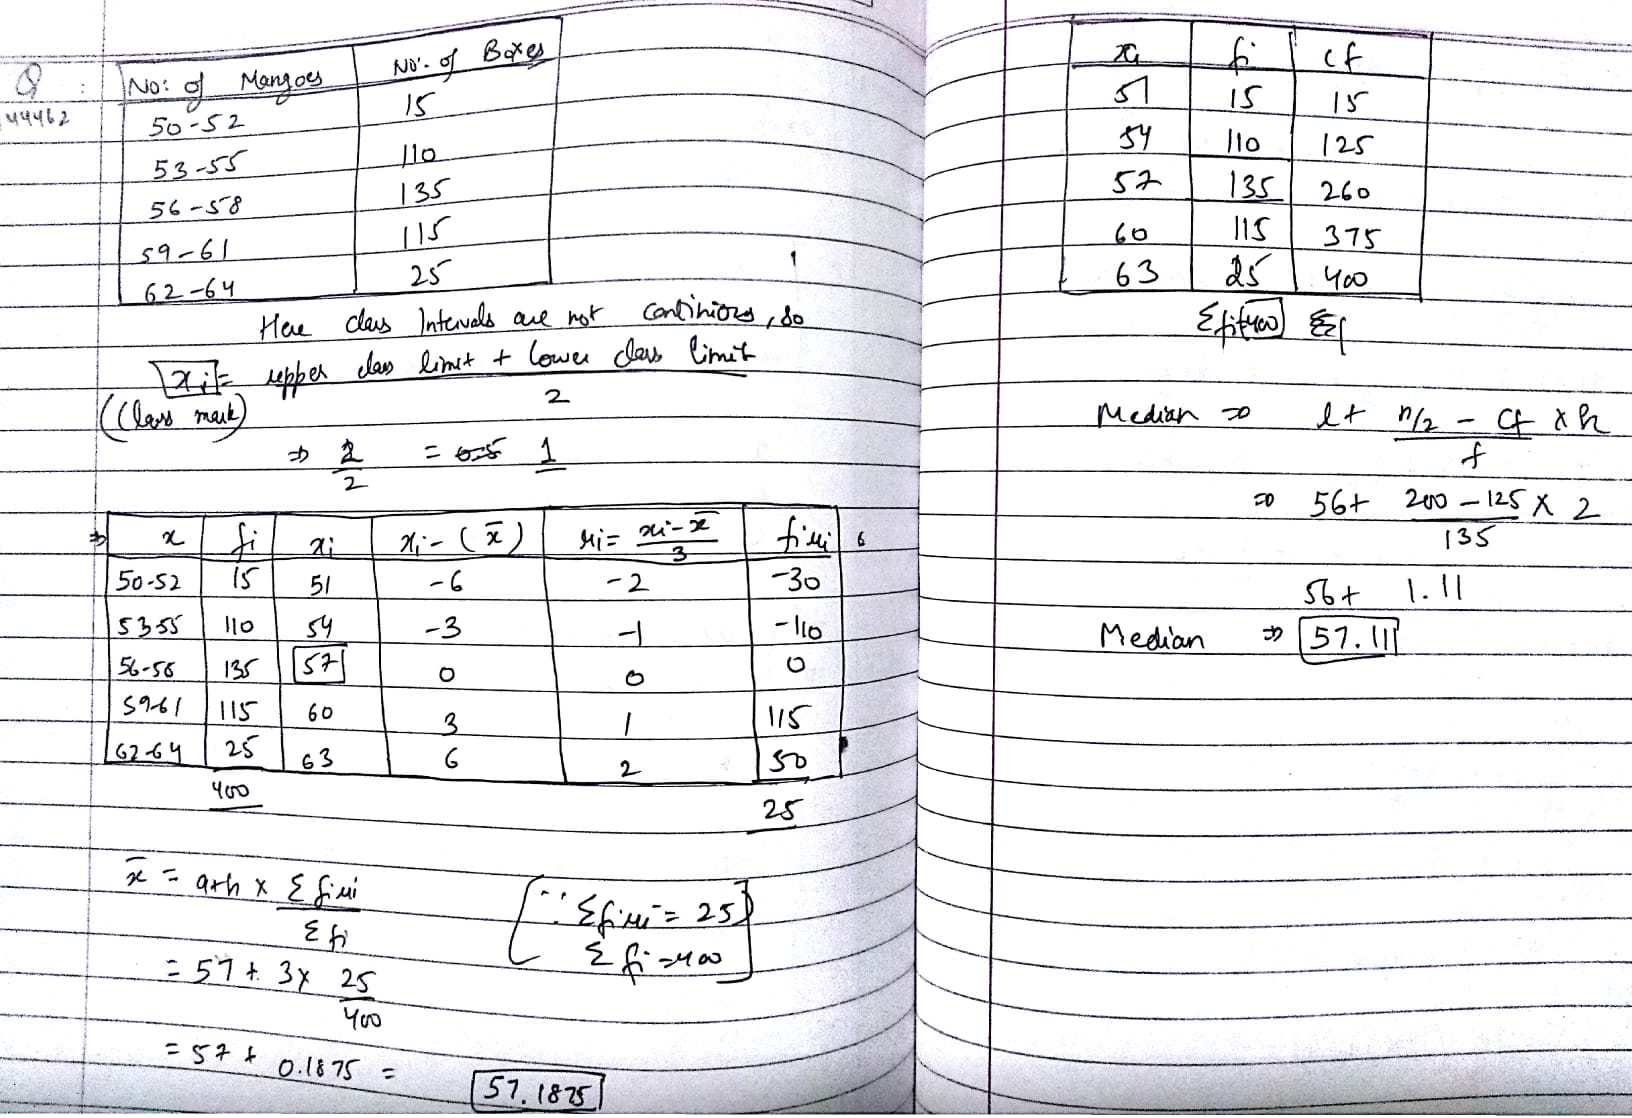
In a retail market, fruit vendors were selling mangoes kept in packing boxes. These boxes contained varying number of mangoes. The following was the distribution of mangoes according to the number of boxes.
| No. of mangoes | $$50-52$$ | $$53-55$$ | $$56-58$$ | $$59-61$$ | $$62-64$$ |
| No. of boxes | $$15$$ | $$110$$ | $$135$$ | $$115$$ | $$25$$ |
For\quad grouped\quad data\quad when\quad Class\quad Interval\quad \quad is\quad given,\quad we\quad find\quad the\quad Class\quad Mark.\\ Class\quad Mark\quad =\quad mid\quad point\quad of\quad an\quad interval\quad =\quad \dfrac { \left( Lower\quad limit\quad +\quad Upper\quad limit \right) }{ 2 } \\ Class\quad Mark\quad is\quad taken\quad as\quad { x }_{ i }\quad for\quad each\quad class\quad interval,\quad find\quad { x }_{ i }{ f }_{ i }.\quad \\ Now\quad Mean\quad =\quad \dfrac { \Sigma { x }_{ i }{ f }_{ i } }{ \Sigma { f }_{ i } } =\quad \dfrac { 22875 }{ 400 } =\quad 57.1875\quad =\quad 57.19 $$
The mean of the following frequency distribution of $$62.8$$ and the sum of all frequencies is $$50$$ Compute the sum of missing frequencies $$\displaystyle f_{1}$$ and $$\displaystyle f_{2}$$
| Class | 0 - 20 | 20 - 40 | 40 - 60 | 60 - 80 | 80 - 100 | 100 - 120 |
| Frequency | $$5$$ | $$f_{1}$$ | $$10$$ | $$f_{2}$$ | $$7$$ | $$8$$ |
If the mean for the following distribution by using deviation method
| $$\displaystyle x_{i}$$ | 15 | 20 | 22 | 24 | 25 | 30 | 33 | 38 |
| Frequency | 5 | 8 | 11 | 20 | 23 | 18 | 13 | 2 |
Find the mean marks from the following data(nearest integer)
| Marks | No. of Students |
| Below 10 | 5 |
| Below 20 | 9 |
| Below 30 | 17 |
| Below 40 | 29 |
| Below 50 | 45 |
| Below 60 | 60 |
| Below 70 | 70 |
| Below 80 | 78 |
| Below 90 | 83 |
| Below 100 | 85 |
Find the mean of the following frequency distribution
| Height from mean sea level | 200 | 600 | 1000 | 1400 | 1800 |
| No. of Villages | 115 | 107 | 265 | 143 | 202 |
Find the mean wage of the following distributions
| Category | A | B | C | D | E | F | G |
| Wages per day | 50 | 60 | 70 | 80 | 90 | 100 | 110 |
| No. of Workers | 2 | 4 | 8 | 12 | 10 | 6 | 8 |
Find out the mean profits from the following frequency distribution
| Profit per shop (in Rs) | Number of shops $$\displaystyle (f_{i})$$ |
| 100 - 200 | 10 |
| 200 - 300 | 18 |
| 300 - 400 | 20 |
| 400 - 500 | 26 |
| 500 - 600 | 30 |
| 600 - 700 | 28 |
| 700 - 800 | 18 |
The Arithmetic Mean of the following frequency distribution is $$47$$ Determined the value of $$p$$
| C.I. | $$0-20$$ | $$20-40$$ | $$40-60$$ | $$60-80$$ | $$80-100$$ |
| Frequency | $$8$$ | $$15$$ | $$20$$ | $$p$$ | $$3$$ |
Calculate the mean of the following distribution of marks obtained by 75 students in paper in an examination
| Marks | No. of students | Marks | No. of students |
| 0 - 10 | 2 | 50 - 60 | 12 |
| 10 - 20 | 3 | 60 - 70 | 14 |
| 20 - 30 | 4 | 70 - 80 | 4 |
| 30 - 40 | 8 | 80 - 90 | 4 |
| 49 - 50 | 16 | 90 - 100 | 3 |
The weekly observation on cost of living Index in a ccrtain city for the year 2000 - 2001 are given below Compute the mean weekly cost of living index
| Cost of Living Index | Number of weeks |
| 140 - 150 | 5 |
| 150 - 160 | 10 |
| 160 - 170 | 20 |
| 170 - 180 | 9 |
| 180 - 190 | 6 |
| 190 - 200 | 2 |
| Total | 52 |
Find the means of the following frequency distribution by direct method
| Class interval | Frequency |
| 0 - 20 | 8 |
| 20 - 40 | 10 |
| 40 - 60 | 15 |
| 60 - 80 | 9 |
| 80 - 100 | 8 |
Find the mean deviation about the mean for the data
| $$ \displaystyle X_{i} $$ | 10 | 30 | 50 | 70 | 90 |
| $$ \displaystyle f_{i} $$ | 4 | 24 | 28 | 16 | 8 |
Find the mean deviation about the mean for the data:
| Income per day | Numbers of persons |
| 0-100 | 4 |
| 100-200 | 8 |
| 200-300 | 9 |
| 300-400 | 10 |
| 400-500 | 7 |
| 500-600 | 5 |
| 600-700 | 4 |
| 700-800 | 3 |
Find the mean deviation about the mean for the data.
| $$ \displaystyle x_{i} $$ | 5 | 10 | 15 | 20 | 25 |
| $$ \displaystyle f_{i} $$ | 7 | 4 | 6 | 3 | 5 |
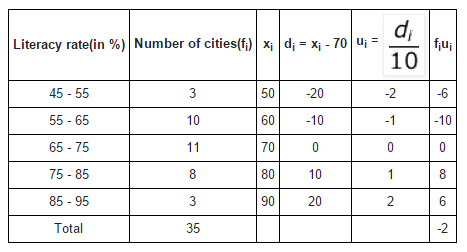
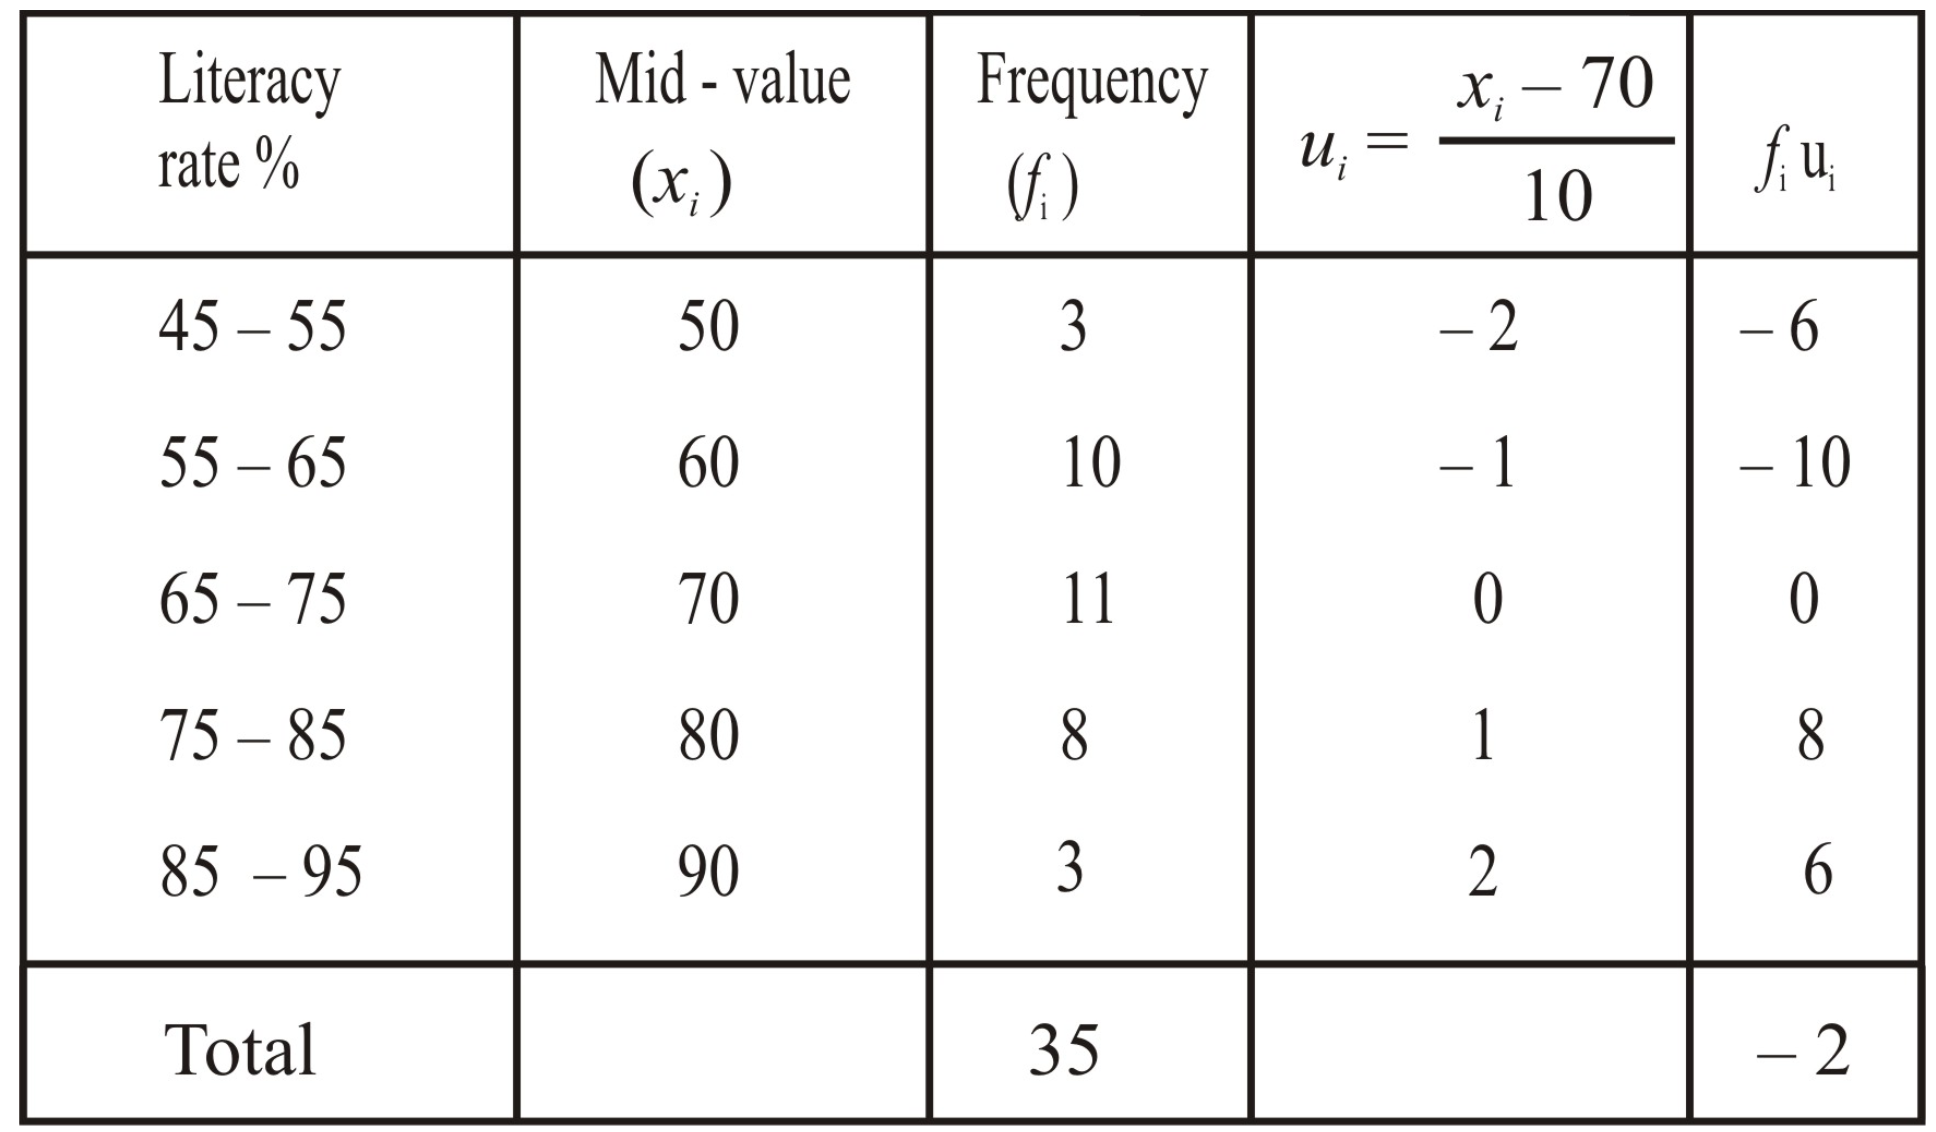
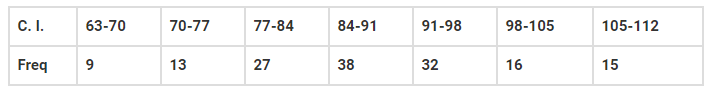
The following table gives the literacy rate (in percentage) of 35 cities. Find the mean literacy rate.
$$\left( { x }_{ i } \right) =\displaystyle\frac { Upper class limit + Lower class limit }{ 2 } $$
Class size $$\left( h \right) $$ for this data $$=10$$
Taking 70 as assumed mean $$\left( a \right) $$, calculating $${ d }_{ i },{ u }_{ i },{ f }_{ i }{ u }_{ i }$$:
From the table:
$$\sum { { f }_{ i } } =35$$
$$\sum { { f }_{ i }{ u }_{ i } } =-2$$
Mean, $$\bar { x } =a+\left( \displaystyle\frac { \sum { { f }_{ i }{ u }_{ i } } }{ \sum { { f }_{ i } } } \right) \times h$$
$$=70+\left( \displaystyle\frac { -2 }{ 35 } \right) \times 10$$
$$=70-\displaystyle\frac { 20 }{ 35 } $$
$$=70-\displaystyle\frac { 4 }{ 7 } $$
$$=70-0.57$$
$$=69.43$$
Therefore, mean literacy rate is $$69.43$$%
The mean and variance of $$7$$ observation are $$8$$ and $$16$$ respectively. If five of the observation are $$2,4, 10, 12$$ and $$14$$. Find the remaining two observations.
Find the mean deviation about the mean for the data
| Height of cms | Number of boys |
| 95-105 | 9 |
| 105-115 | 13 |
| 115-125 | 26 |
| 125-135 | 30 |
| 135-145 | 12 |
| 145-155 | 10 |
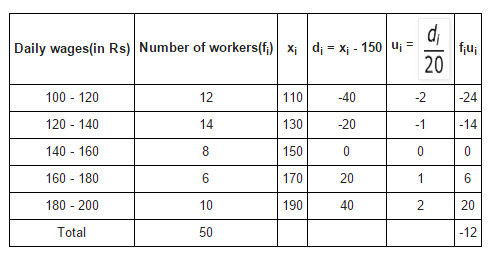
Consider the above distribution of daily wages of $$50$$ worker of a factory.
Find the mean daily wages.
An analysis of monthly wages paid to workers in two firms $$A$$ and $$B$$ belonging to the same industry gives the following results :
| Firm A | Firm B | |
| No.of wage earners | 586 | 648 |
| Mean of monthly wages | Rs 5253 | Rs 5253 |
| Variance of the distribution of wages | 100 | 121 |
(ii) Which firm $$A$$ or $$B$$ shows greater variability in individual wages ?
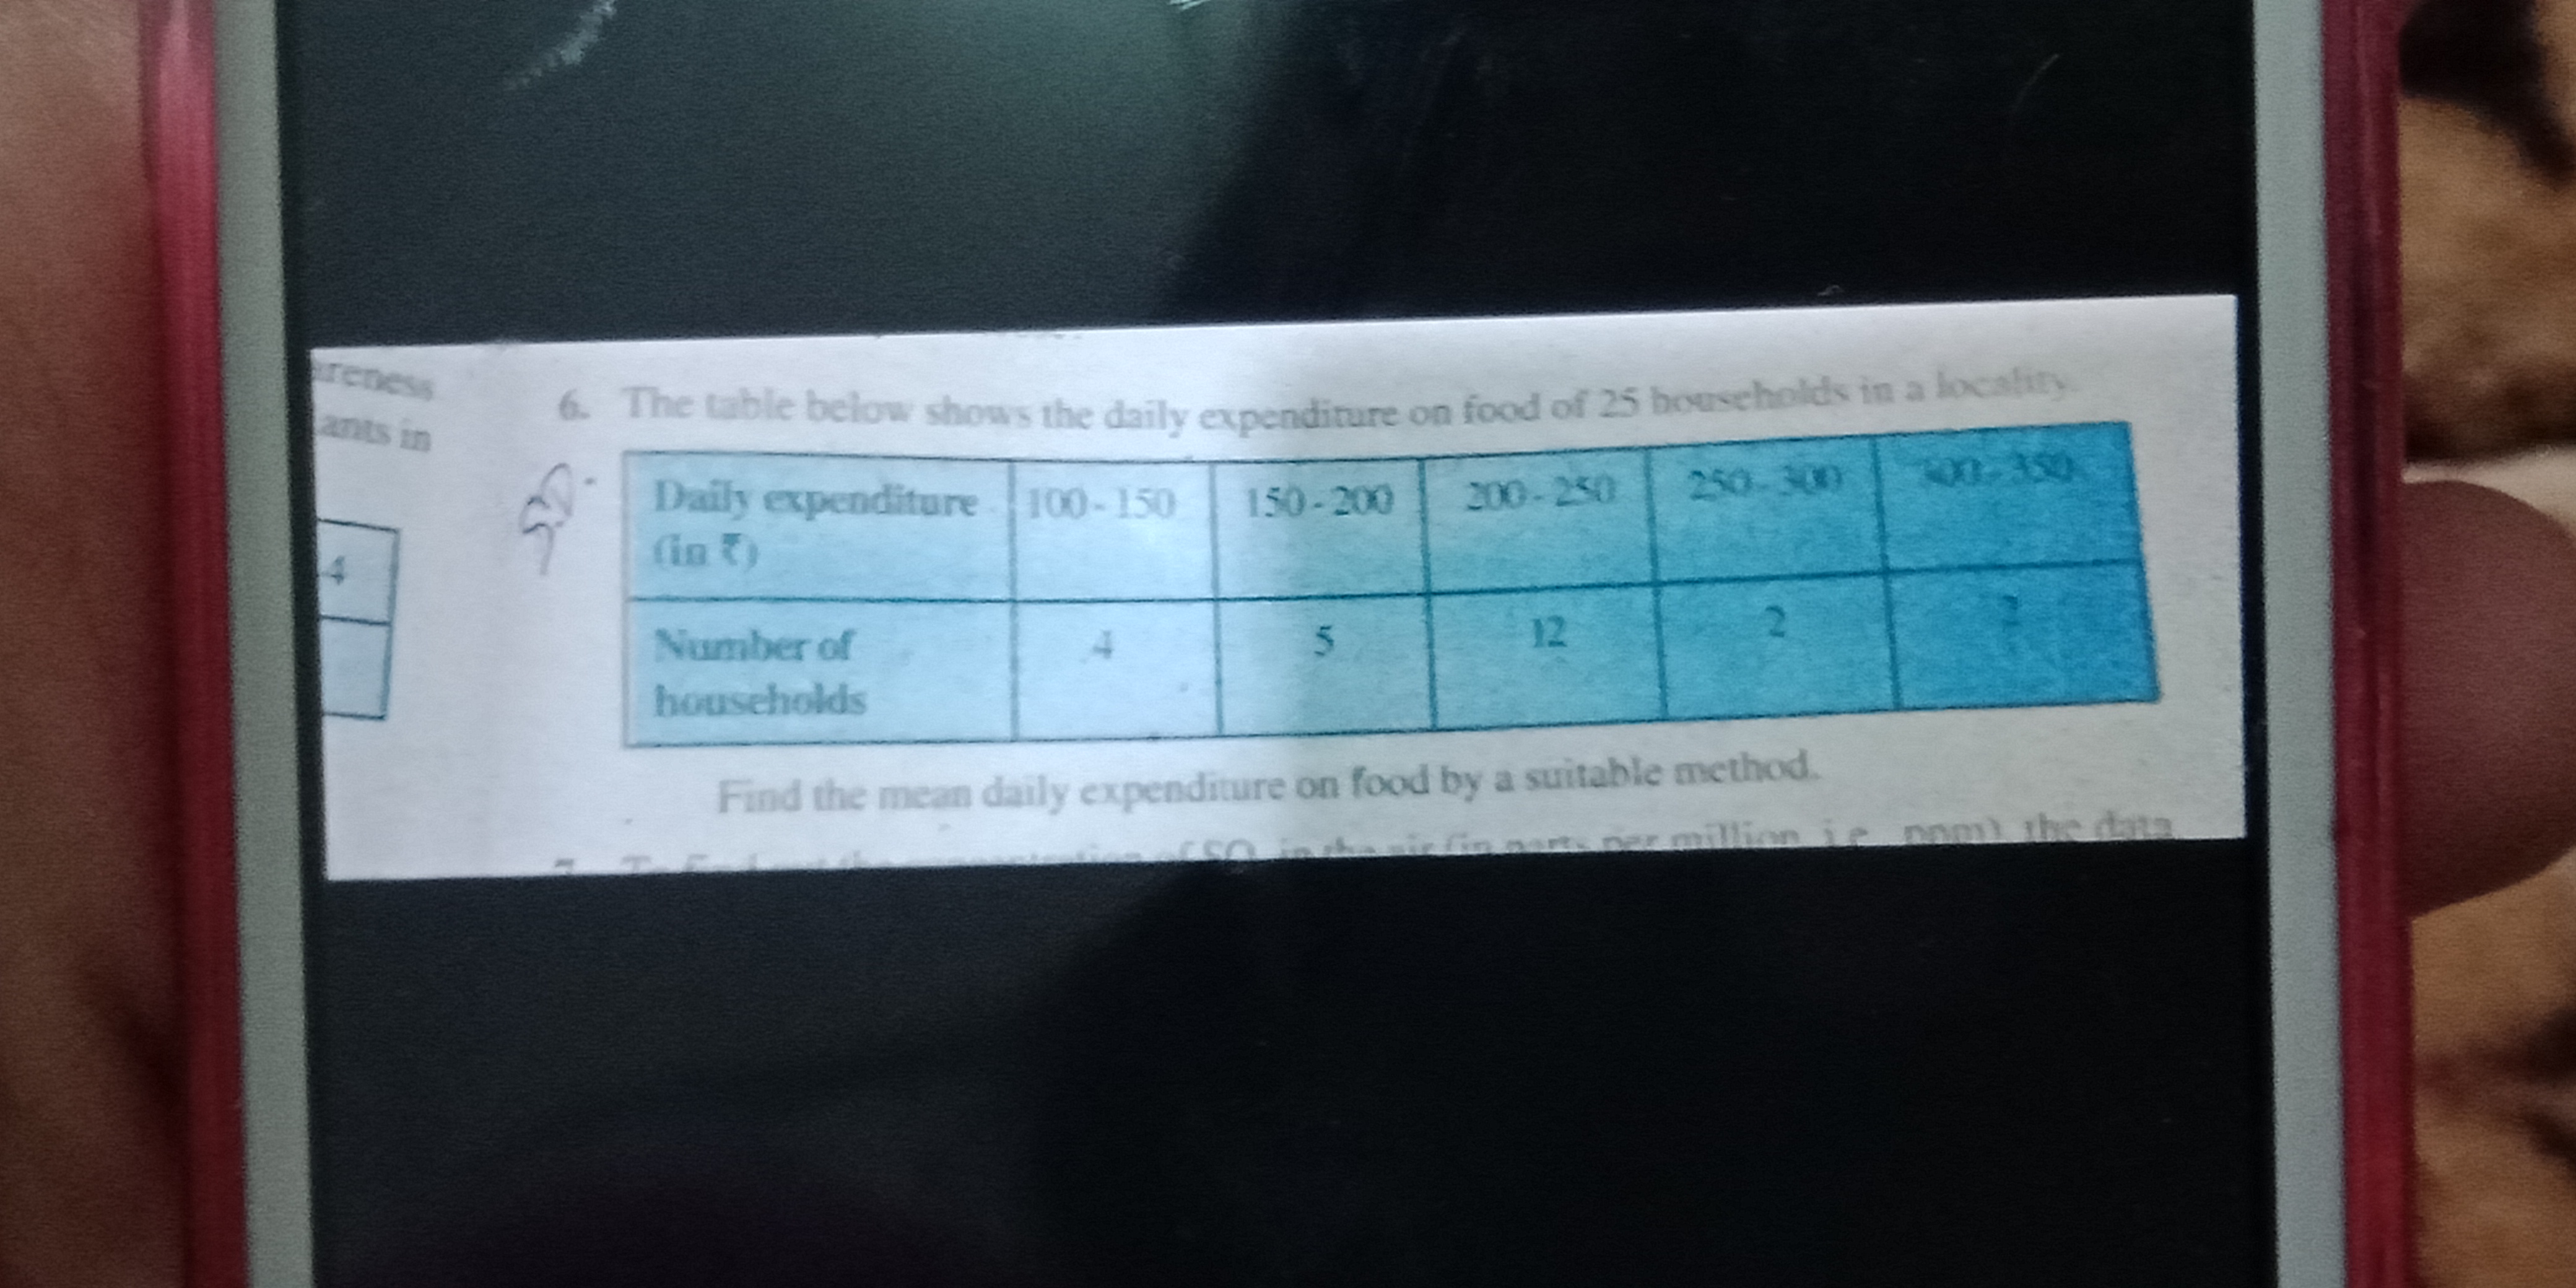
The table below shows the daily expenditure on food of $$25$$ households in a locality.
Find the mean daily expenditure on food by a suitable method.
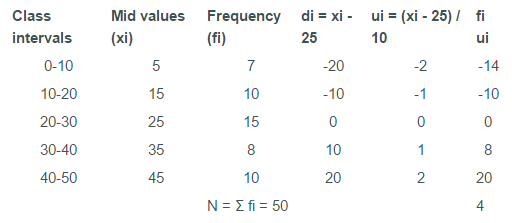
Using Step-Deviatopn Method, find the mean (rounded off to nearest integer) of following frequency distribution:
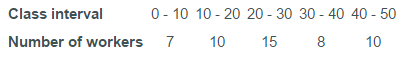
$$\bar { x } =A+h\left[ \displaystyle\frac { 1 }{ N } \sum { fi ui } \right] $$
$$\Rightarrow$$ Mean $$= 25 + 10 \times \left({4}/{50}\right)$$
$$\Rightarrow$$ Mean $$= 25 + 0.8$$
$$\therefore$$ Mean $$= 25.8$$
To find out the concentration of $$S{O}_{2}$$ in the air (in parts per million, i.e., ppm), the data was collected for 30 localities in a certain city and is presented below:

$$\Rightarrow { x }_{ i } =\displaystyle\dfrac { Upper\ class\ limit + Lower\ class\ limit }{ 2 } $$

In a mathematics test given to $$15$$ students, the following marks (out of $$100$$) are recorded:
$$41, 39, 48, 52, 46, 62, 54, 40, 96, 52, 98, 40, 42, 52, 60$$
Find the mean, median and mode of this data.
A survey was conducted by a group of students as a part of their environment awareness programme, in which they collected the following data regarding the number of plants in $$20$$ houses in a locality.Find the mean number of plants per house.
Number of plants
$$0-2$$
$$2-4$$
$$4-6$$
$$6-8$$
$$8-10$$
$$10-12$$
$$12-14$$
Number of houses
$$1$$
$$2$$
$$1$$
$$5$$
$$6$$
$$2$$
$$3$$
Which method did you use for finding the mean, and why?
What is the measures of central tendency for the data set $$5, 5, 10, 10, 5, 20, 25$$?
Consider the following distribution of daily wages of $$50$$ workers of a factory.
Daily wages (in C)
$$100-120$$
$$120-140$$
$$140-160$$
$$160-180$$
$$180-200$$
Number of workers
$$12$$
$$14$$
$$8$$
$$6$$
$$10$$
Find the mean daily wages of the workers of the factory by using an appropriate method.
| Daily wages (in C) | $$100-120$$ | $$120-140$$ | $$140-160$$ | $$160-180$$ | $$180-200$$ |
| Number of workers | $$12$$ | $$14$$ | $$8$$ | $$6$$ | $$10$$ |
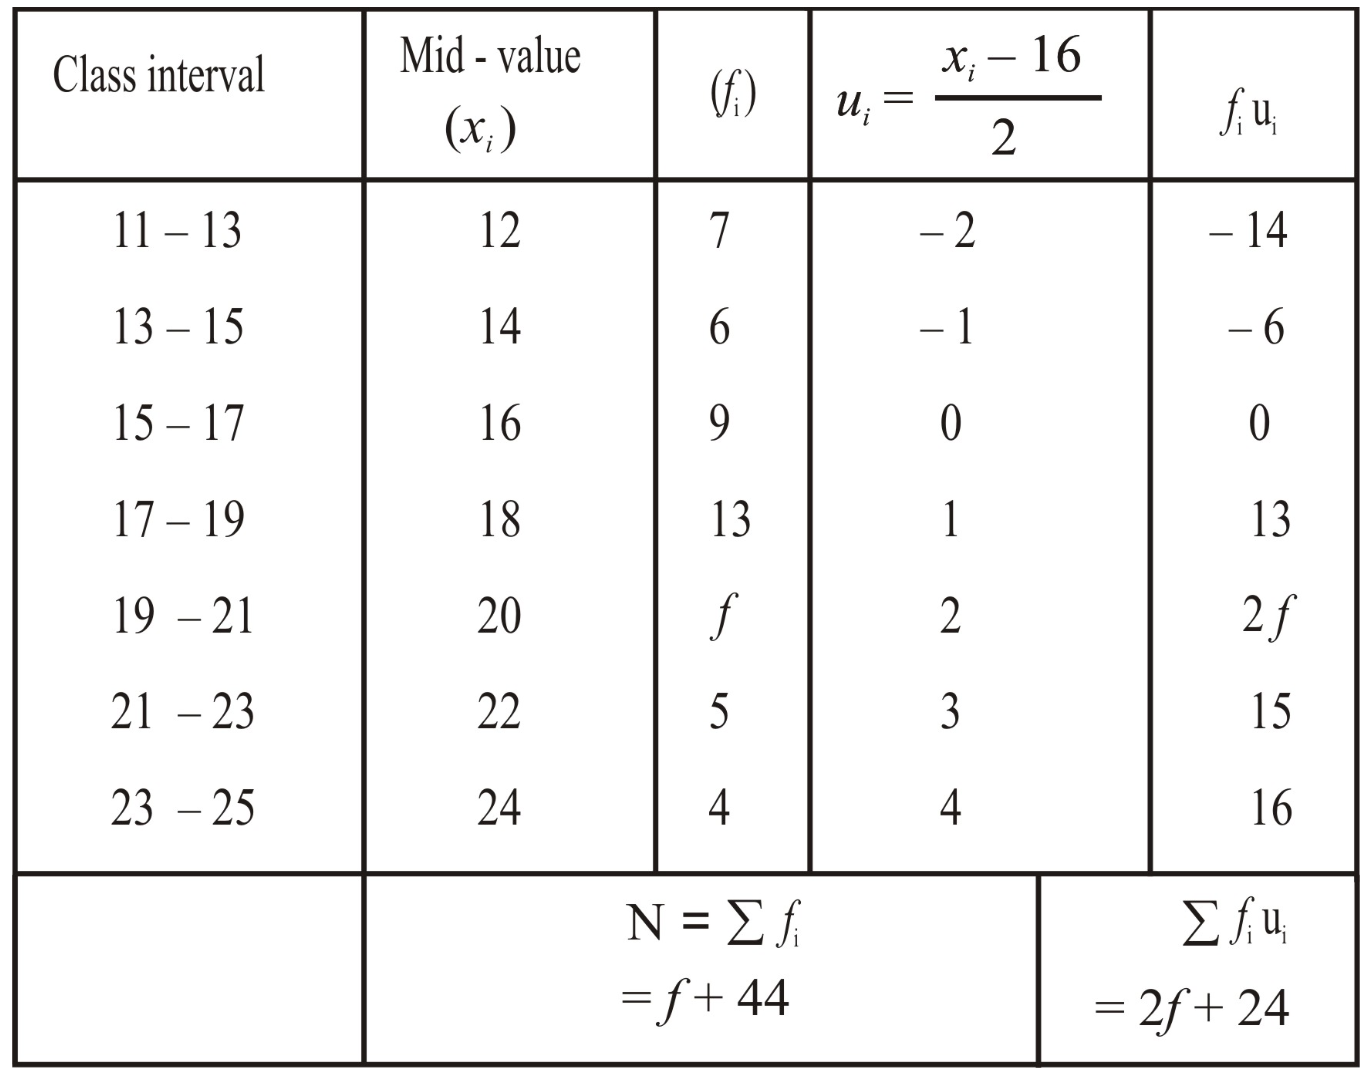
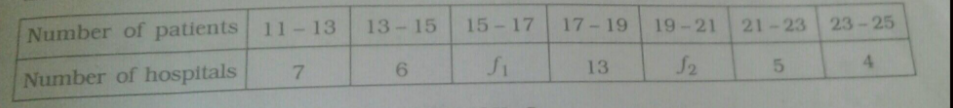
The following distribution shows the daily pocket allowance of children of a locality. The mean pocket allowance is $$Rs.\ 18$$. Find the missing frequency $$f$$.
| Daily pocket allowance (in $$Rs.$$) | $$11-13$$ | $$13-15$$ | $$15-17$$ | $$17-19$$ | $$19-21$$ | $$21-23$$ | $$23-25$$ |
| Number of children | $$7$$ | $$6$$ | $$9$$ | $$13$$ | $$f$$ | $$5$$ | $$4$$ |
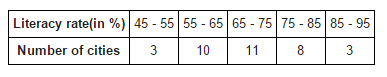
The following table gives the literacy rate (in percentage) of $$35$$ cities. Find the mean literacy rate.
| Literacy rate (in %) | 45-55 | 55-65 | 65-75 | 75-85 | 85-95 |
| Number of cities | 3 | 10 | 11 | 8 | 3 |
To find out the concentration of $$SO_2$$ in the air (in parts per million, i.e., ppm), the data was collected for $$30$$ localities in a certain city and is presented below:
| Concentration of $$SO_2$$ (in ppm) | Frequency |
| $$0.00-0.04$$ | $$4$$ |
| $$0.04-0.08$$ | $$9$$ |
| $$0.08-0.12$$ | $$9$$ |
| $$0.12-0.16$$ | $$2$$ |
| $$0.16-0.20$$ | $$4$$ |
| $$0.20-0.24$$ | $$2$$ |
In a retail market, fruit vendors were selling mangoes kept in packing boxes. These boxes contained varying number of mangoes. The following was the distribution of mangoes according to the number of boxes.
| Number of mangoes | $$50-5$$2 | $$53-5$$5 | 56-58 | $$59-6$$1 | $$62-64$$ |
| Number of boxes | $$15$$ | $$110$$ | $$135$$ | $$115$$ | $$25$$ |
Thirty women were examined in a hospital by a doctor and the number of heart beats per minute were recorded and summarised as follows. Find the mean heart beats per minute for these women, choosing a suitable method.
| Number of heart beats per minute | $$65-68$$ | $$68-71$$ | $$71-74$$ | $$74-77$$ | $$77-8$$0 | $$80-83$$ | $$83-86$$ |
| Number of women | $$2$$ | $$4$$ | $$3$$ | $$8$$ | $$7$$ | $$4$$ | $$2$$ |
The table below shows the daily expenditure on food of $$25$$ households in a locality.
| Daily expenditure (in C) | $$100-150$$ | $$150-200$$ | $$200-250$$ | $$250-300$$ | $$300-350$$ |
| Number of households | $$4$$ | $$5$$ | $$12$$ | $$2$$ | $$2$$ |
Calculate the mean for the following frequency distribution:
| Marks | $$10-20$$ | $$20-30$$ | $$30-40$$ | $$40-50$$ | $$50-60$$ | $$60-70$$ | $$70-80$$ |
| Frequency | $$3$$ | $$7$$ | $$10$$ | $$6$$ | $$8$$ | $$2$$ | $$4$$ |
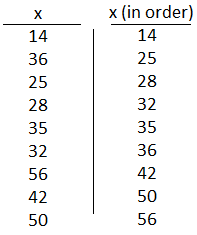
Find the median of $$9$$ observations $$14, 36, 25, 28, 35, 32, 56, 42, 50$$
The blood group of $$50$$ donors, participated in blood donation camp are $$A, AB, B, A, O, AB, O, O, A, AB, B, A, O, AB, O, O, A, B, A, O, AB, O, O, A, AB,$$ $$B, O, AB, O, B, A, O, AB, O, O, A, AB, B, A, O, AB, O, A, AB, B, A, O, AB, O, O$$. Find the mode of the above verbal data:
Calculate the mean for the following frequency distribution:
| Marks | $$15-19$$ | $$20-24$$ | $$25-29$$ | $$30-34$$ | $$35-39$$ | $$40-44$$ |
| Frequency | $$6$$ | $$5$$ | $$9$$ | $$12$$ | $$6$$ | $$2$$ |
Find the mean weight from the following table.
| Weight ($$kg$$) | $$29$$ | $$30$$ | $$31$$ | $$32$$ | $$33$$ |
| No. of children | $$02$$ | $$01$$ | $$04$$ | $$03$$ | $$05$$ |
Find the median of the data: $$22, 28, 34, 49, 44, 57, 18, 10, 33, 41, 66, 59$$
Find the mode of $$10, 12, 11, 10, 15, 20, 19, 21, 11, 9, 10$$
There are four unknown numbers. The mean of the first two numbers is $$4$$ and the mean of the first three is $$9$$. The mean of all four number is $$15$$, if one of the four number is $$2$$ find the other numbers
Calculate the mean of the following distribution:
| Class Interval | $$0-10$$ | $$10-20$$ | $$20-30$$ | $$30-40$$ | $$40-50$$ | $$50-60$$ |
| Frequency | $$8$$ | $$5$$ | $$12$$ | $$35$$ | $$24$$ | $$16$$ |
The sum of deviations of $$n$$ observations from $$25$$ is $$25$$ and sum of deviations of the same $$n$$ observations from $$35$$ is $$ -25$$. Find the mean of the observations
The histogram below represents the scores obtained by $$25$$ students in a Mathematics mental test. Use the data to to calculate mean of the distribution.

Find the median of the data; $$3.3, 3.5, 3.1, 3.7, 3.2, 3.8$$
Find the mean of the following distribution by step deviation method.
| Class Interval | $$20-30$$ | $$30-40$$ | $$40-50$$ | $$50-60$$ | $$60-70$$ | $$70-80$$ |
| Frequency | $$10$$ | $$6$$ | $$8$$ | $$12$$ | $$5$$ | $$9$$ |
Below is the given frequency distribution of words in an essay:
| Number of Words | Number of Candidates |
| $$600 - 800$$ | $$14$$ |
| $$800 - 1000$$ | $$22$$ |
| $$1000 - 1200$$ | $$30$$ |
| $$1200 - 1400$$ | $$18$$ |
| $$1400 - 1600$$ | $$16$$ |
Per day expenses of 25 families of the frequency distribution of a Dhani of a village is given as follows.
| Per day expense (In Rs.) | 25-35 | 35-45 | 45-55 | 55-65 | 65-75 |
| Number of families | 3 | 7 | 6 | 6 | 3 |
Find the mean for the following distribution table, using Deviation method.
| Class Interval | $$0 - 9$$ | $$10 - 19$$ | $$20 - 29$$ | $$30 - 39$$ | $$40 - 49$$ | $$50 - 50$$ | $$60 - 60$$ |
| Frequency | $$8$$ | $$10$$ | $$22$$ | $$26$$ | $$18$$ | $$9$$ | $$7$$ |
Calculate the Arthimetic mean of the following data.
| x | $$15$$ | $$25$$ | $$35$$ | $$45$$ | $$55$$ | $$65$$ | $$75$$ | $$85$$ |
| f | $$12$$ | $$20$$ | $$15$$ | $$14$$ | $$16$$ | $$11$$ | $$7$$ | $$8$$ |
The measurements (in $$mm$$) of the diameters of the head of the screws are given below:
| Diameter (in $$mm$$) | No. of Screws |
| $$30 - 35$$ | $$9$$ |
| $$36 - 38$$ | $$21$$ |
| $$39 - 41$$ | $$30$$ |
| $$42 - 44$$ | $$20$$ |
| $$45 - 47$$ | $$18$$ |
From the given information prepare the frequency table showing the value of $$x_i f_i$$.
| IQ $$(x_i)$$ | No. of students $$(f_i)$$ |
| $$70-80$$ | $$7$$ |
| $$80-90$$ | $$16$$ |
| $$90-100$$ | $$20$$ |
| $$100-110$$ | $$17$$ |
The marks distribution of $$30$$ students in a mathematics examination are as follows:
Class-interval of marks $$10 - 25$$ $$25 - 40$$ $$40 - 55$$ $$55 - 70$$ $$70 - 85$$ $$85 - 100$$ Number of students $$2$$ $$3$$ $$7$$ $$6$$ $$6$$ $$6$$
Find the mean by direct method and find also the mode of given data.
| Class-interval of marks | $$10 - 25$$ | $$25 - 40$$ | $$40 - 55$$ | $$55 - 70$$ | $$70 - 85$$ | $$85 - 100$$ |
| Number of students | $$2$$ | $$3$$ | $$7$$ | $$6$$ | $$6$$ | $$6$$ |
The following is the frequency distribution of time (in minutes) a worker takes to complete the work. Find mean time taken by a worker to complete the work by using 'Assumed Mean Method'.
| Time (in minutes) | No. of Workers |
| $$20 - 24$$ | $$2$$ |
| $$25 - 29$$ | $$10$$ |
| $$30 - 34$$ | $$15$$ |
| $$35 - 39$$ | $$20$$ |
| $$40 - 44$$ | $$28$$ |
| $$45 - 49$$ | $$25$$ |
Below is given the distribution of money (in Rs.) collected by students for flood, relief fund
| Money (in Rs) | $$0-10$$ | $$10-20$$ | $$20-30$$ | $$30-40$$$$ | 40-50$$ |
| No. of Students | $$5$$ | $$7$$ | $$5$$ | $$2$$ | $$6$$ |
Find the weighted A.M. of the price for the following data.
| Food stuff | Quantity(in kg) $$w_i$$ | Price per kg (in Rs.) $$x_i$$ |
| Rice | $$25$$ | $$30$$ |
| Sugar | $$12$$ | $$30$$ |
| Oil | $$8$$ | $$70$$ |
For a month, a family requires the commodities listed in the table below. The weights to each commodity is given. Find the Weighted Arithmetic Mean.
| Commodity | Weight (in kg) | Price per kg(in Rupees) |
| Rice | $$25$$ | $$30$$ |
| Wheat | $$5$$ | $$20$$ |
| Pulses | $$4$$ | $$60$$ |
| Vegetables | $$8$$ | $$25$$ |
| Oil | $$3$$ | $$65$$ |
The following table shows the weights of $$12$$ workers in a factory. Find the mean weight of the workers.
| Weight (in kg) | $$60$$ | $$64$$ | $$68$$ | $$70$$ | $$72$$ |
| Number of workers | $$3$$ | $$4$$ | $$2$$ | $$2$$ | $$1$$ |
Calculate the Arithmetic mean of the following data by direct method.
| x | $$5$$ | $$10$$ | $$15$$ | $$20$$ | $$25$$ | $$30$$ |
| f | $$4$$ | $$5$$ | $$7$$ | $$4$$ | $$3$$ | $$2$$ |
Obtain the A.M of the following data.
| Marks | $$65$$ | $$70$$ | $$75$$ | $$80$$ | $$85$$ | $$90$$ | $$95$$ | $$100$$ |
| Number of students | $$6$$ | $$11$$ | $$3$$ | $$5$$ | $$4$$ | $$7$$ | $$10$$ | $$4$$ |
Find the Weighted Arithmetic Mean for the following data.
| Item | Number of Item | Cost of Item |
| Powder | $$2$$ | Rs. $$45$$ |
| Soap | $$4$$ | Rs. $$12$$ |
| Pen | $$5$$ | Rs. $$15$$ |
| Instruments box | $$4$$ | Rs. $$25.50$$ |
The following data give the number of boys of a particular age in a class of $$40$$ students. Calculate the mean age of the students.
| Age(in years) | $$13$$ | $$14$$ | $$15$$ | $$16$$ | $$17$$ | $$18$$ |
| Number of students | $$3$$ | $$8$$ | $$9$$ | $$11$$ | $$6$$ | $$3$$ |
Find the median of $$17, 15, 9, 13, 21, 7, 32$$.
A cricket player has taken the runs $$13, 28, 61, 70, 4, 11, 33, 0, 71, 92$$. Find the median.
Find the median of the following set of values.
1) $$83, 66, 86, 30, 82$$
2) $$45, 49, 46, 44, 38, 37, 55, 51$$
3) $$70, 71, 70, 68, 67, 69, 70$$
4) $$51, 55, 46, 47, 53, 55, 51, 46$$.
In a study on patients, the following data were obtained. Find the arithmetic mean.
| Age (in yrs) | $$10-19$$ | $$20-29$$ | $$30-39$$ | $$40-49$$ | $$50-59$$ |
| No. of patients | $$1$$ | $$0$$ | $$1$$ | $$10$$ | $$13$$ |
Find the mode of $$2, 4, 5, 2, 1, 2, 3, 4, 4, 6, 2$$.
The marks of ten students in a mathematics talent examinations are $$75, 72, 59, 62, 72, 75, 71, 70, 70, 70$$. Obtain the mode.
Find the mode of $$15, 25, 35, 45, 55, 65$$.
Compute the arithmetic mean of the following distribution.
| Class Interval | $$0-19$$ | $$20-39$$ | $$40-59$$ | $$60-79$$ | $$80-99$$ |
| Frequency | $$3$$ | $$4$$ | $$15$$ | $$14$$ | $$4$$ |
Find the median of the following numbers
(i) $$24, 22, 23, 14, 15, 7, 21$$
(ii) $$17, 15, 9, 13, 21, 32, 42, 7, 12, 10$$.
The mean of the following frequency distribution is $$350$$, find the missing frequency
| Class | $$100-200$$ | $$200-300$$ | $$300-400$$ | $$400-500$$ | $$500-600$$ | $$600-700$$ |
| Frequency | $$5$$ | $$3$$ | $$3$$ | - | $$2$$ | $$1$$ |
The table below shows the classification of students who participated in a camp, according to their height.
| Height (cm) | Number of Students |
| 130 - 135 | 8 |
| 135 - 140 | 12 |
| 140 - 145 | 20 |
| 145 - 150 | 28 |
| 150 - 155 | 32 |
| 155 - 160 | 22 |
| 160 - 165 | 16 |
| 165 - 170 | 12 |
Find the median of the following values of a variable:
$$5,10,3,7,2,9,6,2,11$$
The marks obtained by $$15$$ students of a class are given below. Find the modal marks.
$$42, 45, 47, 49, 52, 65, 65, 71, 71, 72, 75, 82, 72, 47, 72$$
Find the mode for the set of values $$482, 485, 483, 485, 487, 487, 489$$.
The monthly income (in rupees) of $$7$$ households in a village are $$1200, 1500, 1400, 1000,1000, 1600, 10000$$.
(i) Find the median income of the house holds.
(ii) If one more household with monthly income of $$1500$$ is added, what will the median income be?
The following distribution shows the daily pocket allowance of children of a locality
| Daily pocket allowance (in Rs.) | 10-20 | 20-30 | 30-40 | 40-50 | 50-60 |
| Number of Children | $$3$$ | $$5$$ | $$4$$ | $$7$$ | $$6$$ |
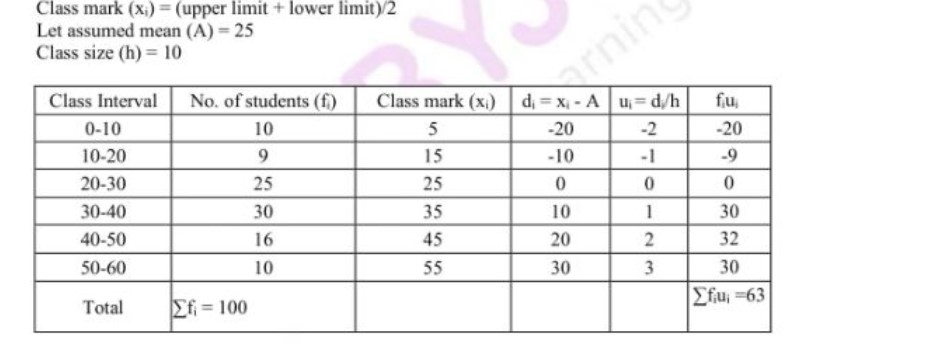
Calculate the mean of the following distribution using step deviation method.
| Marks | $$0-10$$ | $$10-20$$ | $$20-30$$ | $$30-40$$ | $$40-50$$ | $$50-60$$ |
| Number of Students | $$10$$ | $$9$$ | $$25$$ | $$30$$ | $$16$$ | $$10$$ |
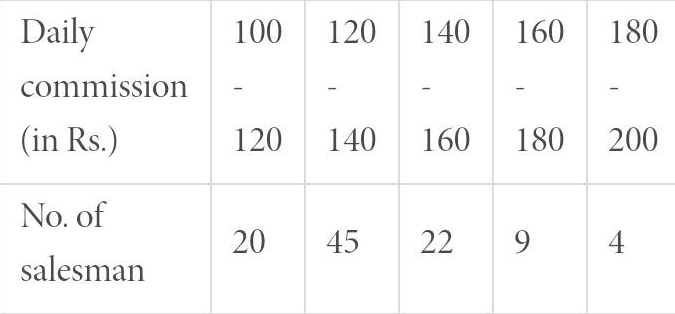
Frequency distribution of daily commission received by $$100$$ salesmen is given.
| Daily Commission(in Rs.) | No. of Salesmen |
| $$100-120$$ | $$20$$ |
| $$120-140$$ | $$45$$ |
| $$140-160$$ | $$22$$ |
| $$160-180$$ | $$09$$ |
| $$180-200$$ | $$04$$ |
Find the mean of the following frequency distribution by a suitable method.
| C.I. | 50-70 | 70-90 | 90-110 | 110-130 | 130-150 | 150-170 |
| Frequency | 8 | 12 | 13 | 27 | 18 | 22 |
Find the value of $$n$$, if the median of the numbers $$n + 3, n + 7, ....n + 31, n + 35$$ is $$30$$.
For the following frequency table, Find the number of telephone calls received at an exchange per interval for $$250$$ successive one-minute intervals.
No. of calls ($$x$$) $$0$$ $$1$$ $$2$$ $$3$$ $$4$$ $$5$$ $$6$$ No. of intervals ($$f$$) $$15$$ $$24$$ $$29$$ $$46$$ $$54$$ $$43$$ $$39$$
| No. of calls ($$x$$) | $$0$$ | $$1$$ | $$2$$ | $$3$$ | $$4$$ | $$5$$ | $$6$$ |
| No. of intervals ($$f$$) | $$15$$ | $$24$$ | $$29$$ | $$46$$ | $$54$$ | $$43$$ | $$39$$ |
The following table gives the number of boys of a particular age in a class of $$40$$ students. Calculate the mean age of the students.
| Age (in years) | $$15$$ | $$16$$ | $$17$$ | $$18$$ | $$19$$ | $$20$$ |
| No. of students | $$3$$ | $$8$$ | $$10$$ | $$10$$ | $$5$$ | $$4$$ |
Five coins were simultaneously tossed $$1000$$ times and at each toss the number of heads were observed. The number of tosses during which $$0,1,2,3,4$$ and $$5$$ heads were obtained. They are shown in the table below. Find the mean number of heads per toss.
| No. of heads per toss | No. of tosses |
| $$0$$ | $$38$$ |
| $$1$$ | $$144$$ |
| $$2$$ | $$342$$ |
| $$3$$ | $$287$$ |
| $$4$$ | $$164$$ |
| $$5$$ | $$25$$ |
| Total | $$1000$$ |
The following table gives the number of branches and number of plants in the garden of a school.
| No. of branches ($$x$$): | $$2$$ | $$3$$ | $$4$$ | $$5$$ | $$6$$ |
| No. of plants ($$f$$): | $$49$$ | $$43$$ | $$57$$ | $$38$$ | $$13$$ |
The marks obtained out of $$50$$, by $$102$$ students in a Physics test are given in the frequency table below:
| Marks ($$x$$) | $$15$$ | $$20$$ | $$22$$ | $$24$$ | $$25$$ | $$30$$ | $$33$$ | $$28$$ | $$45$$ |
| Frequency ($$f$$) | $$5$$ | $$8$$ | $$11$$ | $$20$$ | $$23$$ | $$18$$ | $$13$$ | $$3$$ | $$1$$ |
Find the value of $$p$$ for the following distribution whose mean is $$16.6$$.
| $$x$$: | $$8$$ | $$12$$ | $$15$$ | $$p$$ | $$20$$ | $$25$$ | $$30$$ |
| $$f$$: | $$12$$ | $$16$$ | $$20$$ | $$24$$ | $$16$$ | $$8$$ | $$4$$ |
Calculate the mean for the following distribution:
| $$x$$: | $$5$$ | $$6$$ | $$7$$ | $$8$$ | $$9$$ |
| $$f$$: | $$4$$ | $$8$$ | $$14$$ | $$11$$ | $$3$$ |
Find the mean of the following frequency distribution:
Class interval: 0-8 8-16 16-24 24-32 32-40 Frequency: $$6$$ $$7$$ $$10$$ $$8$$ $$9$$
| Class interval: | 0-8 | 8-16 | 16-24 | 24-32 | 32-40 |
| Frequency: | $$6$$ | $$7$$ | $$10$$ | $$8$$ | $$9$$ |
The following distribution gives the number of accidents met by 160 workers in a factory during a month.
| No. of accidents ($$x$$): | $$0$$ | $$1$$ | $$2$$ | $$3$$ | $$4$$ |
| No. of workers ($$f$$): | $$70$$ | $$52$$ | $$34$$ | $$3$$ | $$1$$ |
In the first proofreading of a book containing $$300$$ pages the following distribution of misprints was obtained:
| No. of misprints per page ($$x$$) | $$0$$ | $$1$$ | $$2$$ | $$3$$ | $$4$$ | $$5$$ |
| No. of pages ($$f$$) | $$154$$ | $$95$$ | $$36$$ | $$9$$ | $$5$$ | $$1$$ |
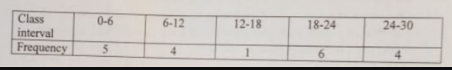
Find the mean of each of the following frequency distributions:
| Class interval: | 0-6 | 6-12 | 12-18 | 18-24 | 24-30 |
| Frequency: | $$6$$ | $$8$$ | $$10$$ | $$9$$ | $$7$$ |
Find the mean of the following frequency distribution:
Class interval: 25-35 35-45 45-55 55-65 65-75 Frequency: $$6$$ $$10$$ $$8$$ $$12$$ $$4$$
| Class interval: | 25-35 | 35-45 | 45-55 | 55-65 | 65-75 |
| Frequency: | $$6$$ | $$10$$ | $$8$$ | $$12$$ | $$4$$ |
Find the mean of the following frequency distribution:
Class interval: 0-8 8-16 16-24 24-32 32-40 Frequency: $$5$$ $$6$$ $$4$$ $$3$$ $$2$$
| Class interval: | 0-8 | 8-16 | 16-24 | 24-32 | 32-40 |
| Frequency: | $$5$$ | $$6$$ | $$4$$ | $$3$$ | $$2$$ |
Find the mean from the following frequency distribution of marks at a test in class.
| Maks ($$x$$): | $$5$$ | $$10$$ | $$15$$ | $$20$$ | $$25$$ | $$30$$ | $$35$$ | $$40$$ | $$45$$ | $$50$$ |
| No. of students ($$f$$) | $$15$$ | $$50$$ | $$80$$ | $$76$$ | $$472$$ | $$45$$ | $$39$$ | $$9$$ | $$8$$ | $$6$$ |
Find the mean of the following frequency distribution:
Class interval: 0-6 6-12 12-18 18-24 24-30 Frequency: $$7$$ $$5$$ $$10$$ $$12$$ $$6$$
| Class interval: | 0-6 | 6-12 | 12-18 | 18-24 | 24-30 |
| Frequency: | $$7$$ | $$5$$ | $$10$$ | $$12$$ | $$6$$ |
Find the mean of the following frequency distribution:
Class interval: 0-10 10-20 20-30 30-40 40-50 Frequency: $$9$$ $$12$$ $$15$$ $$10$$ $$14$$
| Class interval: | 0-10 | 10-20 | 20-30 | 30-40 | 40-50 |
| Frequency: | $$9$$ | $$12$$ | $$15$$ | $$10$$ | $$14$$ |
The number of students absent in a class were recorded for $$120$$ days and the information is given in the following frequency table:
| No. of students absent ($$x$$) | $$0$$ | $$1$$ | $$2$$ | $$3$$ | $$4$$ | $$5$$ | $$6$$ | $$7$$ |
| No. of days ($$f$$) | $$1$$ | $$4$$ | $$10$$ | $$50$$ | $$34$$ | $$15$$ | $$4$$ | $$2$$ |
Find the mean of the following frequency distribution:
Class interval: 10-30 30-50 50-70 70-90 90-110 110-130 Frequency: $$5$$ $$8$$ $$12$$ $$20$$ $$3$$ $$2$$
| Class interval: | 10-30 | 30-50 | 50-70 | 70-90 | 90-110 | 110-130 |
| Frequency: | $$5$$ | $$8$$ | $$12$$ | $$20$$ | $$3$$ | $$2$$ |
The following table shows the marks scored by $$140$$ students in an examination of a certain paper:
| Marks: | 0-10 | 10-20 | 20-30 | 30-40 | 40-50 |
| Number of students: | $$20$$ | $$24$$ | $$40$$ | $$36$$ | $$20$$ |
If the mean of the following distribution is $$27$$, find the value of $$p$$.
| Class: | 0-10 | 10-20 | 20-30 | 30-40 | 40-50 |
| Frequency: | $$8$$ | $$p$$ | $$12$$ | $$13$$ | $$10$$ |
Find the mean of the following frequency distribution:
Class interval: 25-29 30-34 35-39 40-44 45-49 50-54 55-59 Frequency: $$14$$ $$22$$ $$16$$ $$6$$ $$5$$ $$3$$ $$4$$
| Class interval: | 25-29 | 30-34 | 35-39 | 40-44 | 45-49 | 50-54 | 55-59 |
| Frequency: | $$14$$ | $$22$$ | $$16$$ | $$6$$ | $$5$$ | $$3$$ | $$4$$ |
The following distribution shows the daily pocket allowance given the children of a multistorey building. The average pocket allowance is Rs. $$18.00$$. Find out the missing frequency.
| Class interval: | 11-13 | 13-15 | 15-17 | 17-19 | 19-21 | 21-23 | 23-25 |
| Frequency: | $$7$$ | $$6$$ | $$9$$ | $$13$$ | --- | $$5$$ | $$4$$ |
The weekly observations on cost of living index in a certain city for the year 2004-2005 are given below. Compute the weekly cost of living index.
| Cost of living Index | Number of students | Cost of living Index | Number of students |
| 1400-1500 | $$5$$ | 1700-1800 | $$9$$ |
| 1500-1600 | $$10$$ | 1800-1900 | $$6$$ |
| 1600-1700 | $$20$$ | 1900-2000 | $$2$$ |
For the following distribution, calculate mean using all suitable methods:
| Size of item | 1-4 | 4-9 | 9-16 | 16-27 |
| Frequency | $$6$$ | $$12$$ | $$26$$ | $$20$$ |
The mean of the following frequency distribution is $$62.8$$ and the sum of all the frequencies is $$50$$. Compute the missing frequency $${f}_{1}$$ and $${f}_{2}$$.
| Class: | 0-20 | 20-40 | 40-60 | 60-80 | 80-100 | 100-120 |
| Frequency | $$5$$ | $${f}_{1}$$ | $$10$$ | $${f}_{2}$$ | $$7$$ | $$8$$ |
In a retail market, fruit vendors were selling mangoes kept in packing boxes. These boxes contained varying number of mangoes. The following was the distribution of mangoes according to the number of boxes.
| Number of mangoes | $$50-52$$ | $$53-55$$ | $$56-58$$ | $$59-61$$ | $$62-64$$ |
| Number of boxes | $$15$$ | $$110$$ | $$135$$ | $$115$$ | $$25$$ |
The table below gives the distribution of villages under different heights from sea level in a certain region. Compute the mean height of the region:
| Height (in meters): | 200 | 600 | 1000 | 1400 | 1800 | 2200 |
| No. of village: | 142 | 265 | 560 | 271 | 89 | 16 |
Apply step-deviation method to find the AM of the following frequency distribution
| Variate $$(x)$$: | $$5$$ | $$10$$ | $$15$$ | $$20$$ | $$25$$ | $$30$$ | $$35$$ | $$40$$ | $$45$$ | $$50$$ |
| Frequency $$(f)$$: | $$20$$ | $$43$$ | $$75$$ | $$67$$ | $$72$$ | $$45$$ | $$39$$ | $$9$$ | $$8$$ | $$6$$ |
A frequency distribution of the of life times 400 T.V. picture tubes tested in a tube company is given below. Find the average life of tube.
| Life time ( in hrs) | Frequency |
| 300-399 | 14 |
| 400-499 | 46 |
| 500-599 | 58 |
| 600-699 | 76 |
| 700-68 | 68 |
| 800-899 | 62 |
| 900-999 | 48 |
| 1000-1099 | 22 |
| 1100-1199 | 6 |
The lengths of $$40$$ leaves of a plant are measured correct to the nearest millimetre, and the data obtained is represented in the following table:
| Length (in mm) | 118-126 | 127-135 | 136-144 | 145-153 | 154-162 | 163-171 | 172-180 |
| No. of leaves: | $$3$$ | $$5$$ | $$9$$ | $$12$$ | $$5$$ | $$4$$ | $$2$$ |
Find the mean wage from the following data:
| Wage( in Rs.) | 800 | 820 | 860 | 900 | 920 | 980 | 1000 |
| No. of workers: | 7 | 14 | 19 | 25 | 20 | 10 | 5 |
The following table gives the distribution of total household expenditure ( in rupees) of manual workers in a city.
| Expenditure: (in Rs.) | 100-150 | 150-200 | 200-250 | 250-300 | 300-350 | 350-400 | 400-450 | 450-500 |
| Frequency: | 24 | 40 | 33 | 28 | 30 | 22 | 16 | 7 |
Find the mode of the following data:
(i) $$3,5,7,4,5,3,5,6,8,9,5,3,5,3,6,9,7,4$$
(ii) $$3,3,7,4,5,3,5,6,8,9,3,5,3,6,9,7,4$$
(iii) $$15,8,26,25,24,15,18,20,24,15,19,15$$
Find the mode of the following data:
$$25, 16, 19, 20, 34, 15, 19, 20, 21, 24, 19, 16, 22, 16, 18, 20, 16, 19$$
The information regarding $$35$$ villages of a district is given below obtain an appropriate measure of average.
| Population | Less then $$1000$$ | $$1001-2000$$ | $$2001-4000$$ | $$4001-8000$$ | $$8001-10000$$ | More than $$10,000$$ |
| Number of villages | $$3$$ | $$6$$ | $$10$$ | $$9$$ | $$3$$ | $$4$$ |
Find the mean of the following distribution using short-cut method:
| C.I | $$35-40$$ | $$40-45$$ | $$45-50$$ | $$50-55$$ | $$55-60$$ |
| F | $$7$$ | $$6$$ | $$9$$ | $$5$$ | $$3$$ |
Find the average of $$2,3,4,5,10,13$$
Find the mean marks of students from the following cumulative frequency distribution:
| Marks | Number of students |
| o and above | 80 |
| 10 and above | 77 |
| 20 and above | 72 |
| 30 and above | 65 |
| 40 and above | 55 |
| 50 and above | 43 |
| 60 and above | 28 |
| 70 and above | 16 |
| 80 and above | 10 |
| 90 and above | 8 |
| 100 and above | 0 |
Find the mean marks of the students from the following cumulative frequency distribution:
| Marks: | Below 10 | Below 20 | Below 30 | Below 40 | Below 50 | Below 60 | Below 70 | Below 80 | Below 90 | Below 100 |
| Number of students: | 5 | 9 | 17 | 29 | 45 | 60 | 70 | 78 | 83 | 85 |
The following data gives the distribution of total household expenditure (in rupees)of manual workers in a city:
| Expenditure (in Rs.) | Frequency | Expenditure (in Rs.) | Frequency |
| 1000-1500 | 24 | 3000-3500 | 30 |
| 1500-2000 | 40 | 3500-4000 | 22 |
| 2000-2500 | 33 | 4000-4500 | 16 |
| 2500-3000 | 28 | 4500-5000 | 7 |
Find the median of the following data.
$$14, 92, 62, 53, 42, 32, 22, 41, 83, 55$$.
Construct the frequency distribution table for the following data:
| Height(in cm) | less than 140 | less than 145 | less than 150 | less than 155 | less than 160 | less than 165 |
| No of girls | 4 | 11 | 29 | 40 | 46 | 51 |
The median of $$80, 60, 30x, 10, 5$$ is $$10$$ then $$x =$$?
The following frequency distribution gives the monthly consumption of electricity of $$68$$ consumers of a locality. Find the median, mean and mode of the data and compare them.
| Monthly consumption (in units) | Number of consumers |
| $$65-85$$ | $$4$$ |
| $$85-105$$ | $$5$$ |
| $$105-125$$ | $$13$$ |
| $$125-145$$ | $$20$$ |
| $$145-165$$ | $$14$$ |
| $$165-185$$ | $$8$$ |
| $$185-205$$ | $$4$$ |
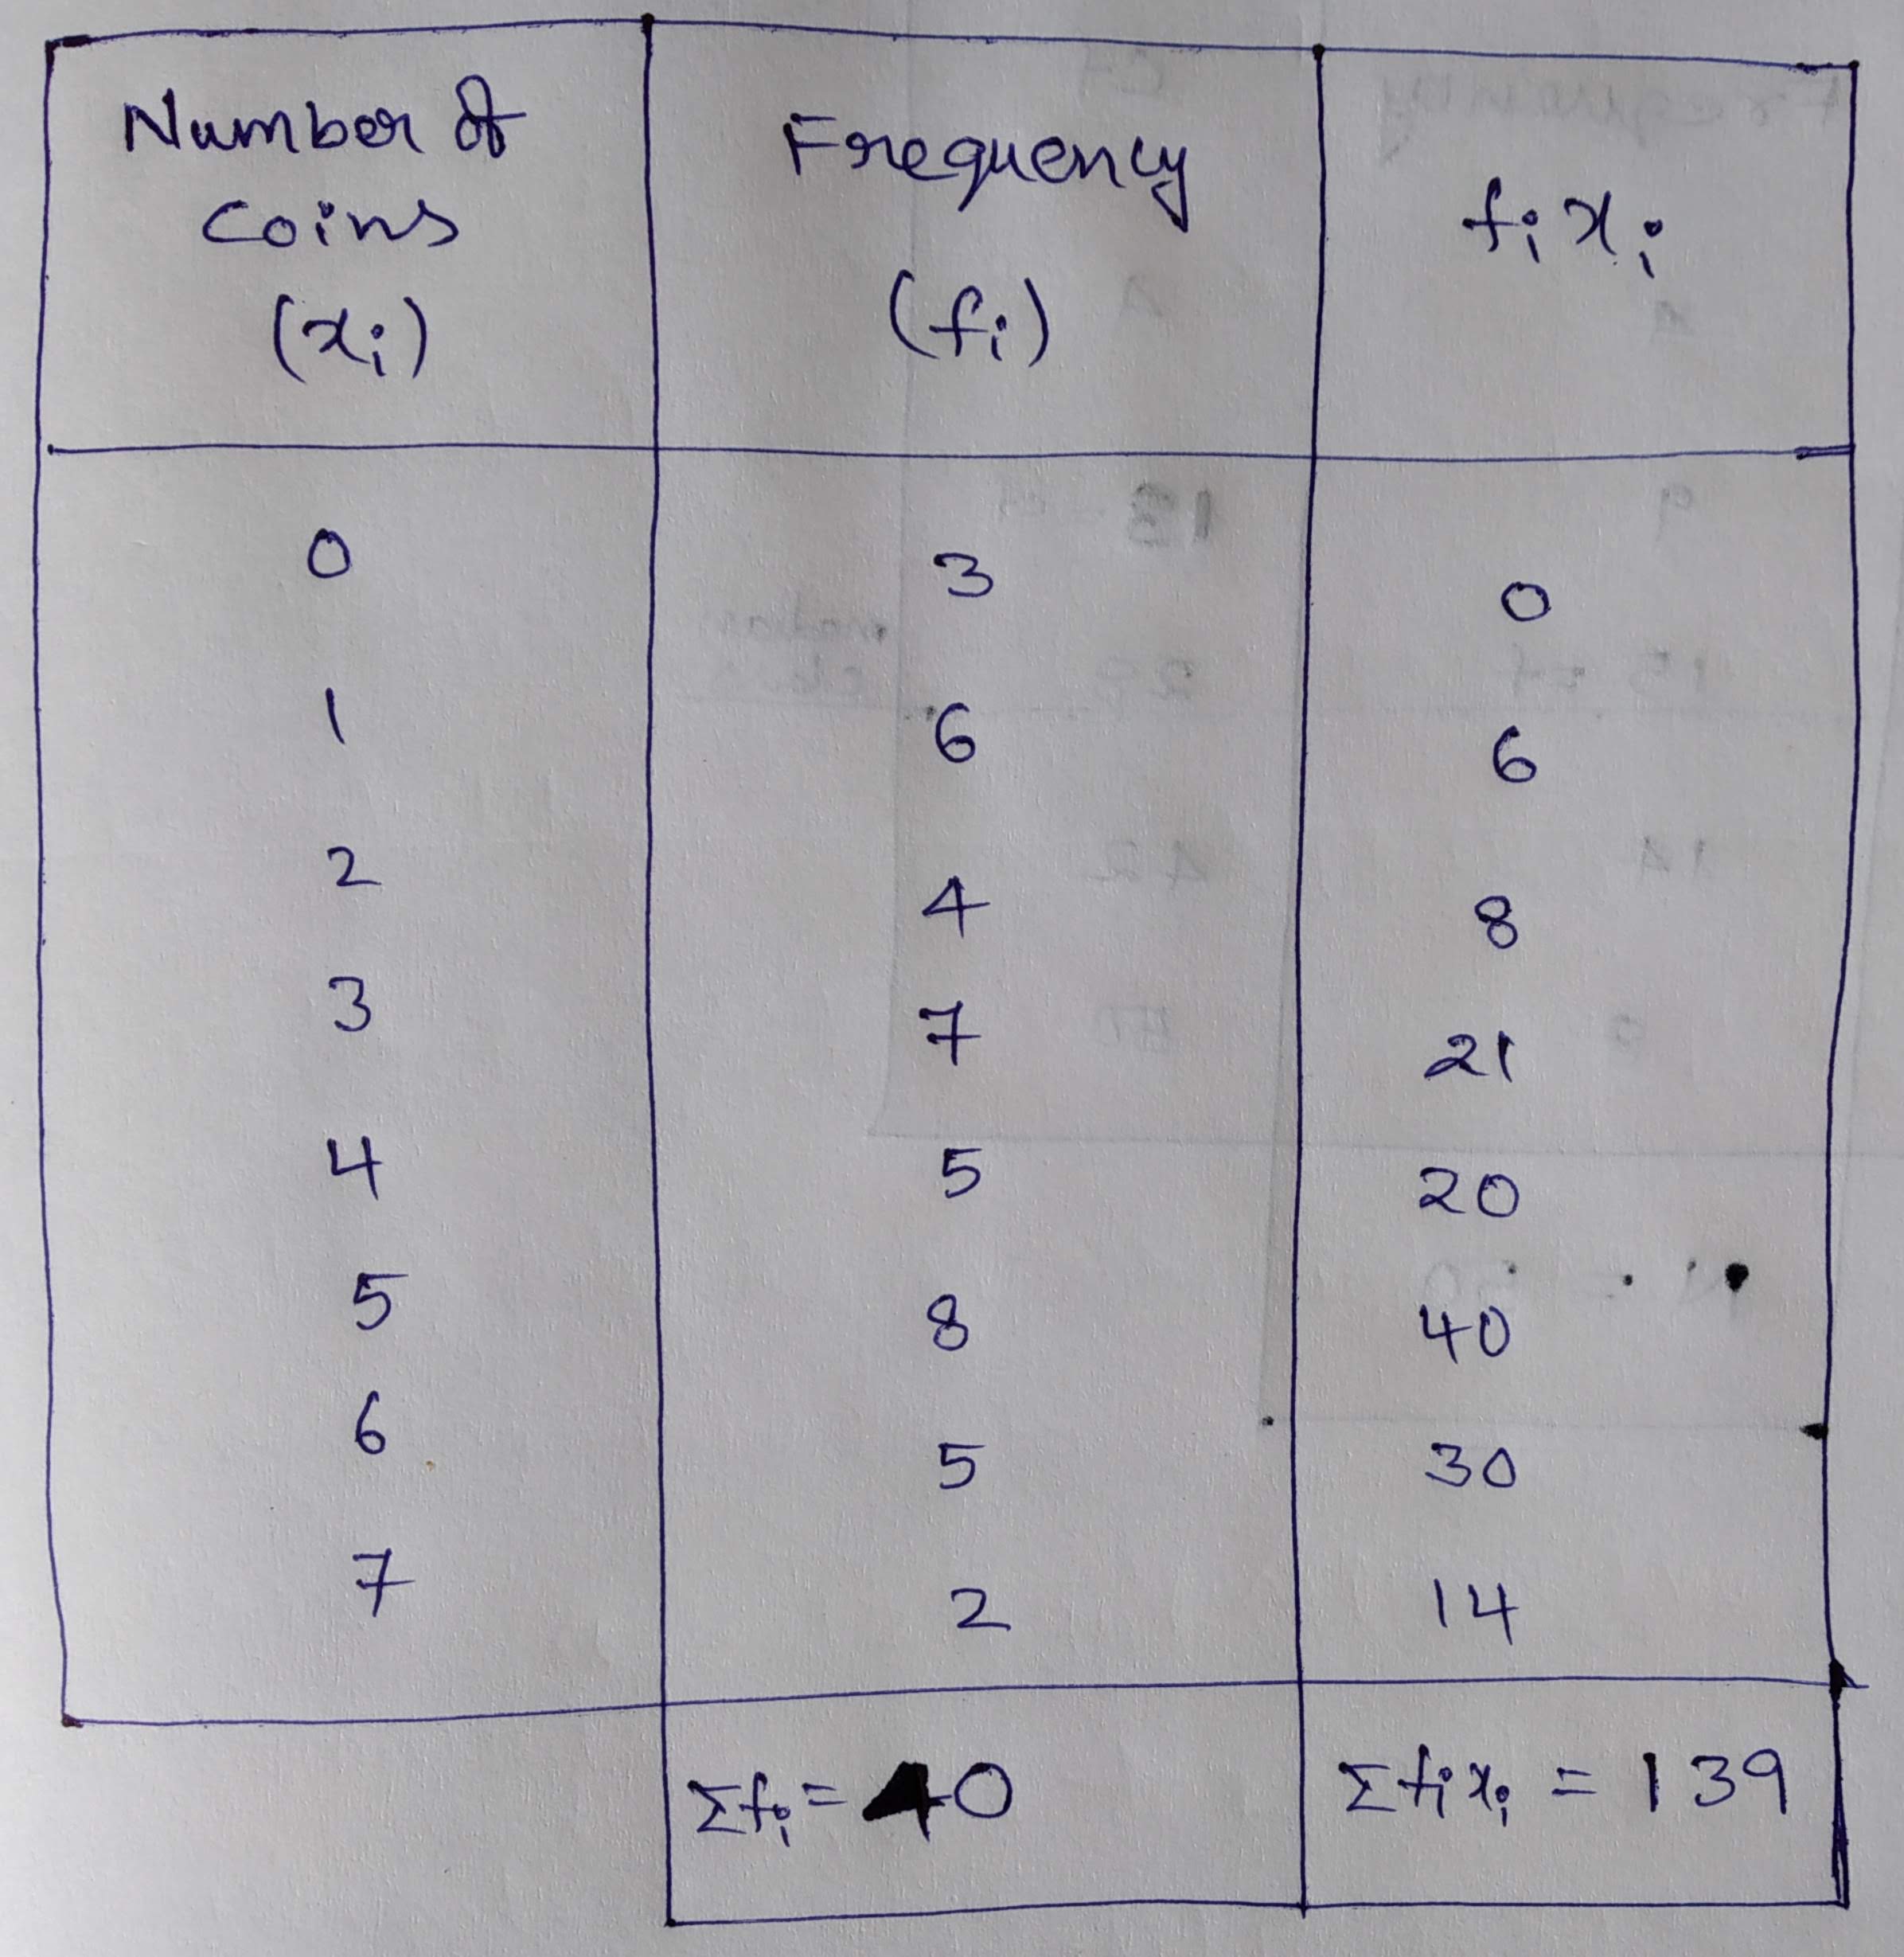
A number of people were asked how many coins they had in their pockets; the results are shown below. Calculate the mean number of coins per person.
| Number of coins | $$0$$ | $$1$$ | $$2$$ | $$3$$ | $$4$$ | $$5$$ | $$6$$ | $$7$$ |
| frequency | $$3$$ | $$6$$ | $$4$$ | $$7$$ | $$5$$ | $$8$$ | $$5$$ | $$2$$ |
The weight of 50 apples were recorded as given below. Calculate the mean weight to the nearest gross, by the step deviation method
| weight | 80-85 | 85-90 | 90-95 | 95-100 | 100-105 | 105-110 | 110-115 |
| No. of apples | 5 | 8 | 10 | 12 | 8 | 4 | 3 |
What is the median of $$10, 14, 86, 2, 6, 8, 99, 1$$.
Find the arithmetic mean of the following frequency distribution using the step deviation method.
| Class | 0-10 | 10-20 | 20-30 | 30-40 | 40-50 |
| Frequency | 9 | 12 | 15 | 10 | 14 |
The distribution given below shows the number of wickets taken by bowlers in one-day cricket matches. Find the mean number of wickets by choosing a suitable method.
| No. of Wickets | $$20-60$$ | $$60-100$$ | $$100-150$$ | $$150-250$$ | $$250-350$$ | $$350-450$$ |
| No. of Bowlers | $$7$$ | $$5$$ | $$16$$ | $$12$$ | $$2$$ | $$3$$ |
Find the mode of $$90, 55, 67, 55, 75, 75, 40 , 35, 55, 95$$.
The following distribution shows the daily pocket allowance of children of a locality . The mean pocket allowance is $$Rs. 18.$$ Find the missing frequency $$f$$ ?
| Dally pocket allowance (in Rs) | $$11-13$$ | $$13-15$$ | $$15-17$$ | $$17-19$$ | $$19-21$$ | $$21-23$$ | $$23-25$$ |
| Number of children | $$7$$ | $$6$$ | $$9$$ | $$13$$ | $$f$$ | $$5$$ | $$4$$ |
If a variable takes values 1,2,3,....n with frequencies $${1^2},{2^2},...{n^2}....$$Then the mean is
Frequency distribution of daily commission received by salesman is given.
Find mean daily commission received by a salesman.
The mean of $$9, 11, 13, x, 18, 19$$ is x. Find x.
The batting scores of two cricket players A and B in 10 innings are as follows :-
| Batsman A | 15 | 17 | 19 | 27 | 30 | 36 | 40 | 90 | 95 | 110 |
| Batsman B | 10 | 16 | 21 | 28 | 37 | 41 | 36 | 80 | 82 | 65 |
On the sports day of a school, $$300$$ students participated. Their ages are given in the following distribution.
| Age (in years) | $$5-7$$ | $$7-9$$ | $$9-11$$ | $$11-13$$ | $$13-15$$ | $$15-17$$ | $$17-19$$ |
| Number of students | $$67$$ | $$33$$ | $$41$$ | $$95$$ | $$36$$ | $$13$$ | $$15$$ |
(a) Calculate the arithmetic mean of $$5.7, 6.6, 7.2, 9.3, 6.2$$
(b) The weight (in kg) of $$8$$ new born babies are $$3,3.2,3.4,3.5, 4,3.6,4.1,3.2$$. Find the mean weight of the babies.
Above the chart given below and answer the question.
| match no | Player 1 | Player 2 |
| 1 | 35 | 46 |
| 2 | 80 | 238 |
| 3 | 15 | 51 |
| 4 | 47 | 42 |
| 5 | 18 | 25 |
| 6 | 54 |
| Class | 20-60 | 60-100 | 100-150 | 150-250 | 250-350 | 350-450 |
| Fi | 7 | 5 | 18 | 12 | 2 | 3 |
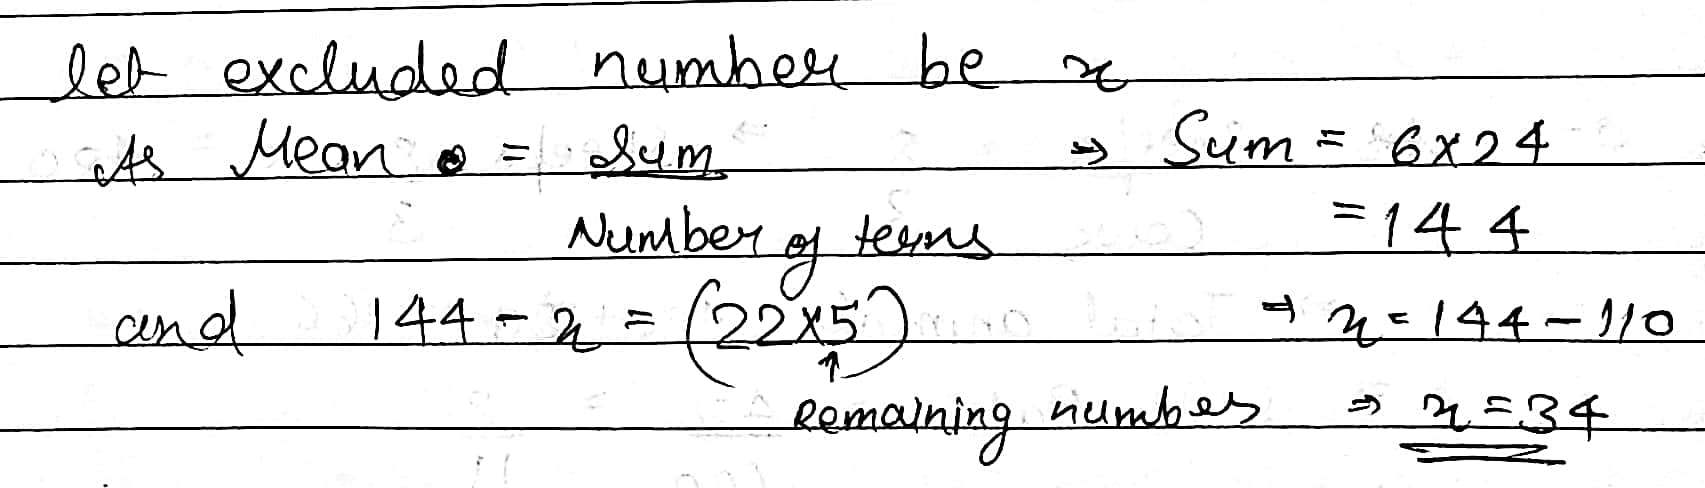
Mean of Eight observation is 25 . If one observation is 11 excluded . find mean of the remaining .
no. of observations =8
If the mean of the following frequency distribution is $$8$$, then find the value of $$'k'$$ ?
| $$x$$ | $$2$$ | $$4$$ | $$6$$ | $$8$$ | $$10$$ | $$12$$ |
| $$frequency = f$$ | $$4$$ | $$7$$ | $$10$$ | $$16$$ | $$k$$ | $$3$$ |
Consider the following distribution of daily wages of 50 workers of a factory:
Find the mean daily wages of the workers of the factory by using appropriate method.
| Daily wages(in rs) | Number of workers |
| 500-200 | 12 |
| 520-540 | 14 |
| 540-560 | 8 |
| 560-580 | 6 |
| 580-600 | 10 |
In a retail market fruit vendor were selling mangoes in boxes. These boxes contained varying number of mangoes. The following was the distribution.
| No.of mangoes | $$50-52$$ | $$53-55$$ | $$56-58$$ | $$59-61$$ | $$62-64$$ |
| No. of boxes | $$15$$ | $$110$$ | $$135$$ | $$115$$ | $$25$$ |
Find the mean for the following distribution
| Marks | 10-20 | 20-30 | 30-40 | 40-50 | 50-60 | 60-70 | 70-80 |
| Frequency | 6 | 8 | 13 | 7 | 3 | 2 | 1 |
Find the arithmetic mean of the sales per day in a fair price shop in a week
rs10000, rs10250, rs10790, rsrs15350, rs10110
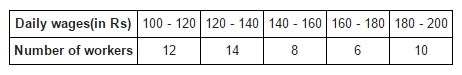
Consider the following distribution of daily wages of $$50$$ workers of a factory.
| Daily wages (in Rs) | $$100 - 120$$ | $$120 - 140$$ | $$140 - 160$$ | $$160 - 180$$ | $$180 -200$$ |
| Number of workers | $$12$$ | $$14$$ | $$8$$ | $$6$$ | $$10$$ |
The weighted mean of first $$n$$ natural numbers, whose weights are proportional to the corresponding numbers is $$\dfrac {2n+1}{3}$$.Is it true? If true enter 1 else 0.
Find the mean and median of the data 35, 48, 92, 76, 64, 52, 51, 63 andIf 51 is replaced by 66, what will be the new median ?
The following observations have been arranged in the ascending order. If the median of the data is 78, find the value of $$x$$.
$$44,47,63,65 , x + 13,87,93,99,110$$
Find the modes of the following data:
$$5,6,3,5,4,9,5,6,4,9,5$$
The following data shows the number of visitors to a zoological park every hour. Calculate the average number of visitors to the park during the whole day.
| Time | 10-11 a.m | 11-12 noon | 12-1 p.m | 1-2 p.m | 2-3 p.m | 3-4 p.m | 4-5 p.m |
| Numbers of visitors | 30 | 40 | 34 | 26 | 35 | 34 | 32 |
Mean of the numbers $$1,2,3 , \ldots ,$$ n with respective weights $$1 ^ { 2 } + 1,2 ^ { 2 } + 2,3 ^ { 2 } + 3 , \ldots , n ^ { 2 } + n$$ is
The following observations have been arranged in ascending order:
$$11,12,14,18,x+2,x+4,30,32,35,41$$. If the median of the data is $$24$$, find $$x$$.
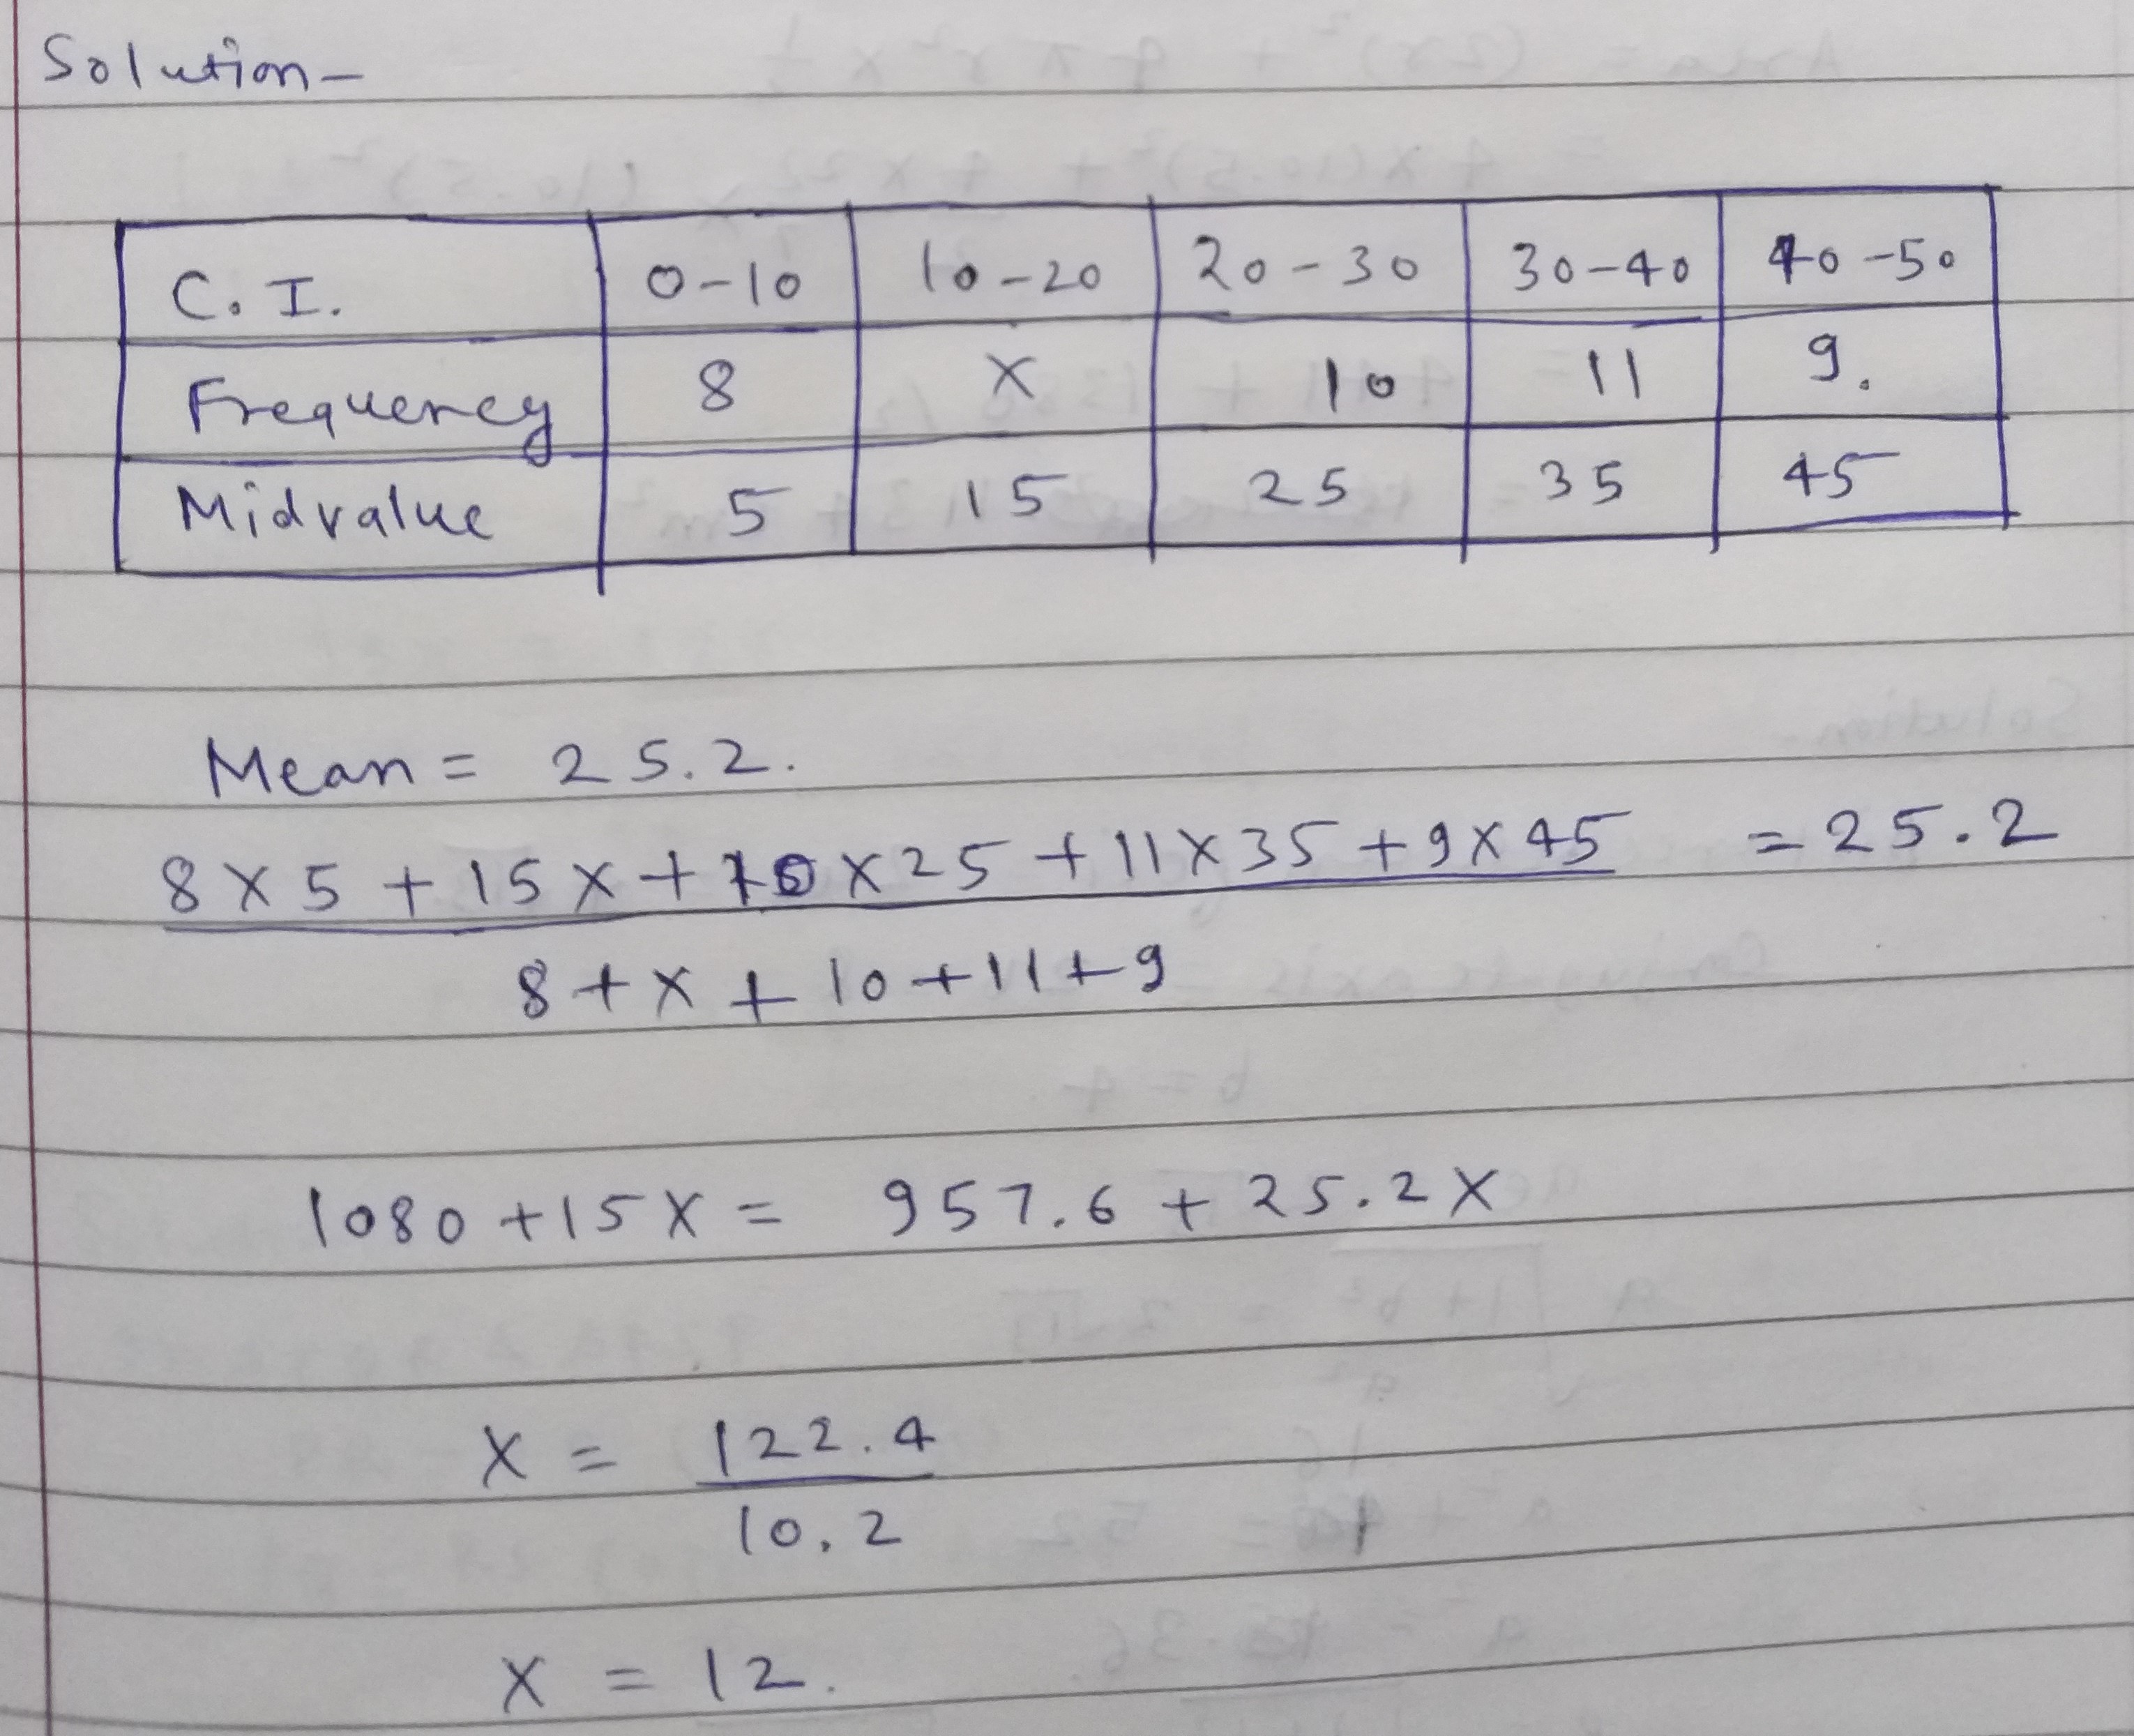
The mean of the following frequency distribution is $$25.2$$. Find the missing frequency $$x$$
| $$C.I.$$ | $$0-10$$ | $$10-20$$ | $$20-30$$ | $$30-40$$ | $$40-50$$ |
| frequency | $$8$$ | $$X$$ | $$10$$ | $$11$$ | $$9$$ |
| C.I | 0-10 | 10-20 | 20-30 | 30-40 | 40-50 |
| Frequency | 8 | X | 10 | 11 | 9. |
| Midvalue | 5 | 15 | 25 | 35 | 45 |
The scores in mathematics test of $$15$$ student are as follow:
$$9,\ 25,\ 10,\ 20,\ 9,\ 20,\ 15,\ 10,\ 5,\ 15,\ 25,\ 20,\ 20,\ 15,\ 20$$
Find the mode of this data.
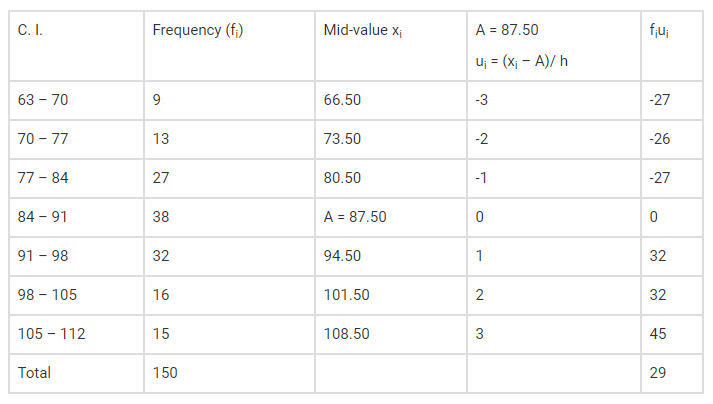
The following table gives the information of frequency distribution of weekly wages of $$150$$ workers of a company. Find the mean of the weekly wages by 'step deviation' method.
| Weekly wages (Rupees) | $$1000-2000$$ | $$2000-3000$$ | $$3000-4000$$ | $$4000-5000$$ |
| No. of workers | $$25$$ | $$45$$ | $$50$$ | $$30$$ |
The weekly wages of $$120$$ workers in a factory are shown in the following frequency distribution table. Find the mean of the weekly wages.
| Weekly wages (Rupees) | $$0-2000$$ | $$2000-4000$$ | $$4000-6000$$ | $$6000-8000$$ |
| No. of workers | $$15$$ | $$35$$ | $$50$$ | $$20$$ |
A frequency distribution of the life times of $$400$$ T.V. picture tubes tested in a tube company is given. Find the average life time of a tube.
| Life time (in hrs) | Frequency | Life time (in hrs) | Frequency |
| $$300-399$$ | $$14$$ | $$800-899$$ | $$62$$ |
| $$400-499$$ | $$46$$ | $$900-999$$ | $$48$$ |
| $$500-599$$ | $$58$$ | $$1000-1099$$ | $$22$$ |
| $$600-699$$ | $$76$$ | $$1100-1199$$ | $$6$$ |
| $$700-799$$ | $$68$$ |
One situation where mean would be appropriate representative value.
Th following distribution shows the number of outdoor patients in $$64$$ hospitals. Ifthe mean is $$18 .$$ find the missing frequencies $$f _ { 1 }$$ and $$f _ { 2 }.$$
Find the mean of the following frequency distribution by the assumed mean method :
| No. of apples | $$50-53$$ | $$53-56$$ | $$56-59$$ | $$59-62$$ | $$62-65$$ |
| No of boxes | $$20$$ | $$150$$ | $$115$$ | $$95$$ | $$20$$ |
Consider the following distribution of daily wages of $$50$$ workers of a factory.
| Daily wages (in Rs) | 100-120 | 120-140 | 140-160 | 160-180 | 180-200 |
| Number of workers | 12 | 14 | 8 | 6 | 10 |
The mean of 6 numbers isIf one number is excluded, the mean of remaining number becomes 22 find the excluded number.
Find the mean of the following frequency distribution using step-deviation method.
| Marks obtained | number of students |
| Less than 10 | 14 |
| Less than 20 | 22 |
| Less than 30 | 37 |
| Less than 40 | 55 |
| Less than 50 | 67 |
| Less than 60 | 75 |
The following data gives the information on the life - time (in hours) of 75 electrical instruments.
| Lifetime (in hours) | 0-20 | 20-40 | 40-60 | 60-80 | 80-100 | 100-120 |
| Frequency | 10 | 15 | 12 | 21 | 8 | 9 |
Give below is the frequency distribution of marks scored by the students:
Calculate mean marks scored by a student by using $$'Direct Method'$$

A frequency distribution table for the production of oranges of some farm owners is given below. Find the mean production of oranges by 'assumed mean' method.
| Production (in thousand rupees) | $$25-30$$ | $$30-35$$ | $$35-40$$ | $$40-45$$ | $$45-50$$ |
| No. of farm owners | $$20$$ | $$25$$ | $$15$$ | $$10$$ | $$10$$ |
Calculate the mean of the following distribution.
| Class | 0-20 | 20-40 | 40-60 | 60-80 | 80-100 | 100-120 |
| Frequency | 5 | 8 | 10 | 12 | 7 | 8 |
What is the mean height of a students of $$1400,147,145,155,160,150,144,148,152$$.
Find the mean of the following data
| Class | 10-20 | 20-30 | 30-40 | 40-50 | 50-60 | 60-70 | 70-80 |
| Frequency | 3 | 6 | 8 | 10 | 8 | 5 | 3 |
The following table shows the heights $$(cm)$$ of $$50$$ girls of class $$X$$ of a school.
| Height $$(cm)$$ | Number of girls |
| $$120-130$$ | $$2$$ |
| $$130-140$$ | $$8$$ |
| $$140-150$$ | $$12$$ |
| $$150-160$$ | $$20$$ |
| $$160-170$$ | $$8$$ |
| $$Total$$ | $$50$$ |
If the arithmetic mean of following data is 17, find the value of P.
| Term(x) | 10 | 15 | 20 | 25 |
| Frequency(f) | 7 | 10 | P | 6 |
The median of $$34,83,25,74,56$$ is
Find mode of the following distribution
Find mean of the following for example distribution.
| Marks | 0-20 | 20-40 | 40-60 | 60-80 | 80-100 | 100-120 | 120-140 |
| No.of students | 6 | 8 | 10 | 12 | 6 | 5 | 3 |
The Median of data $$ \dfrac{k}{6}, \dfrac{k}{4}, k, \dfrac{k}{3}, \dfrac{k}{2} $$ is 14 . Find $$k$$.
If the mean of $$8,12,21,42 , x$$ is 20 then the value of $$x$$
The table shows the daily expenditure on food of 25 households in a locality. Find the mean daily expenditure on food by a suitable method
Find the average age from the following distribution :
Find median of data $$2,6,4,3,5,1,9,8,7$$
If the average number of 8 terms is given to be 40 and the average of first 6 terms is given to be 35.What is the average of the remaining 2 terms?
The average of 5 terms isIf the first 4 terms are 45, 42, 119, and 84, what will be the last term?
Calculate the mean, median and mode
$$23, 25, 28, 25, 16, 23, 17, 22, 25, 25$$.
The average of 7 consecutive numbers is n. If the next two numbers are included, the average will be.....
In a family of 6 members, the average age of the family at present is 25 while the age of the youngest member in the family is 5yrs, so what will be the average age of the family at the time of his birth ?
The measurements (in mm) of the diameters of the heads of the screws are given below. Calculate the mean diameter of the head of the screws.
| Diameter (in mm) | 33-35 | 36-38 | 39-41 | 42-44 |
| Number of screws $$\left( { f }_{ 1 } \right) $$ | 17 | 19 | 23 | 21 |
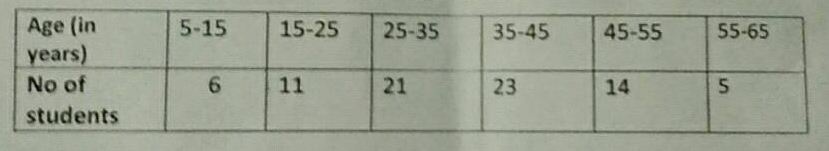
Calculate the mean of the following distribution
| CI | 5-15 | 15-25 | 25-35 | 35-45 | 45-55 | 55-65 |
| f | 6 | 11 | 21 | 23 | 14 | 5 |
Find the mean of the following data, by using suitable method.
| Class interval | Frequency |
| 0-4 | 4 |
| 5-9 | 3 |
| 10-14 | 2 |
| 15-19 | 1 |
The heights (in cm) of 50 students of a class are given below:
| Height (in cm) | 156 | 154 | 155 | 151 | 157 | 152 | 153 |
| Number of students | 8 | 4 | 10 | 6 | 7 | 3 | 12 |
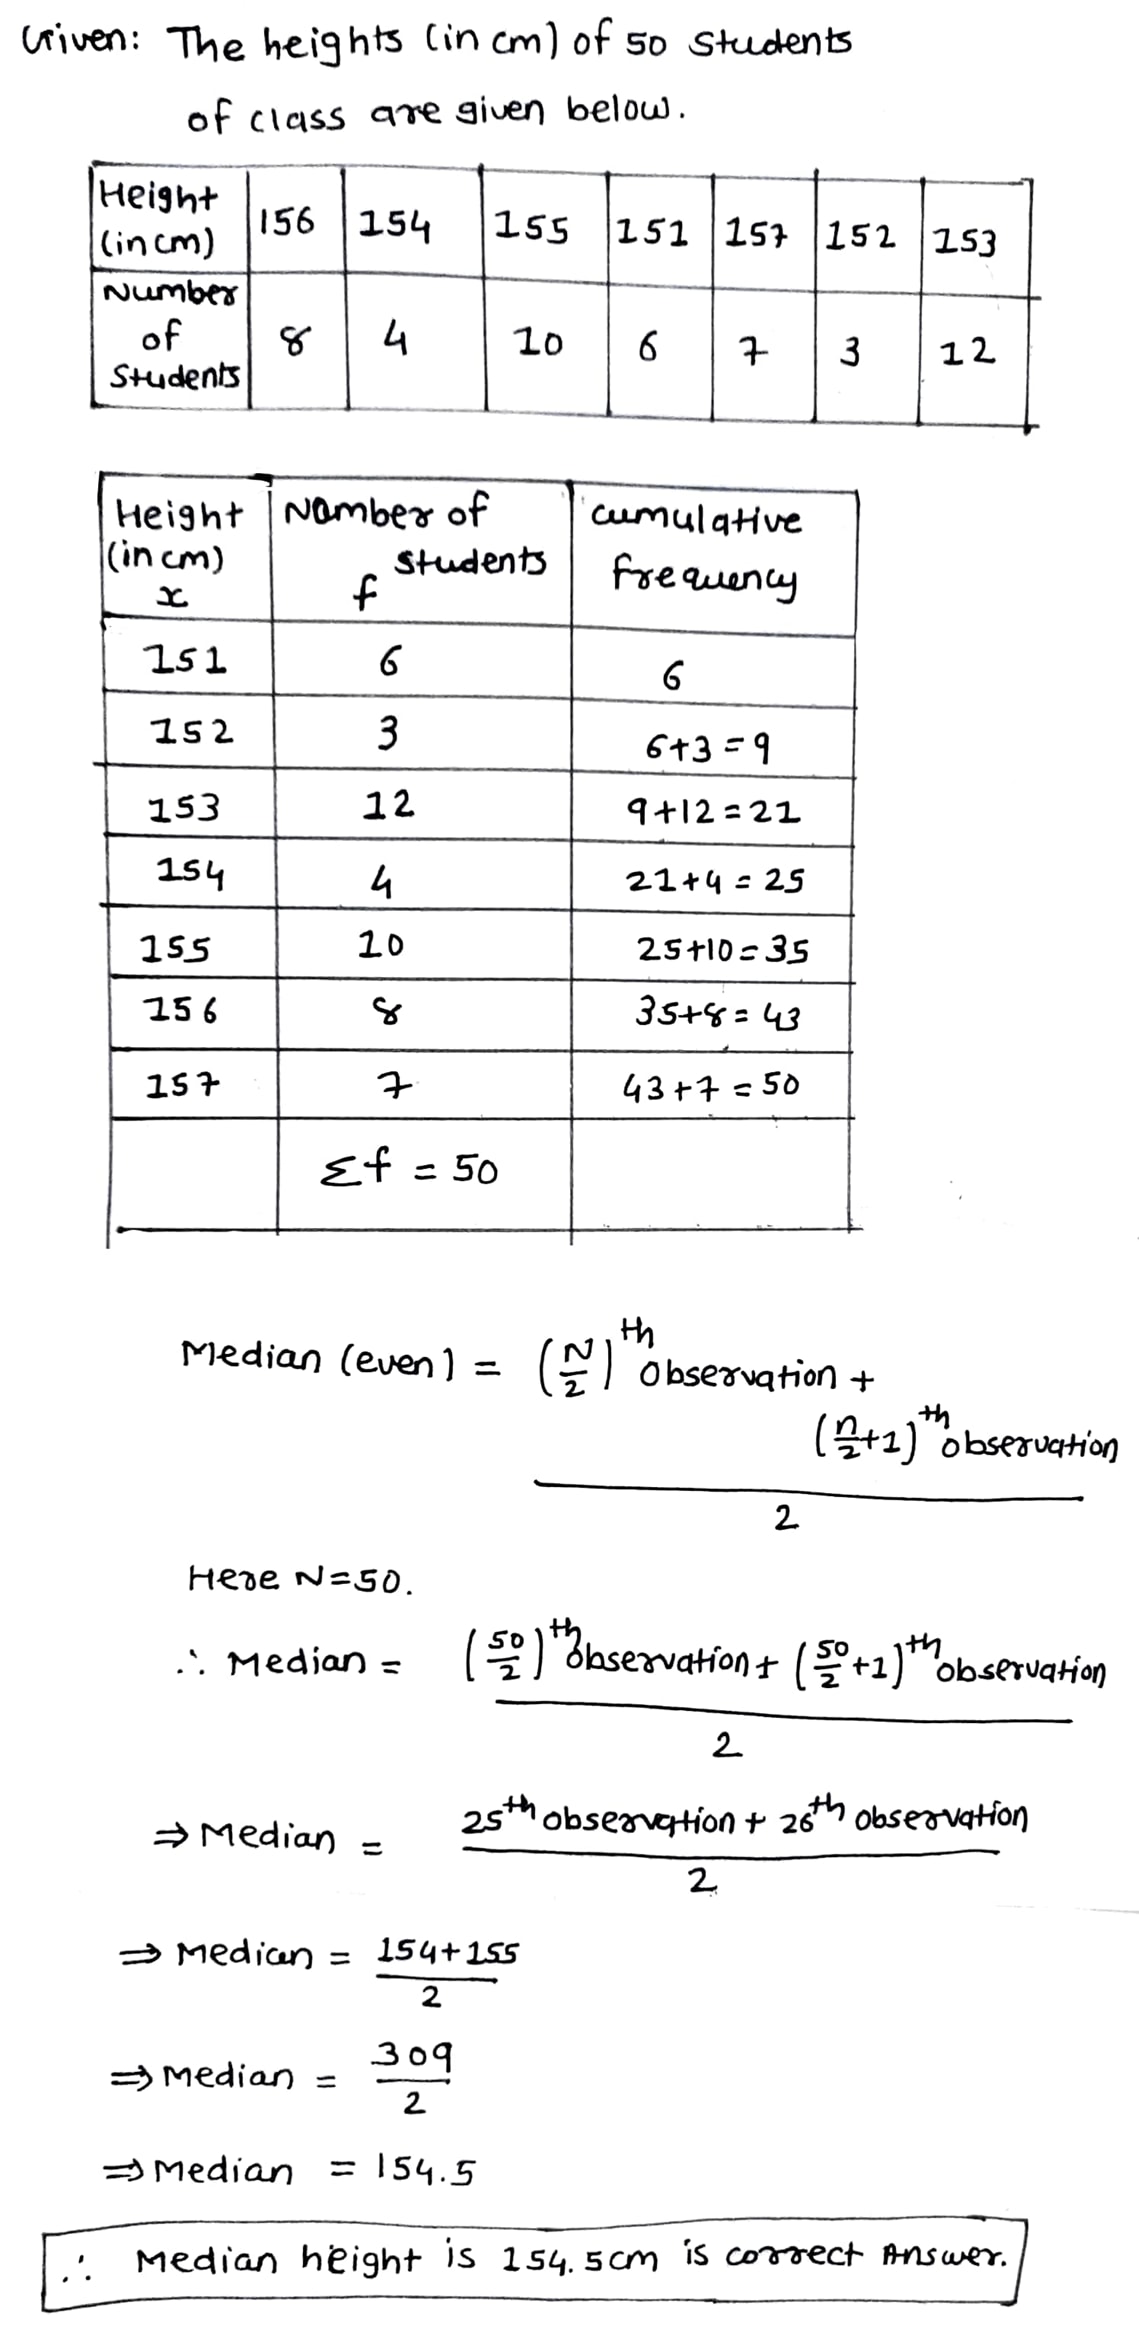
The weights of $$11$$ children in school cricket club are $$35, 39, 32, 36, 40, 30, 34, 37, 38, 33, 31$$ (kgs). Find the median weight.
Consider the following distribution of daily wages of 50 workers of a factory :
Daily wages (in Rs) | 500-520 | 520-540 | 540-560 | 560-580 | 580-600 |
Number of workers | 12 | 14 | 8 | 6 | 10 |
Find the mean daily wages of the workers of the factory by using an appropriate method.
The marks obtained by the students of class $$6$$ are shown:
| $$0-10$$ | $$10-20$$ | $$20-30$$ | $$30-40$$ |
| $$15$$ | $$32$$ | $$55$$ | $$35$$ |
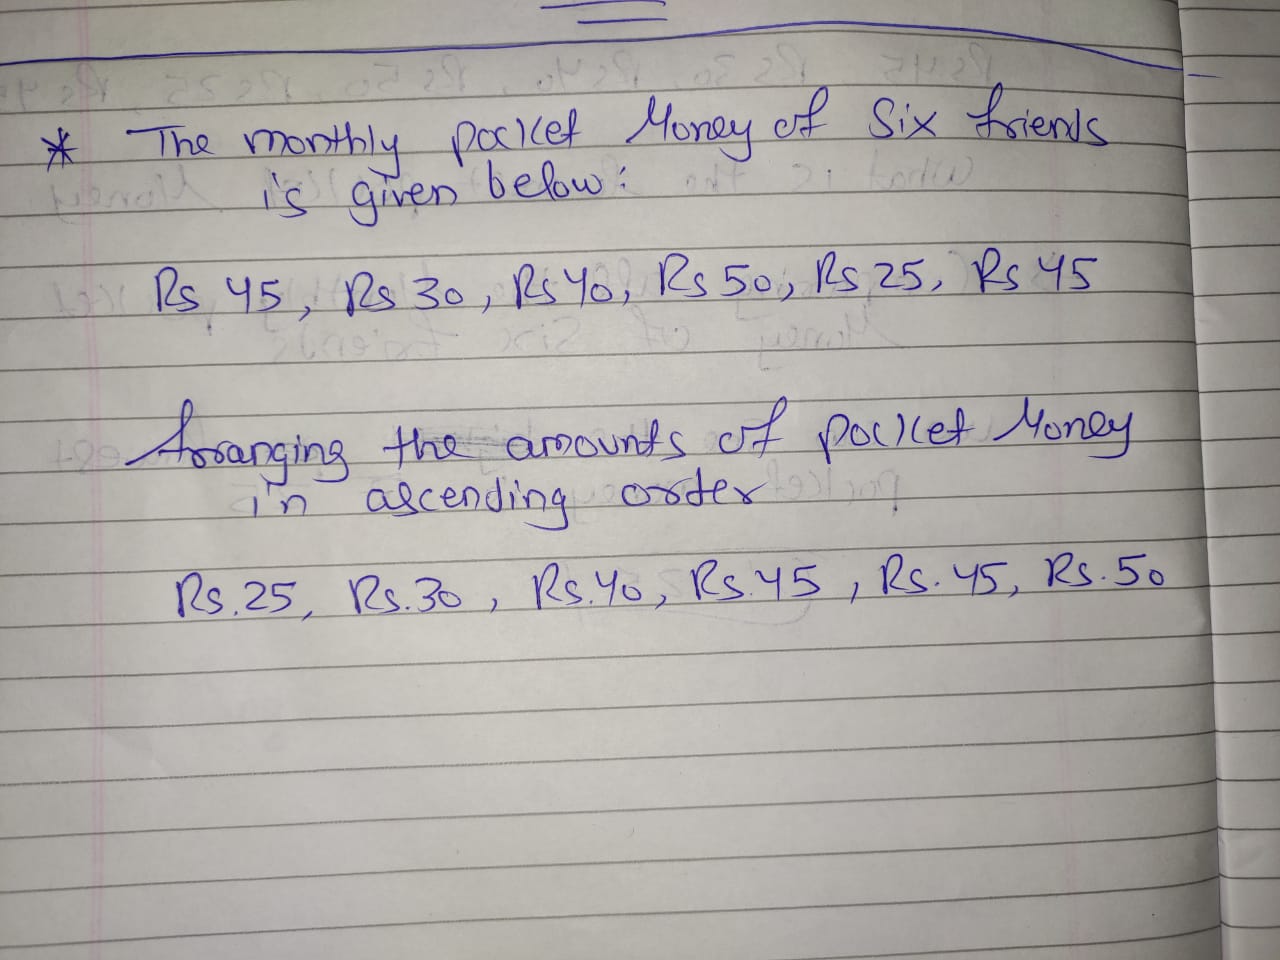
If following statement is true enter '1' else enter '0'.The monthly pocket money of six friends is given below:
Rs. 45, Rs. 30, Rs. 40, Rs. 50, Rs. 25, Rs. 45
The amounts of pocket money in ascending order areRs. 25, Rs. 30, Rs. 40, Rs. 45, Rs.45, Rs. 50
Find the missing frequencies if the mean of the given data is $$53$$.
| Age in years | $$0-20$$ | $$20-40$$ | $$40-60$$ | $$60-80$$ | $$80-100$$ | Total |
| Number of People | $$15$$ | $${F}_{1}$$ | $$21$$ | $${F}_{2}$$ | $$17$$ | $$100$$ |
Find the mean of the following frequency by a suitable method.
| C.I. | 50-70 | 70-90 | 90-110 | 110-130 | 130-150 | 150-170 |
| Frequency | 8 | 12 | 13 | 27 | 18 | 22 |
Find the median of the following data
41, 43,127, 99,71, 92, 71, 58, 57
The demand of different shirt sizes, as obtained by a survey, is given below:
| Size: | 38 | 39 | 40 | 41 | 42 | 43 | 44 | Total |
| Number of persons(wearing it): | 26 | 39 | 20 | 15 | 13 | 7 | 5 | 125 |
Find the modal shirt sizes, as observed from the survey.
Find the median of the following data
31, 38, 27, 28, 36, 25, 35, 40
Find the median of the following data
12, 17, 3, 14, 5, 8, 7, 15
Find the median of the following data
25, 34, 31, 23, 22, 26, 35, 29, 20, 32
Find the median of the following data
15, 6, 16, 8, 22, 21, 9, 18, 25
Heights of 25 children (in cm) in a school are as given below:
$$168,165,163,160,163,161,162,164,163,162,164,163,160,163,163,165,163,162,163,164,$$$$163,160,165,163,162$$
What is the mode of heights?
What is the mode of heights?
Find mode of the data: $$2,6,5,3,0,3,4,3,2,4,5,2,4$$
Find the median of the following observations : 46, 64, 87, 41, 58, 77, 35, 90, 55, 92, 33.If 92 is replaced by 99 and 41 by 43 in the above data, find the new median.
Find the mean of the following data :
| x : | 19 | 21 | 23 | 25 | 27 | 29 | 31 |
| f : | 13 | 15 | 16 | 18 | 16 | 15 | 13 |
The weights (in kg) of 15 students are : $$31,35,27,29,32,43,37,41,34,28,36,44,45,42,30$$. Find the median. If the weight 44 kg is replaced by 46 kg and 27 kg by 25 kg, find the new median.
The mean of the following distribution is 23.Find the value of P.
Class intervals | 0-8 | 8-16 | 16-24 | 24-32 | 32-40 | 40-48 |
Frequency | 5 | 3 | 10 | P | 4 | 2 |
Find the mean of the following data, using direct method:
| Class | $$0-10$$ | $$10-20$$ | $$20-30$$ | $$30-40$$ | $$40-50$$ | $$50-60$$ |
| Frequency | $$7$$ | $$5$$ | $$6$$ | $$12$$ | $$8$$ | $$2$$ |
Find the mean of the following distribution:
| Class: | $$3-5$$ | $$5-7$$ | $$7-9$$ | $$9-11$$ | $$11-13$$ |
| Frequency: | $$5$$ | $$10$$ | $$10$$ | $$7$$ | $$8$$ |
Using the step-deviation method, calculate the mean marks of the following distribution.
Class interval | 50-55 | 55-60 | 60-65 | 65-70 | 70-75 | 75-80 | 80-85 | 85-90 |
Frequency | 5 | 20 | 10 | 10 | 9 | 6 | 12 | 8 |
Using an appropriate method, find the mean of following frequency distribution :
| Class | $$84-90$$ | $$90-96$$ | $$96-102$$ | $$102-108$$ | $$108-114$$ | $$114-120$$ |
| Frequency | $$8$$ | $$10$$ | $$16$$ | $$23$$ | $$12$$ | $$11$$ |
Find the mean of the following data, using direct method:
| Class | $$25-35$$ | $$35-45$$ | $$45-55$$ | $$55-65$$ | $$65-75$$ |
| Frequency | $$6$$ | $$10$$ | $$8$$ | $$12$$ | $$4$$ |
Compute the mean of the following data, using direct method:
| Class | $$0-100$$ | $$100-200$$ | $$200-300$$ | $$300-400$$ | $$400-500$$ |
| Frequency | $$6$$ | $$9$$ | $$15$$ | $$12$$ | $$8$$ |
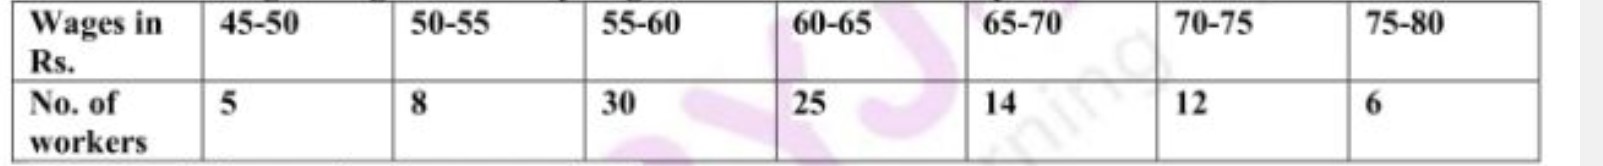
The following table gives the daily wages of a worker in a factory:
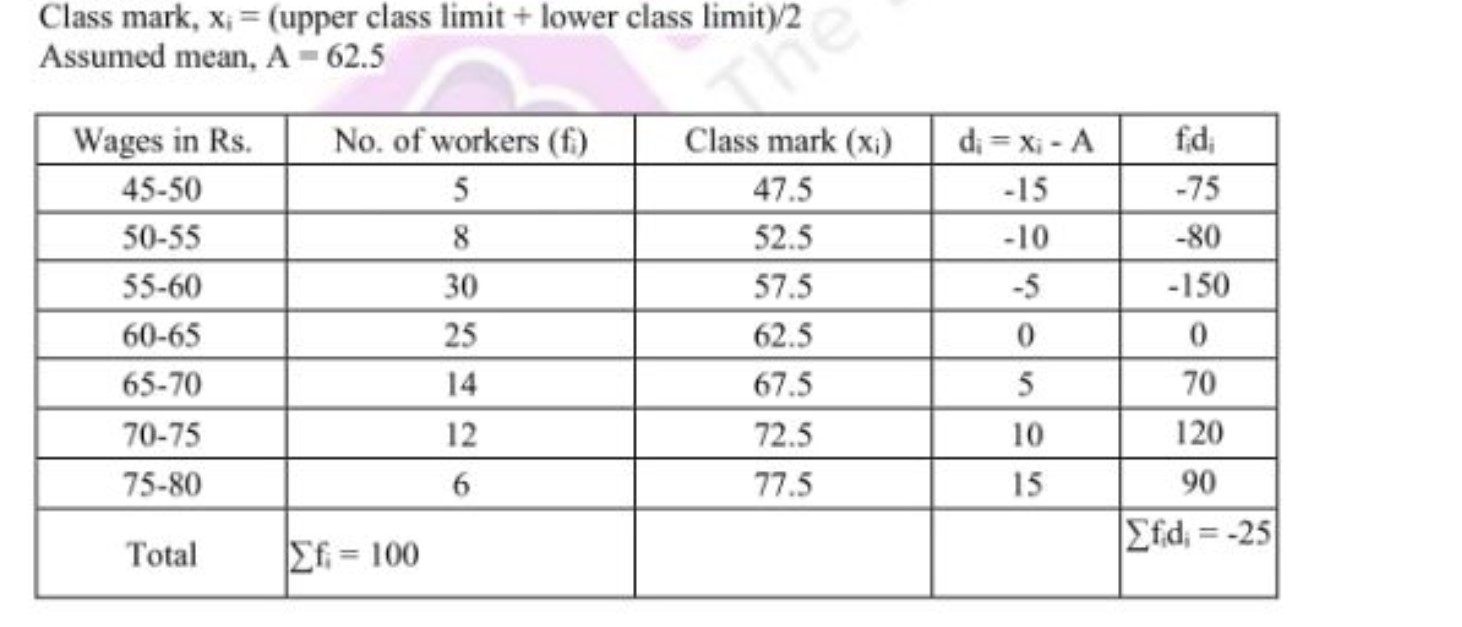
Calculate their mean by the short cut method.
$$=62.5+(-25/100)$$
$$=62.5-0.25$$
$$=62.25$$
Hence mean of the distribution is $$62.25$$
Calculate the mean of the following distribution using step deviation method
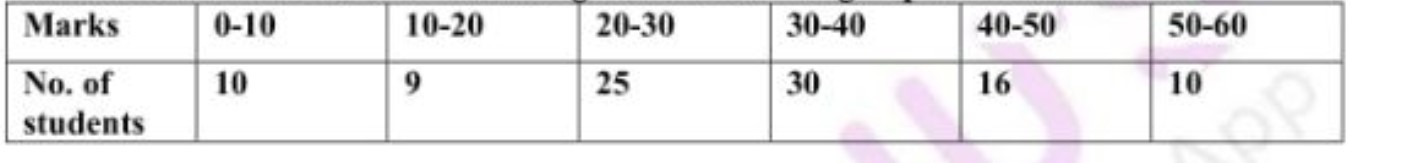
$$=25+10(63/100)$$
$$=25+10\times0.63$$
$$=25+6.3$$
$$=31.3$$
Hence mean of the distribution is $$31.3$$
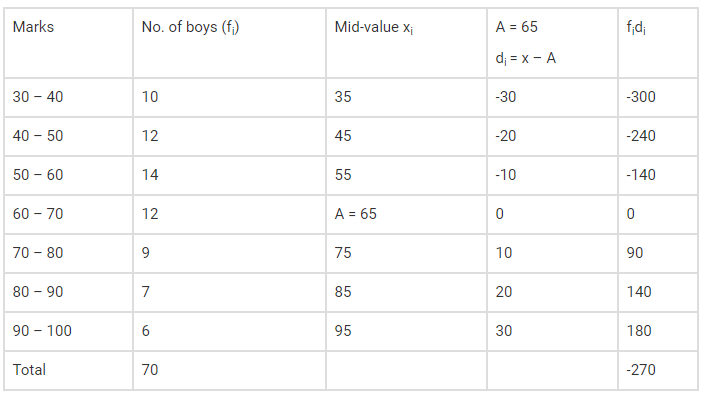
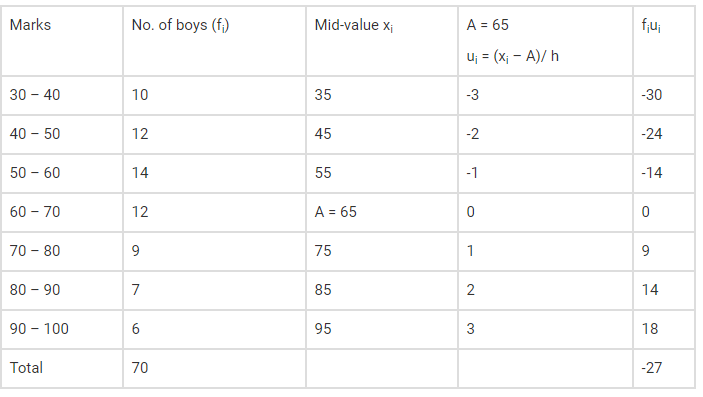
The following are the marks obtained by $$70$$ boys in a class test:
Calculate the mean by: Short cut method
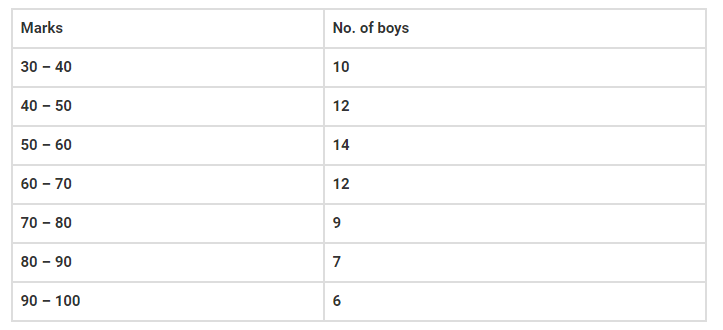
$$\bar{x}=A+\dfrac{\sum f_id_i}{\sum f_i}=65 + \left ( \dfrac{-270}{70} \right )=65-3.86=61.14$$
The median of an ungrouped data and the median calculated when the same data is grouped are always the same. Do you think that this is a correct statement? Give reason.
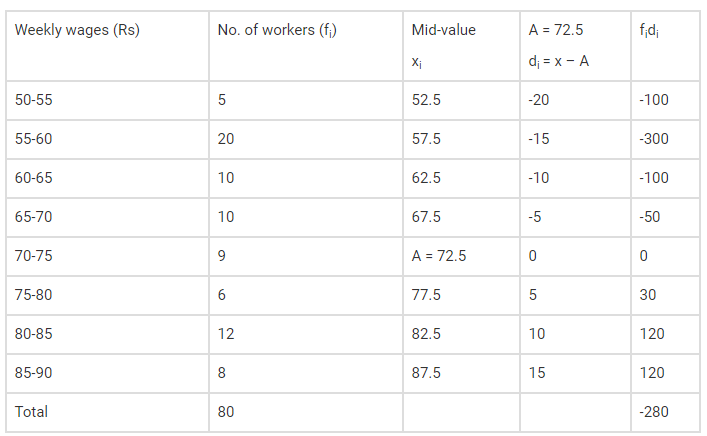
The following table gives the weekly wages of workers in a factory.
Calculate the mean by using: Short Cut Method

$$\bar{x} = A + \dfrac{\sum f_id_i}{\sum f_i}=72.5 + \left ( \dfrac{-280}{80} \right ) = 72.5 - 3.5 = 69$$
The median of an ungrouped data and the median calculated when the same data is grouped are always the same. Do you think that this is a correct statement? Give reason.
Calculate the median of the following frequency distribution table:
$$\begin{array}{|l|l|}\hline Class Interval & Frequency \\\hline 1-4 & 6 \\4-7 & 30 \\7-10 & 40 \\10-13 & 16 \\13-16 & 4 \\16-19 & 4 \\\hline\end{array}$$
The following observations have been arranged in ascending order. If the median the data is $$13$$, find the value of $$x$$
$$3,6,7,10,x,x+4,19,20,25,28$$
The following table gives the weekly wages of workers in a factory.
Calculate the mean by using: Direct Method
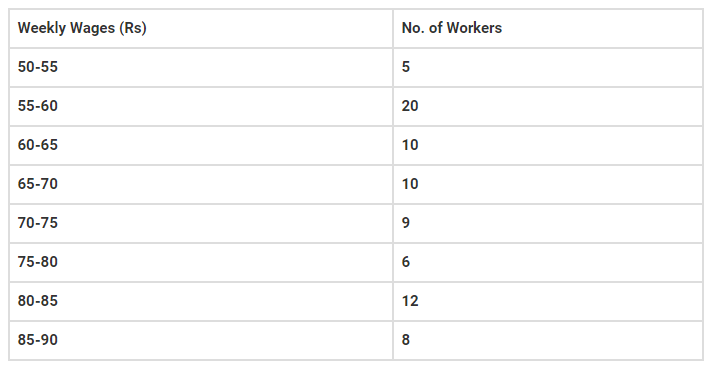

Mean $$= \sum f_i x_i/ \sum f_i = 5520/80 = 69$$
A frequency distribution of funds collected by 120 workers in a company for the drought-affected people are given in the following table. Find the mean of the funds by 'step deviation' method.
| Funds (Rupees) | 0 - 500 | 500 - 1000 | 1000 - 1500 | 1500 - 2000 | 2000 - 2500 |
| No. of workers | 35 | 28 | 32 | 15 | 10 |
The following are the marks obtained by $$70$$ boys in a class test:
Calculate the mean by: Step deviation method
$$\bar{x}=A+\dfrac{\sum f_iu_i}{\sum f_i}=65 + 10 \times \left ( \dfrac{-27}{70} \right )=65-3.86=61.14$$
The mean of the following distribution is 132 and sum of frequencies isFind the values of $$f_1$$ and $$f_2$$
| Class interval | 0-40 | 40-80 | 80-120 | 120-160 | 160-200 | 200-240 |
| Frequency | 4 | 7 | $$f_1$$ | 12 | $$f_2$$ | 9 |

$$\Sigma f_iu_i = 2f_2 + 24$$
$$\Rightarrow f_2 = 8$$ $$......(1)$$
$$\Rightarrow f_1 + f_2 + 32 = 50$$
$$\Rightarrow f_1 + f_2 = 18$$ $$.....(2)$$
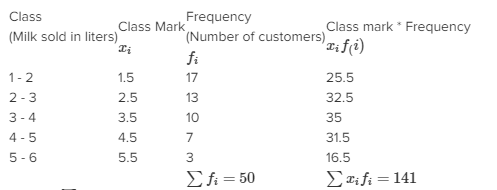
A milk center sold milk to 50 customers. The table below gives the number of customers and the milk they purchased. Find the mean of the milk sold by the direct method.
| Milk Sold (Litre) | 1 - 2 | 2 - 3 | 3 - 4 | 4 - 5 | 5 - 6 |
| No. of Customers | 17 | 13 | 10 | 7 | 3 |
Find the decile range and percentile on the basis of following data:
| X | f |
| 0 - 10 | 3 |
| 10 - 20 | 9 |
| 20- 30 | 8 |
| 30 - 40 | 5 |
| 40 - 50 | 7 |
| 50 - 60 | 5 |
| 60 - 70 | 7 |
| 70 - 80 | 6 |
The following tables gives the information of frequency distribution of weekly wages of150 workers of a company. Find the mean of the weekly wages by 'step deviation' method.
| Weekly wages (Rupees) | 1000 - 2000 | 2000 - 3000 | 3000 - 4000 | 4000 - 5000 |
| NO. of workers | 25 | 45 | 50 | 30 |
Write the formula to find mean for grouped data using step deviation method.
Find the decile range and percentile range of the following frequency distribution
| Marks (x) | 0 - 10 | 10 - 20 | 20 - 30 | 30 - 40 | 40 - 50 |
| Frequency (f) | 5 | 8 | 20 | 14 | 3 |
$$\dfrac{9N}{10} = \dfrac{9\times 502}{10} = = 9 \times 5 = 45 $$
Cumlative frequency exactly greater than 45 is 47, whose corresponding class is 30 - 40
$$\therefore l = 30, f = F = 33, h , h = 10$$
Find mean by step deviation method:
$$\bar{x}=A+ h \times \dfrac{\sum f_iu_i}{\sum f_i}=87.5 + 7 \times \dfrac{29}{150}=87.5 + 1.35 = 88.85$$
The following time shows the number of students and the time they utilized daily for their studies. Find the meantime spend by students for their studies by the direct method.
| Time (hrs.) | 0 - 2 | 2 - 4 | 4 - 6 | 6 - 8 | 8 - 10 |
| No. of students | 7 | 18 | 12 | 10 | 3 |
Two brands of tyres are to be compared for their mean life. The following data are available.
| Life (thousand km.) | $$10 - 15$$ | $$15 - 20$$ | $$20 - 25$$ | $$25 - 30$$ | $$30 - 35$$ | $$35 - 40$$ |
| No. of tyres of brand $$A$$ | $$4$$ | $$7$$ | $$10$$ | $$5$$ | $$3$$ | $$1$$ |
| No. of tyres of brand $$B$$ | $$5$$ | $$8$$ | $$15$$ | $$9$$ | $$6$$ | $$2$$ |
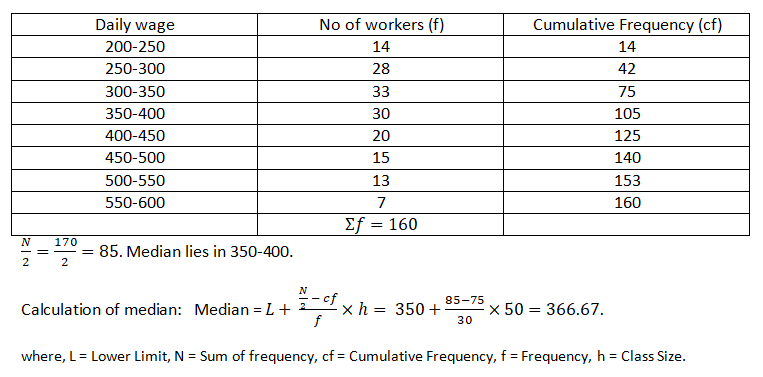
Following data relates to daily wages in rupees of persons working in a factory. Compute the median daily wage:
| Daily wage | 200-250 | 250-300 | 300-350 | 350-400 | 400-450 | 450-500 | 500-550 | 550-600 |
| No. of workers | 14 | 28 | 33 | 30 | 20 | 15 | 13 | 7 |
The mean age of a combined group of men and women is 30 years. If the mean age of the group of men is that of the group of women is 27, find out the percentage of men and women in the group.
Calculate arithmetic mean of the following series. Take 15 as assumed average and use short cut method.
| Size | 20 | 19 | 18 | 17 | 16 | 15 | 14 | 13 | 12 |
| Frequency | 1 | 2 | 4 | 8 | 11 | 10 | 7 | 4 | 2 |
Find out the median from the following particulars:
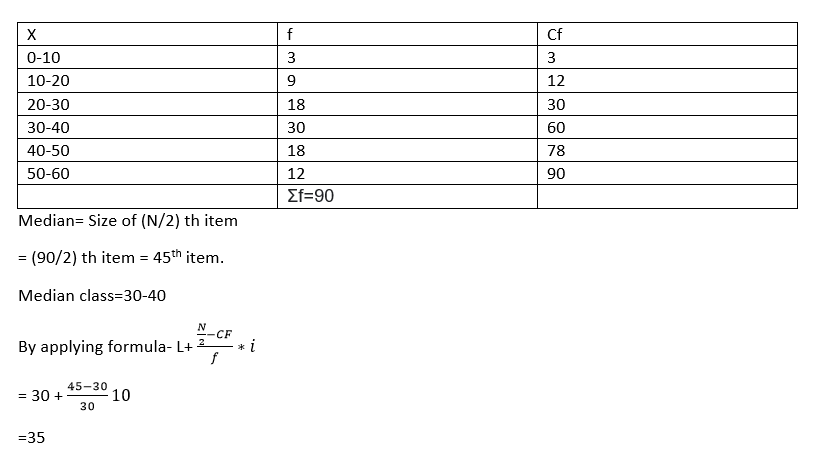
| Marks | 0-10 | 10-20 | 20-30 | 30-40 | 40-50 | 50-60 |
| No of students | 3 | 9 | 18 | 30 | 18 | 12 |
Calculate median from the following series-
| Class | 1-10 | 11-20 | 21-30 | 31-40 | 41-50 | 51-60 |
| Frequency | 4 | 15 | 20 | 10 | 8 | 5 |
Calculate median from the following:
CI | f |
0-10 | 2 |
10-20 | 4 |
20-30 | 6 |
30-40 | 2 |
40-50 | 4 |
50-60 | 2 |
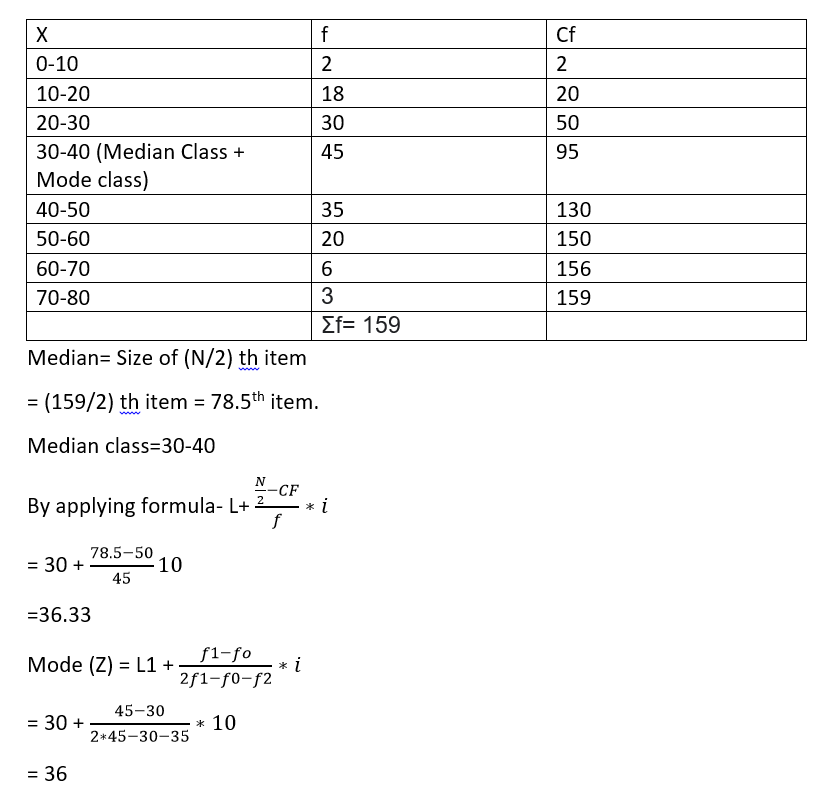
Calculate median and mode from the following data:
| Marks | 0-10 | 10-20 | 20-30 | 30-40 | 40-50 | 50-60 | 60-70 | 70-80 |
| No. of Students | 2 | 18 | 30 | 45 | 35 | 20 | 6 | 3 |
Calculate median from the following:
X | 10 | 20 | 30 | 40 | 60 | 70 |
f | 2 | 4 | 6 | 2 | 4 | 2 |
Calculate median of the following data:
Marks
No of students (f)
46-50
5
41-45
11
36-40
22
31-35
35
26-30
26
21-25
13
16-20
10
11-15
7
|
Marks |
No of students (f) |
| 46-50 |
5 |
| 41-45 | 11 |
| 36-40 | 22 |
| 31-35 | 35 |
| 26-30 | 26 |
| 21-25 | 13 |
| 16-20 | 10 |
| 11-15 | 7 |
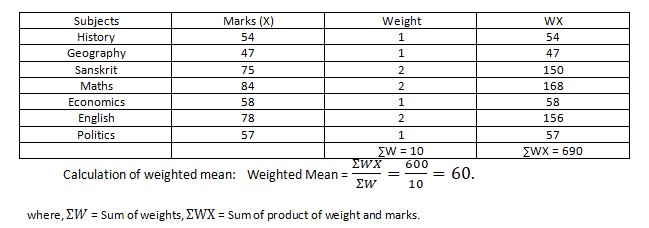
A candidate obtains the following percentage of marks:
Subjects | Marks |
History | 54 |
Geography | 47 |
Sanskrit | 75 |
Maths | 84 |
Economics | 58 |
English | 78 |
Politics | 57 |
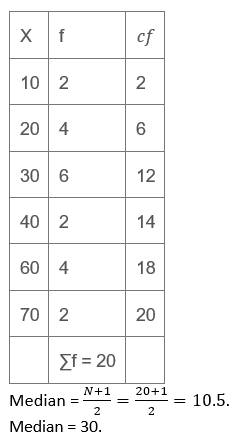
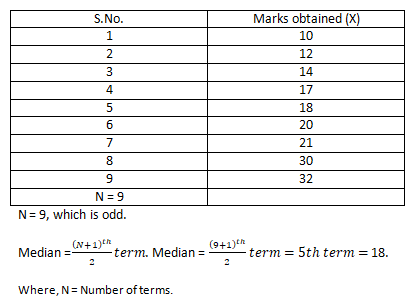
Calculate median from the following data:
S.No. | Marks obtained (X) |
1 | 10 |
2 | 12 |
3 | 14 |
4 | 17 |
5 | 18 |
6 | 20 |
7 | 21 |
8 | 30 |
9 | 32 |
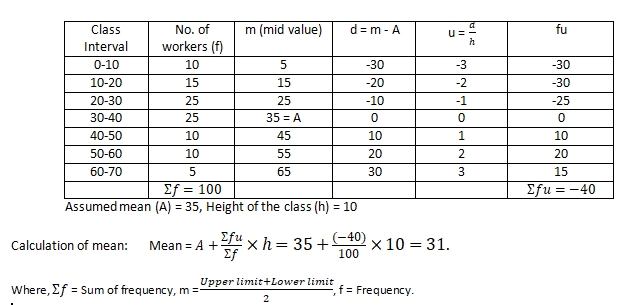
Calculate mean from the following data. (use step-deviation method).
Class Interval
No. of workers
0-10
10
10-20
15
20-30
25
30-40
25
40-50
10
50-60
10
60-70
5
|
Class Interval |
No. of workers |
|
0-10 |
10 |
|
10-20 |
15 |
|
20-30 |
25 |
|
30-40 |
25 |
|
40-50 |
10 |
|
50-60 |
10 |
|
60-70 |
5 |
Calculate the weighted mean of the following distribution:
| Items | 12 | 29 | 14 | 41 |
| Weight | 6 | 4 | 5 | 2 |
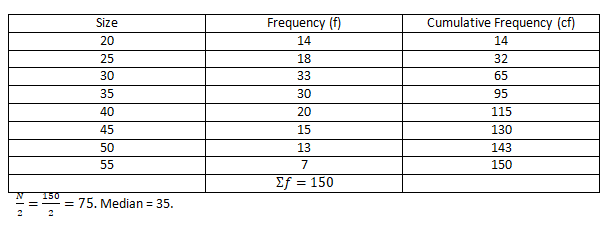
Find out median of the following series:
Size
Frequency
20
14
25
18
30
33
35
30
40
20
45
15
50
13
55
7
|
Size |
Frequency |
|
20 |
14 |
|
25 |
18 |
|
30 |
33 |
|
35 |
30 |
|
40 |
20 |
|
45 |
15 |
|
50 |
13 |
|
55 |
7 |
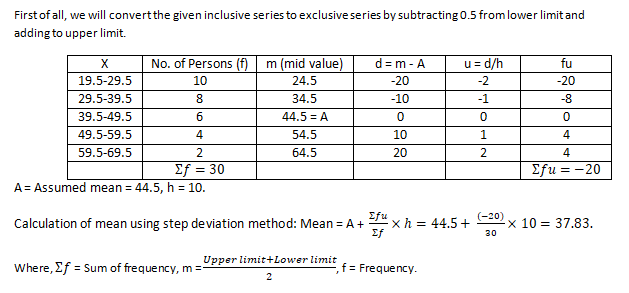
Calculate mean by step-deviation method from the following data:
X
No. of Persons
20-29
10
30-39
8
40-49
6
50-59
4
60-69
2
|
X |
No. of Persons |
|
20-29 |
10 |
|
30-39 |
8 |
|
40-49 |
6 |
|
50-59 |
4 |
|
60-69 |
2 |
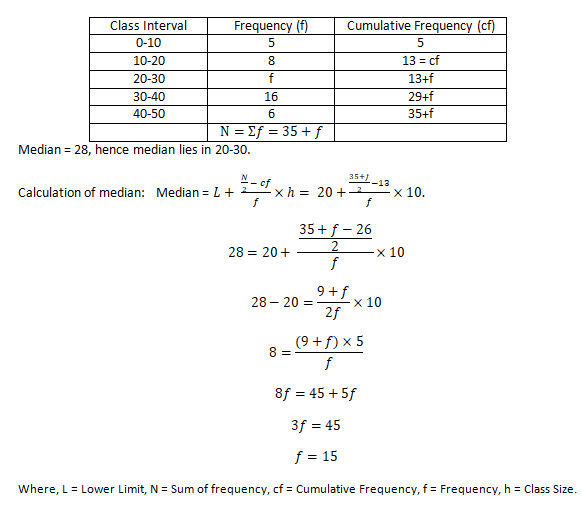
Find out the missing frequency of the group 20 - 30, when the median is 28.
Class Interval | Frequency |
0-10 | 5 |
10-20 | 8 |
20-30 | ? |
30-40 | 16 |
40-50 | 6 |
Calculate the median.
Age
Number
15-19
4
20-24
20
25-29
38
30-34
24
35-39
10
40-44
4
|
Age |
Number |
|
15-19 |
4 |
|
20-24 |
20 |
|
25-29 |
38 |
|
30-34 |
24 |
|
35-39 |
10 |
|
40-44 |
4 |
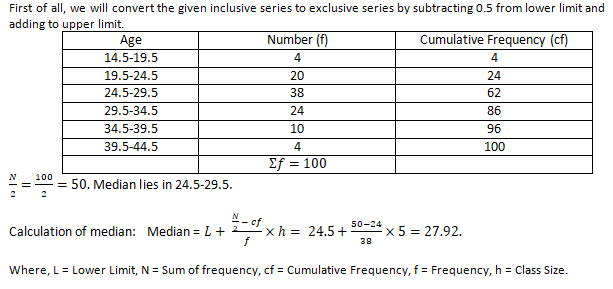
Find out the Arithmetic mean from the following data by direct method:
|
Runs scored |
No. of matches |
|
0-20 |
2 |
|
20-40 |
4 |
|
40-60 |
6 |
|
60-80 |
4 |
|
80-100 |
2 |

Calculate arithmetic mean of the following series. Take 15 as assumed average and use Short-cut Method.
Size
Frequency
20
1
19
2
18
4
17
8
16
11
15
10
14
7
13
4
12
2
11
1
|
Size |
Frequency |
|
20 |
1 |
|
19 |
2 |
|
18 |
4 |
|
17 |
8 |
|
16 |
11 |
|
15 |
10 |
|
14 |
7 |
|
13 |
4 |
|
12 |
2 |
|
11 |
1 |

Calculate arithmetic mean using Direct Method.
Marks
Number of Students
4
12
5
10
6
18
7
20
8
24
|
Marks |
Number of Students |
|
4 |
12 |
|
5 |
10 |
|
6 |
18 |
|
7 |
20 |
|
8 |
24 |

In a science test given to a group of students, the marks scored by them(out of 100) are: 41, 39, 52, 48, 54, 62, 46, 52, 40, 96, 42, 40, 98, 60, 52. Find the mean of the marks.
The following table gives height of certain persons:
Height (inches)
Number of Persons
57
1
59
3
61
7
63
10
65
11
67
15
69
10
71
7
73
2
|
Height (inches) |
Number of Persons |
|
57 |
1 |
|
59 |
3 |
|
61 |
7 |
|
63 |
10 |
|
65 |
11 |
|
67 |
15 |
|
69 |
10 |
|
71 |
7 |
|
73 |
2 |

In a science test given to a group of students, the marks scored by them(out of 100) are: 41, 39, 52, 48, 54, 62, 46, 52, 40, 96, 42, 40, 98, 60, 52.
Find the median of the marks.
Calculate the median from the following-
| Marks | Frequency |
| Less than 10 | 5 |
| Less than 20 | 20 |
| Less than 30 | 45 |
| Less than 40 | 80 |
| Less than 50 | 100 |
| Less than 60 | 115 |
| Less than 70 | 125 |
| Less than 80 | 130 |
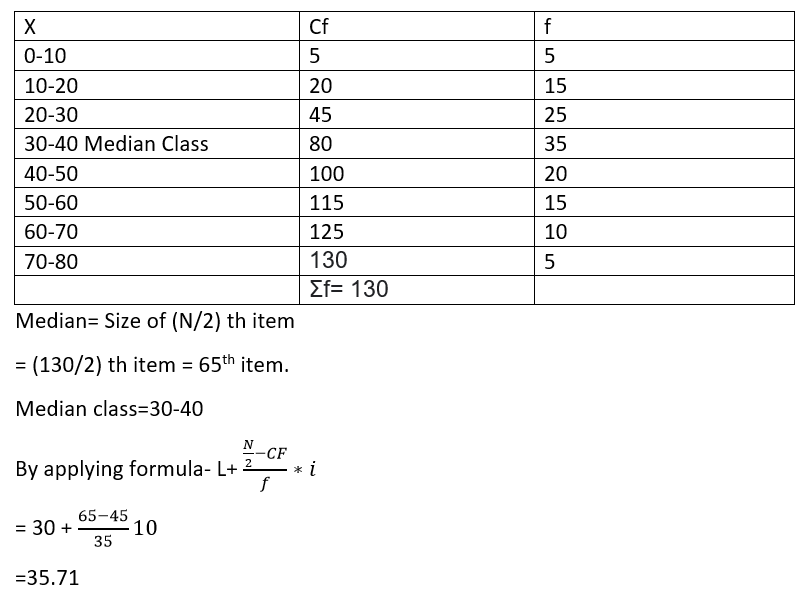
Following is the number of heads of 8 coins when tossed 205 times:
|
Number of Heads |
Frequency |
|
0 |
2 |
|
1 |
19 |
|
2 |
46 |
|
3 |
62 |
|
4 |
47 |
|
5 |
20 |
|
6 |
5 |
|
7 |
2 |
|
8 |
2 |

Calculate median from the following data-
| Mid-Value | 20 | 30 | 40 | 50 | 60 | 70 |
| Male (Cf) | 12 | 25 | 42 | 46 | 48 | 50 |
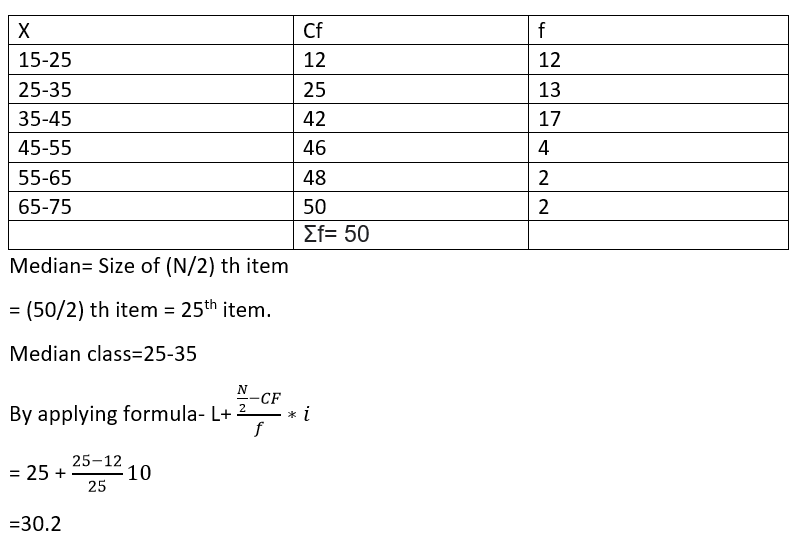
Following is the number of heads of 8 coins when tossed 205 times:
Number of Heads (X) | Frequency (f) |
0 | 2 |
1 | 19 |
2 | 46 |
3 | 62 |
4 | 47 |
5 | 20 |
6 | 5 |
7 | 2 |
8 | 2 |

Calculate mean using step deviation method from the following information:
|
Class Interval |
Frequency |
|
0-5 |
15 |
|
5-10 |
10 |
|
10-15 |
11 |
|
15-20 |
12 |
|
20-25 |
6 |
|
25-30 |
6 |
|
30-35 |
10 |
|
35-40 |
15 |
|
40-45 |
10 |
|
45-50 |
5 |

If the arithmetic mean of the data given below is 52, find the missing frequency:
|
Class Interval |
No. of Students |
|
10-20 |
5 |
|
20-30 |
3 |
|
30-40 |
4 |
|
40-50 |
7 |
|
50-60 |
f |
|
60-70 |
6 |
|
70-80 |
13 |

Read the following news report and answer on the basis of the same: For an examination, 60 students of a school appeared. Marks obtained by the 12 students were 25 each. The number of students who scored 20 and 5 each was three more than the students who scoredAlso, 8 students who scored 10 marks each. The students who scored 15 marks each were half the students who scored 10 each and remaining students had scored 30 each. Answer the following question: The value of median will be ____________________.
Find Arithmetic Mean of the following distribution using
Step Deviation Method (Assume mean = 27.5).
Size (in cm.)
No. of Items
10-15
2
15-20
8
20-25
20
25-30
35
30-35
20
35-40
15
|
Size (in cm.) |
No. of Items |
|
10-15 |
2 |
|
15-20 |
8 |
|
20-25 |
20 |
|
25-30 |
35 |
|
30-35 |
20 |
|
35-40 |
15 |

Find out median:
X | f |
2 | 3 |
4 | 5 |
6 | 12 |
8 | 10 |
10 | 5 |

Calculate mean from the following data:
|
Marks |
No. Of students |
|
0-20 |
8 |
|
20-40 |
12 |
|
40-60 |
30 |
|
60-80 |
20 |
|
80-100 |
10 |

Following are the wages of 19 workers.
| Wages | 10 | 20 | 30 | 40 | 50 |
| Number of workers | 4 | 5 | 3 | 2 | 5 |
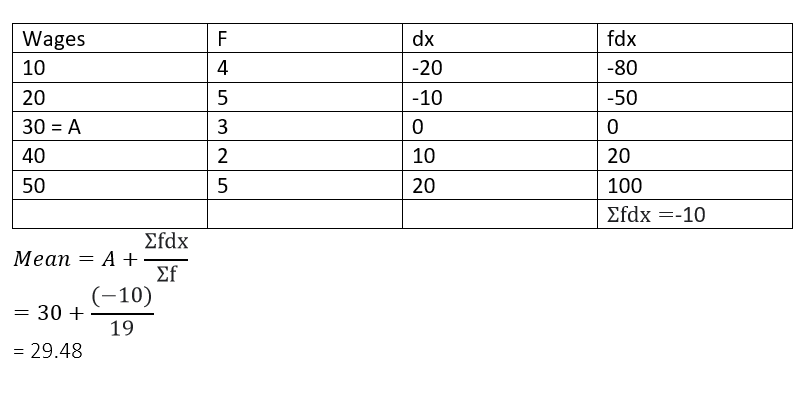
Calculate median from the following data:
Size
Frequency
20
14
25
18
30
33
35
30
40
20
45
15
50
13
55
7
|
Size |
Frequency |
|
20 |
14 |
|
25 |
18 |
|
30 |
33 |
|
35 |
30 |
|
40 |
20 |
|
45 |
15 |
|
50 |
13 |
|
55 |
7 |

Calculate arithmetic mean from the following data:
Marks | No. of Students |
0-10 | 2 |
10-20 | 7 |
20-30 | 10 |
30-40 | 15 |
40-50 | 20 |
50-60 | 16 |
60-70 | 6 |
70-80 | 4 |

Calculate the arithmetic mean for the following data using step deviation method.
| Marks | $$0-10$$ | $$10-20$$ | $$20-30$$ | $$30-40$$ | $$40-50$$ | $$50-60$$ |
| No. of students | $$8$$ | $$15$$ | $$22$$ | $$20$$ | $$10$$ | $$5$$ |
The ages of children in a scout camp are $$13, 13, 14, 15, 13, 15, 14, 15, 13, 15$$ years. Find the mean, median and mode of the data.
The total marks obtained by $$40$$ students in the Annual examination are given below
| Marks | $$150-200$$ | $$200-250$$ | $$250-300$$ | $$300-350$$ | $$350-400$$ | $$400-450$$ | $$450-500$$ |
| Students | $$2$$ | $$3$$ | $$12$$ | $$10$$ | $$4$$ | $$6$$ | $$3$$ |
Find the median of the following data.
(i) $$18, 12, 51, 32, 106, 92, 58$$
(ii) $$28, 7, 15, 3, 14, 18, 46, 59, 1, 2, 9, 21$$
In a retail market , fruit vendors were selling mangoes kept in packed boxes. These boxes contained different number of mangoes. The following was the distribution of mangoes according to the number of boxes ?
| Number of mangoes | $$50-52$$ | $$53-55$$ | $$56-58$$ | $$59-61$$ | $$62-64$$ |
| Number of boxes | $$15$$ | $$110$$ | $$135$$ | $$115$$ | $$25$$ |
The mean of the following frequency table is $$57.6$$. But the frequencies $$f_1$$ and $$f_2$$ are missing. Find the value of missing frequencies $$f_1$$ and $$f_2$$.
| Class Interval | $$0-20$$ | $$20-40$$ | $$40-60$$ | $$60-80$$ | $$80-100$$ | $$100-120$$ | Total |
| Frequency | $$7$$ | $$f_1$$ | $$12$$ | $$f_2$$ | $$8$$ | $$5$$ | $$50$$ |
Find the mean of the following frequency distribution:
| Marks obtained | Number of students |
| 10-20 | $$6$$ |
| 20-30 | $$8$$ |
| 30-40 | $$13$$ |
| 40-50 | $$7$$ |
| 50-60 | $$3$$ |
| 60-70 | $$2$$ |
| 70-80 | $$1$$ |
Candidates of four schools appear in a mathematics test. The data were as follows.
| Schools | No. of candidates | Average Score. |
| I | $$60$$ | $$75$$ |
| II | $$48$$ | $$80$$ |
| III | Not available | $$55$$ |
| IV | $$40$$ | $$50$$ |
Below is the distribution of money collected
by students for flood relief.
| Money | No. of student |
| 0-10 10-20 20-30 30-40 40-50 | 5 2 6 5 7 |

a) Find the mean median and mode of $$20,15,25,7,25,17,5$$
b) Construct a right angled triangle $$PQR$$ such that $$\angle Q=90^{o}\ PQ=6cm$$, hypotenuse $$PR=7cm$$
c) The daily wages of $$5$$ person is given below:
| Wages | $$300$$ | $$150$$ | $$200$$ | $$250$$ | $$350$$ |
| Persons | $$A$$ | $$B$$ | $$C$$ | $$D$$ | $$E$$ |
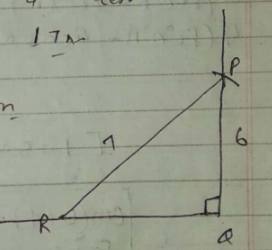
Find the mean deviation about the median for the following continuous distribution:
| Marks obtained | 0-10 | 10-20 | 20-30 | 30-40 | 40-50 | 50-60 |
| No. of body | 6 | 8 | 14 | 16 | 4 | 2 |
The following distribution represents the number of books issued at the counter of a ecommerce college library on $$200$$ different days :
Calculate lower and upper quartile for above data.
| No. of books issued | $$80$$ | $$100$$ | $$120$$ | $$145$$ | $$200$$ | $$280$$ | $$310$$ | $$380$$ | $$400$$ | $$410$$ |
| No. of days | $$15$$ | $$18$$ | $$25$$ | $$27$$ | $$40$$ | $$25$$ | $$19$$ | $$16$$ | $$8$$ | $$7$$ |
The mean of the following distribution is $$50$$. Find a.
| x | $$10$$ | $$30$$ | $$50$$ | $$70$$ | $$90$$ |
| y | $$17$$ | $$5a+3$$ | $$32$$ | $$7a-11$$ | $$18$$ |
The mean of five numbers isIf one number is excluded, their mean isFind the excluded number.
The age (in years) of $$12$$ persons are given below.
$$42,48,48,50,56,43,47,56,60,65,56,65$$. Find the mode.
Given below are the daily wages of $$200$$ workers in a factory :
| Daily Wages (in Rs.) | $$240-300$$ | $$300 - 360$$ | $$360 - 420$$ | $$420 - 480$$ | $$480 - 540$$ |
| Number of Workers | $$20$$ | $$30$$ | $$20$$ | $$40$$ | $$90$$ |
Find the arithmetic mean using the assumed-mean method:
| Class interval | 100-120 | 120-140 | 140-160 | 160-180 | 180-200 |
| Frequency | 10 | 20 | 30 | 15 | 5 |
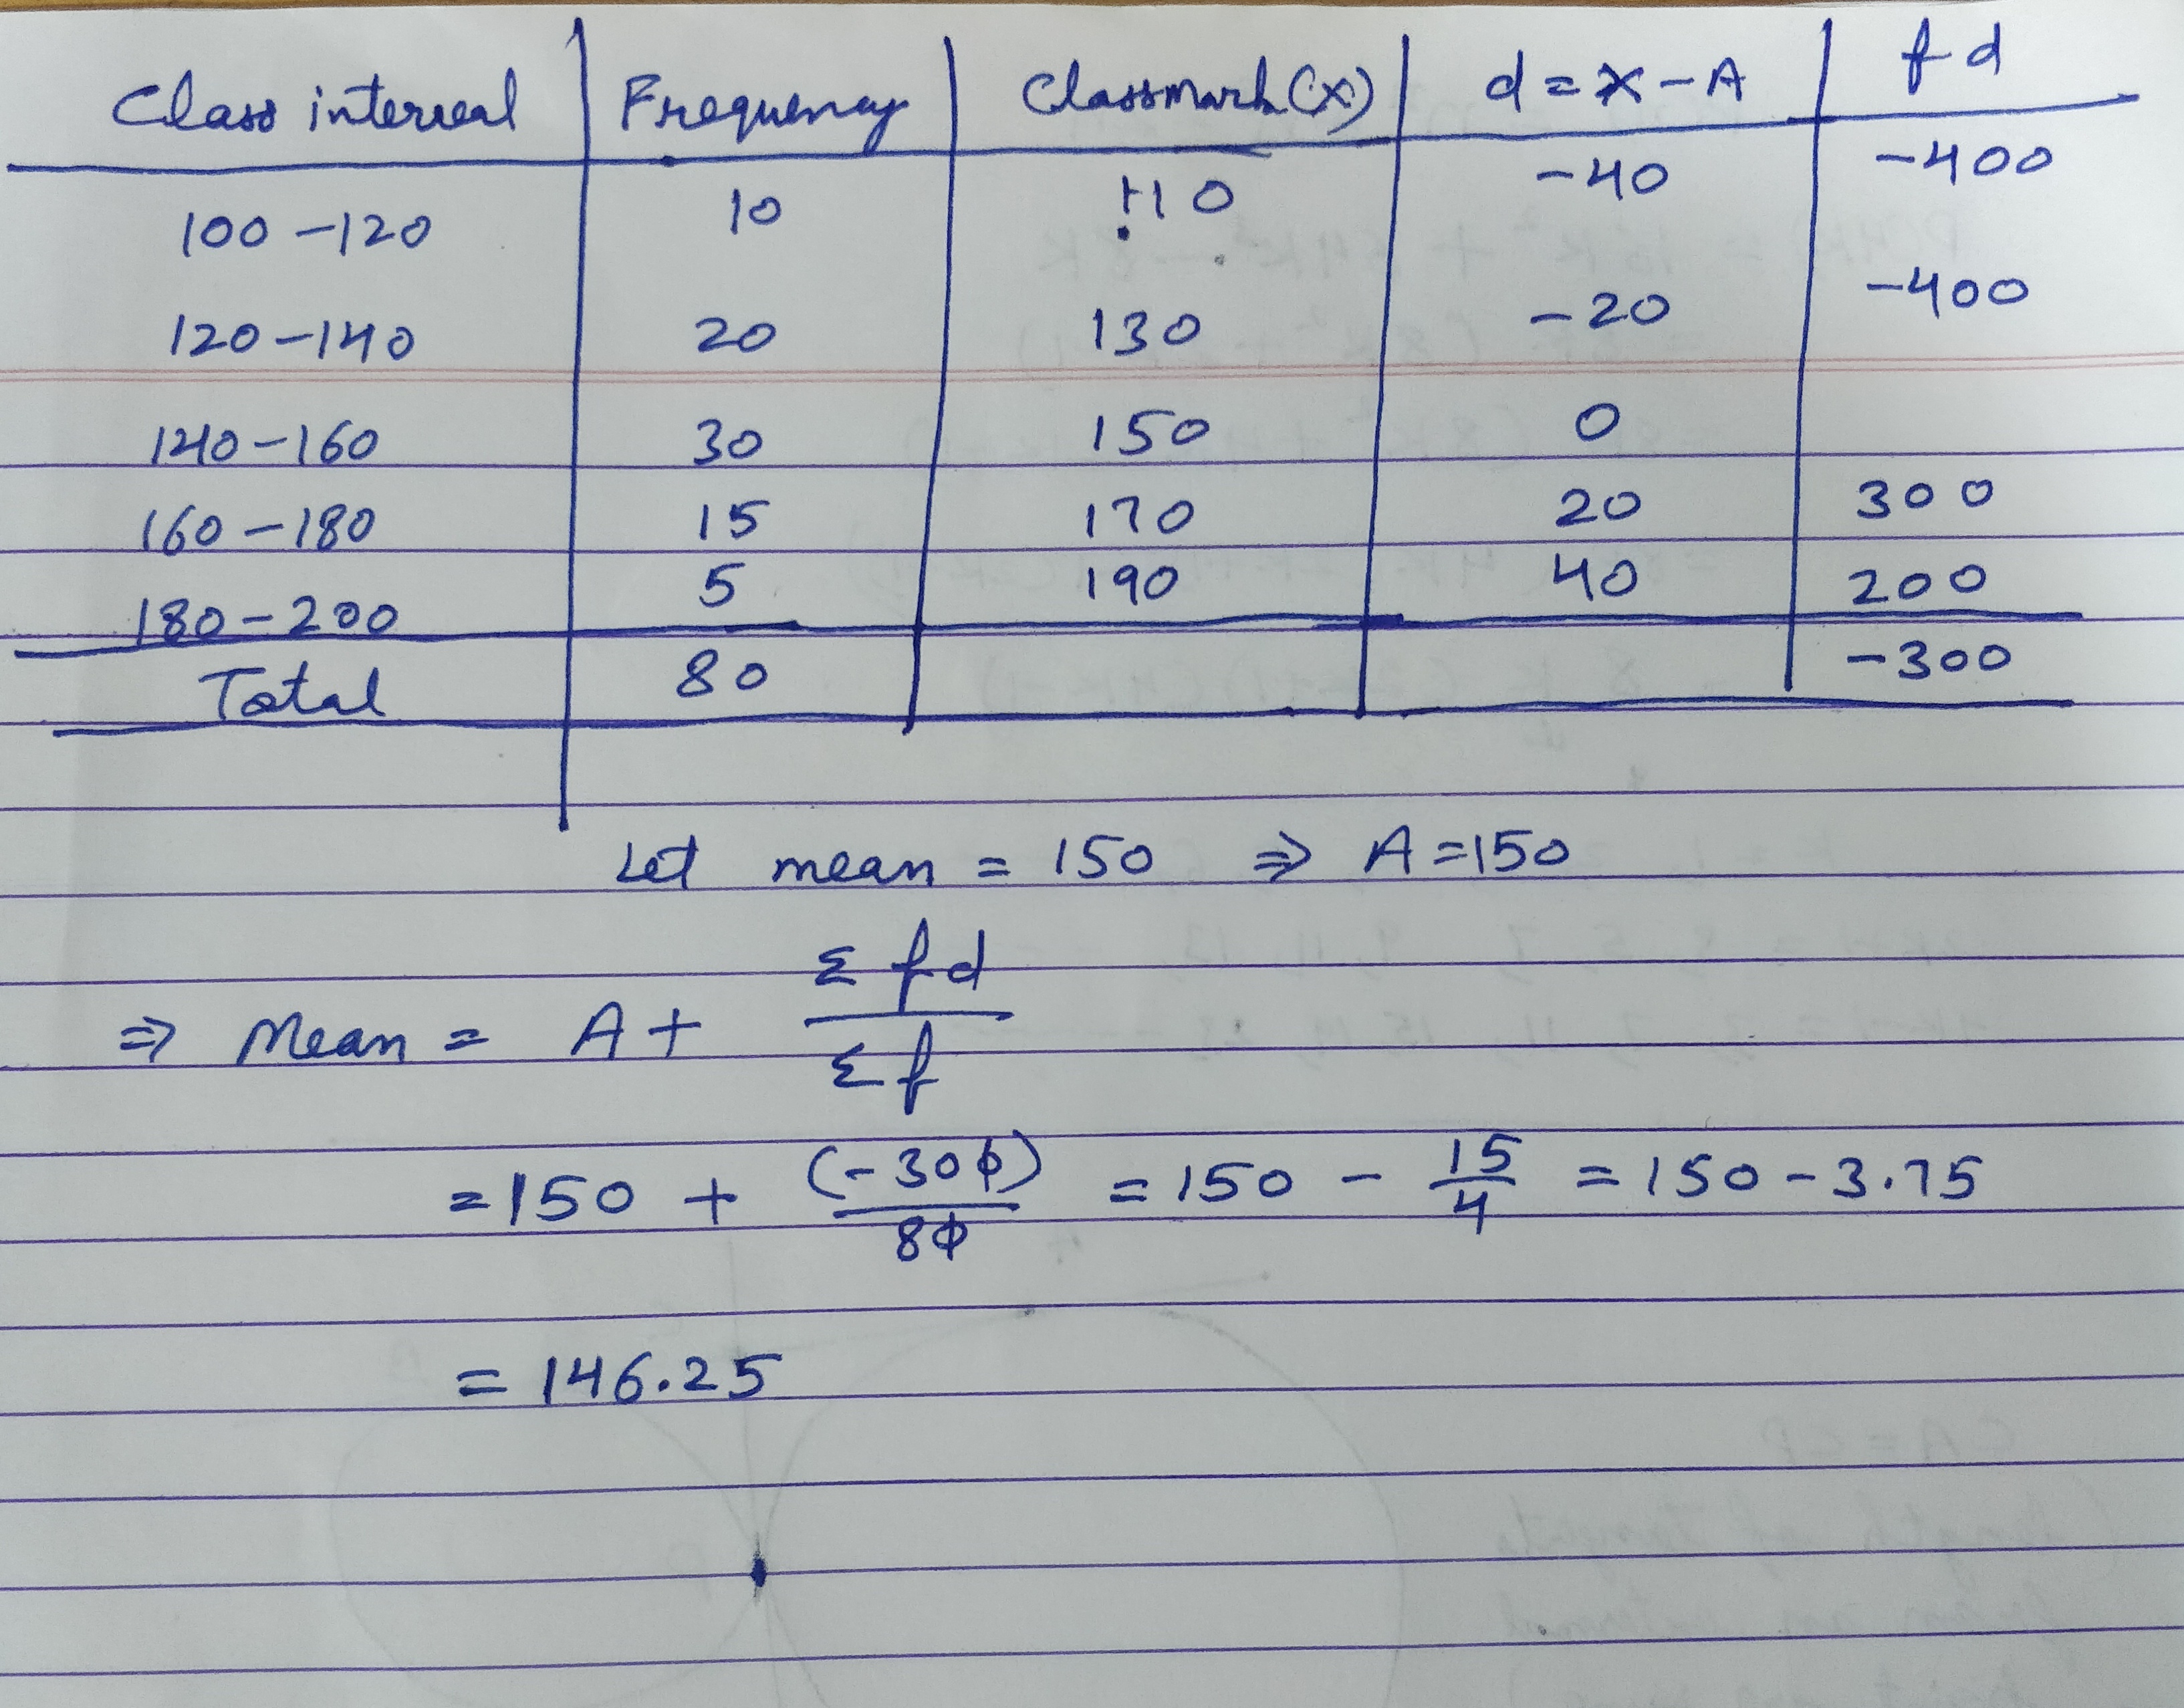
Find the mean age from the following distribution:
| $$Age(in years)$$ | $$25-29$$ | $$30-34$$ | $$35-39$$ | $$40-44$$ | $$45-49$$ | $$50-54$$ | $$55-59$$ |
| $$No. of persons$$ | $$4$$ | $$14$$ | $$22$$ | $$16$$ | $$6$$ | $$5$$ | $$3$$ |
The mean weight of 8 numbers isIf each number is multiplied by 2, what will be the new mean?
In the following table, the information is given about the number of families and the siblings in the families less than $$14$$ years of age. Find the mode of the data.
No. of siblings | 1 | 2 | 3 | 4 |
Families | 15 | 25 | 5 | 5 |
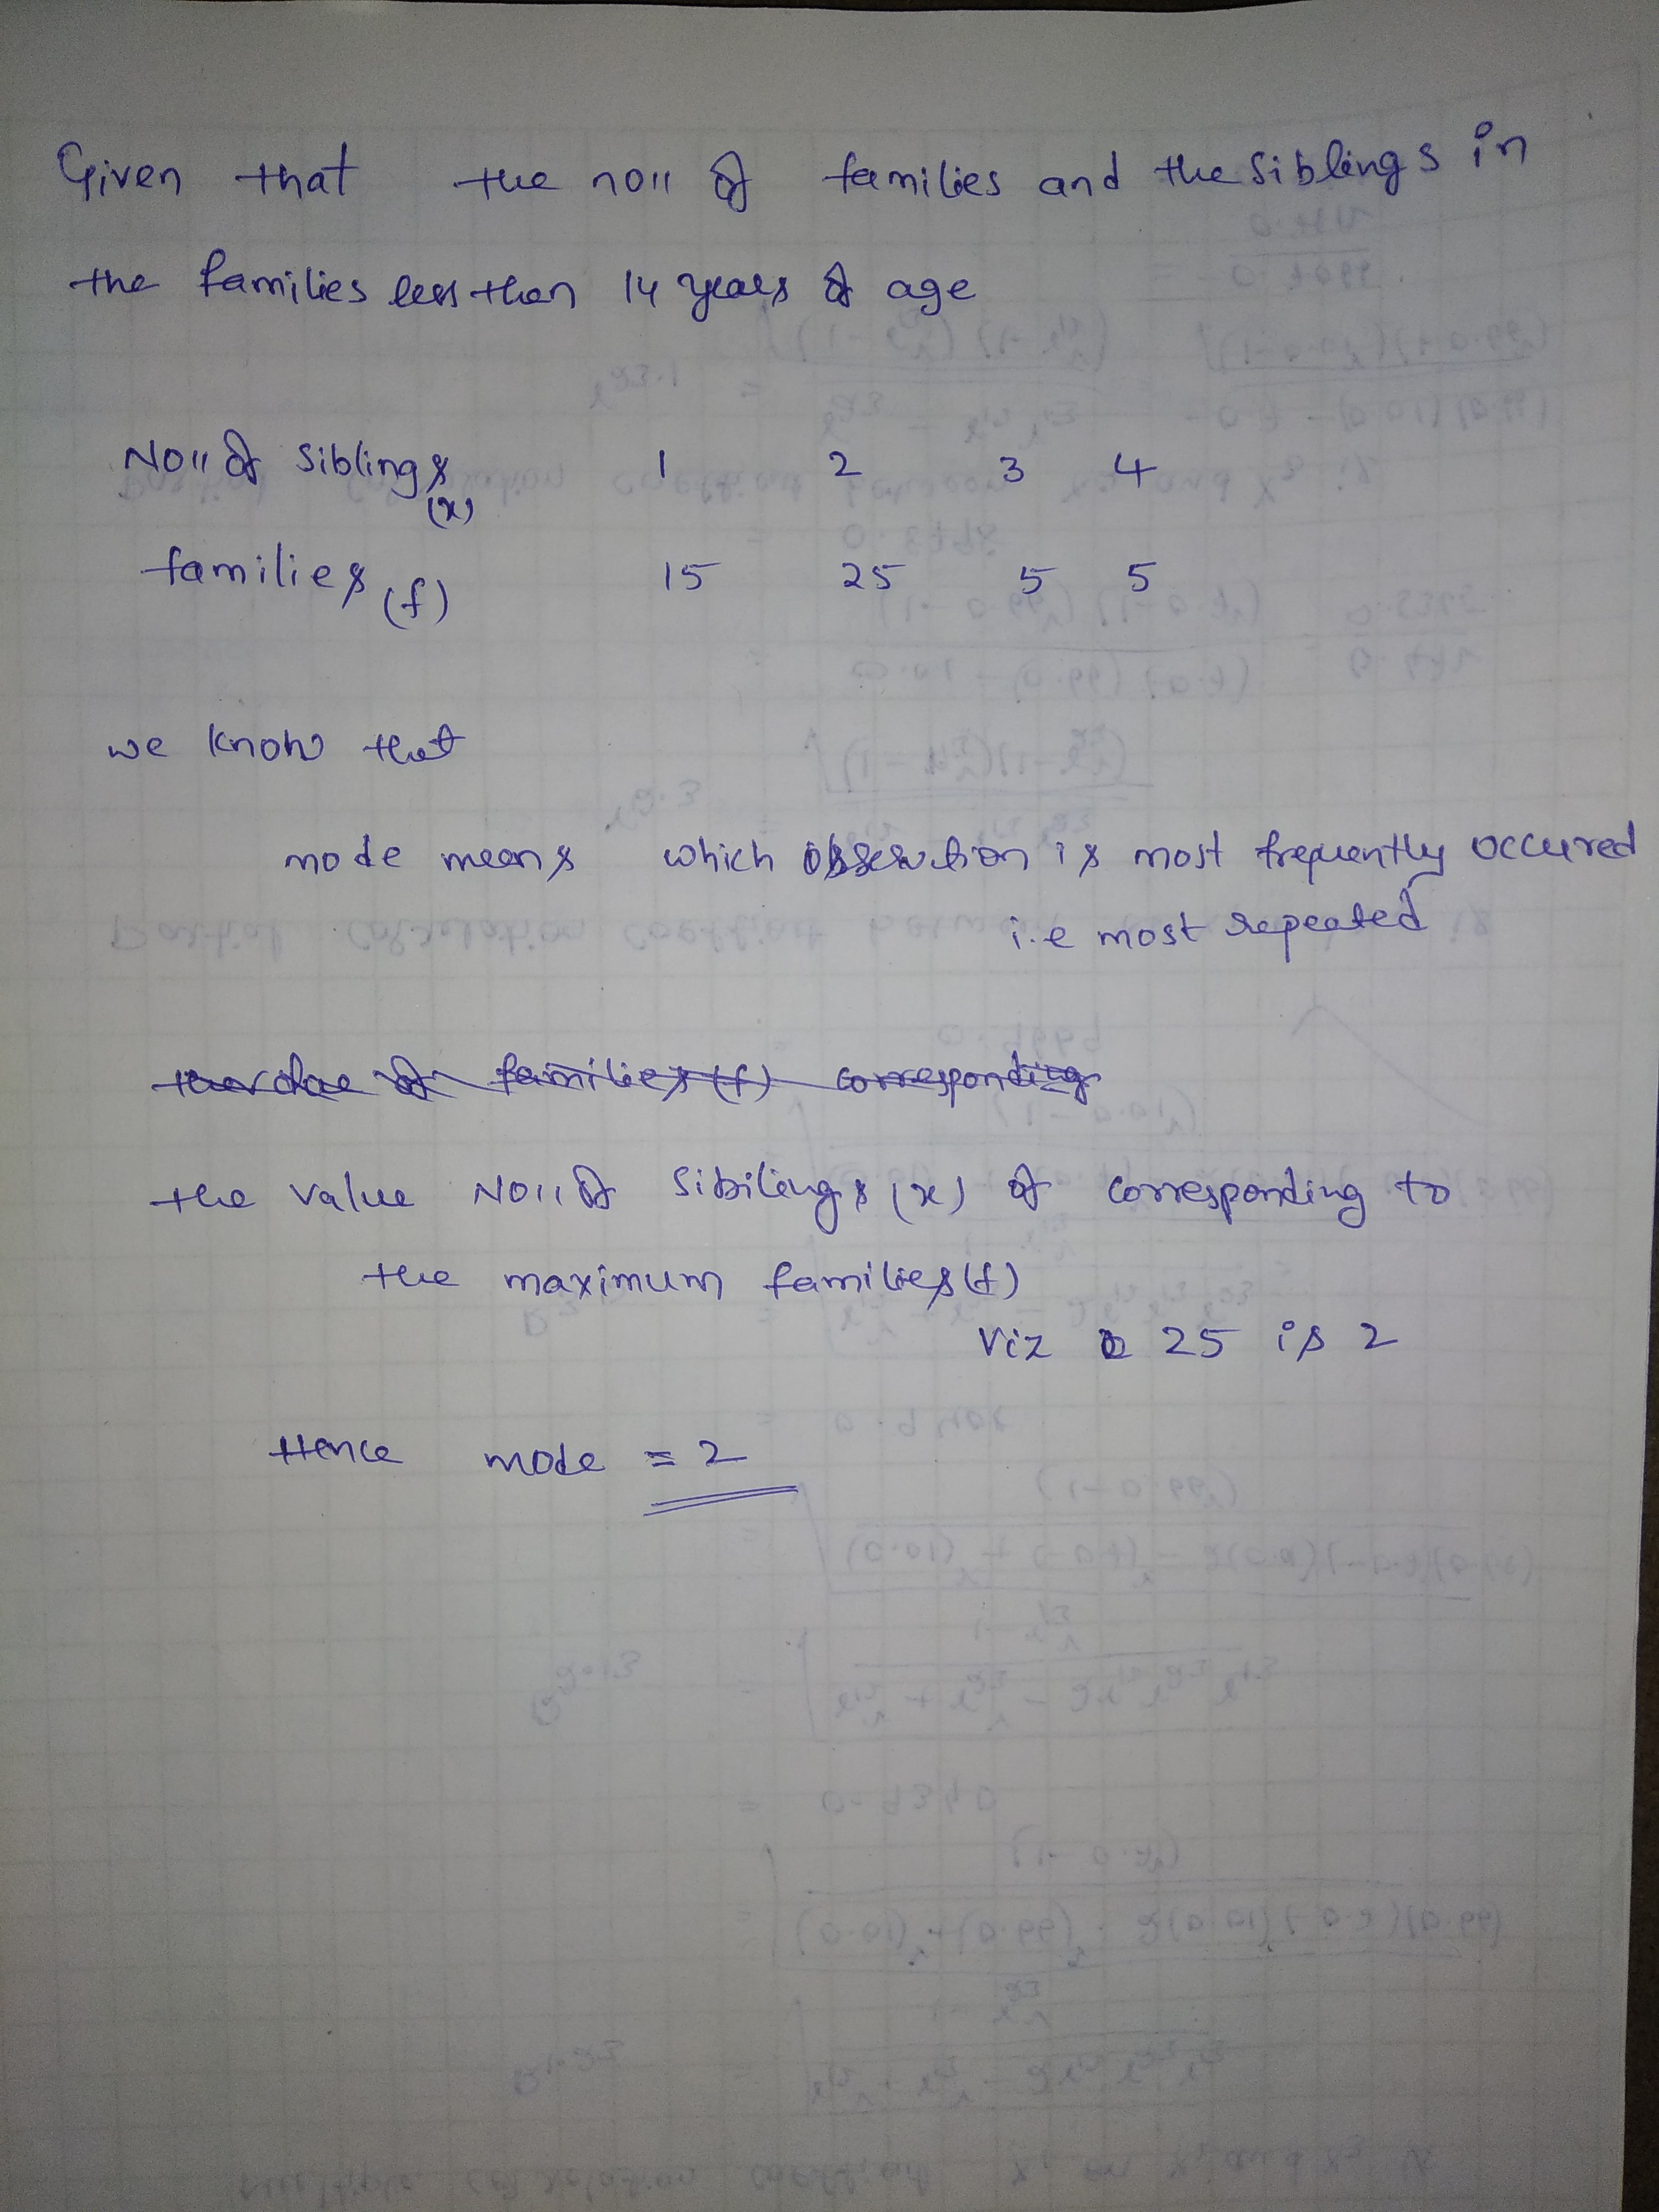
Find the sum of the deviations of the variate values 3,4,6,7,8,14 from their mean.
The following observation have been arranged in ascending order. If the median of the data is 63, find the value of x:
29, 32, 48, 50, x, x+2, 72, 78, 84, 95
Find the median of the following data
$$83,37,70,29,45,63,41,70,34,54$$
Find the value of p for the following distribution whose mean is 16.6.
| x : | 8 | 12 | 15 | p | 20 | 25 | 30 |
| f : | 12 | 16 | 20 | 24 | 16 | 8 | 4 |
Find the median of the following data
133, 73, 89, 108, 94, 104, 94, 85, 100, 120
Find the median of the following data
83, 37, 70, 29, 45, 63, 41, 70, 34, 54
Numbers 50, 42, 35, 2x+10, 2x -8, 12, 11, 8 are written in descending order and their median is 25, find x.
If the mean of the following data is 15, find p.
| x : | 5 | 10 | 15 | 20 | 25 |
| f : | 6 | p | 6 | 10 | 5 |
The weights (in kg ) of 15 students are : 31, 35, 27, 29, 32, 43, 37, 41, 34, 28, 36, 44, 45, 42,Find the median. If the weight 44 kg is replaced by 46 kg and 27 kg by 25 kg, find the new median. If the first answer is 35 then the second answer will be_________
Find the median of the following data
92, 35, 67, 85, 72, 81, 56, 51, 42, 69
Find the median of the following data : 41, 43, 127, 99, 61, 92, 71, 58,If 58 is replaced by 85, what will be the new median? If the first answer is 61, then the second answer will be______
Find the median of the following data
$$133,73,89,108,94,104,94,85,100,120$$
Numbers $$50,42,35,2x+10,2x-8,12,11,8,6$$ are written in descending order and their median is 25, find $$x.$$
Find the median of the following data: $$41,43,127,99,61,92,71,58,57,$$ If 58 is replaced by 85, what will be the new median? If the old median was 61, then what's the new median?
Find the median of the following data
$$31,38,27,28,36,25,35,40$$
Find the median of the following observations: $$46,64,87,41,58,77,35,90,55,92,33$$. If 92 is replaced by 99 and 41 by 43 in the above data, find the new median? If the first answer is 58, then the second answer is ______
Find the median of the following data
$$92,35,67,85,72,81,56,51,42,69$$
Find the median of the following data
$$25,34,31,23,22,26,35,29,20,32$$
Find the median of the following data
$$12,17,3,14,5,8,7,15$$
Find the median of the following data
$$41,43,127,99,71,92,71,58,57$$
Find the median of the following data
$$15,6,16,8,22,21,9,18,25$$
The following observations have been arranged in ascending order. If the median of the data is 63, find the value of x: $$29,32,48,50,x,x+2,72,78,84,95$$
The maximum bowling speeds, in km per hour, of 33 players at a cricket coaching centre are give as follows:
| Speed (km/h) | 85-100 | 100-115 | 115-130 | 130-145 |
| Number of players | 11 | 9 | 8 | 5 |
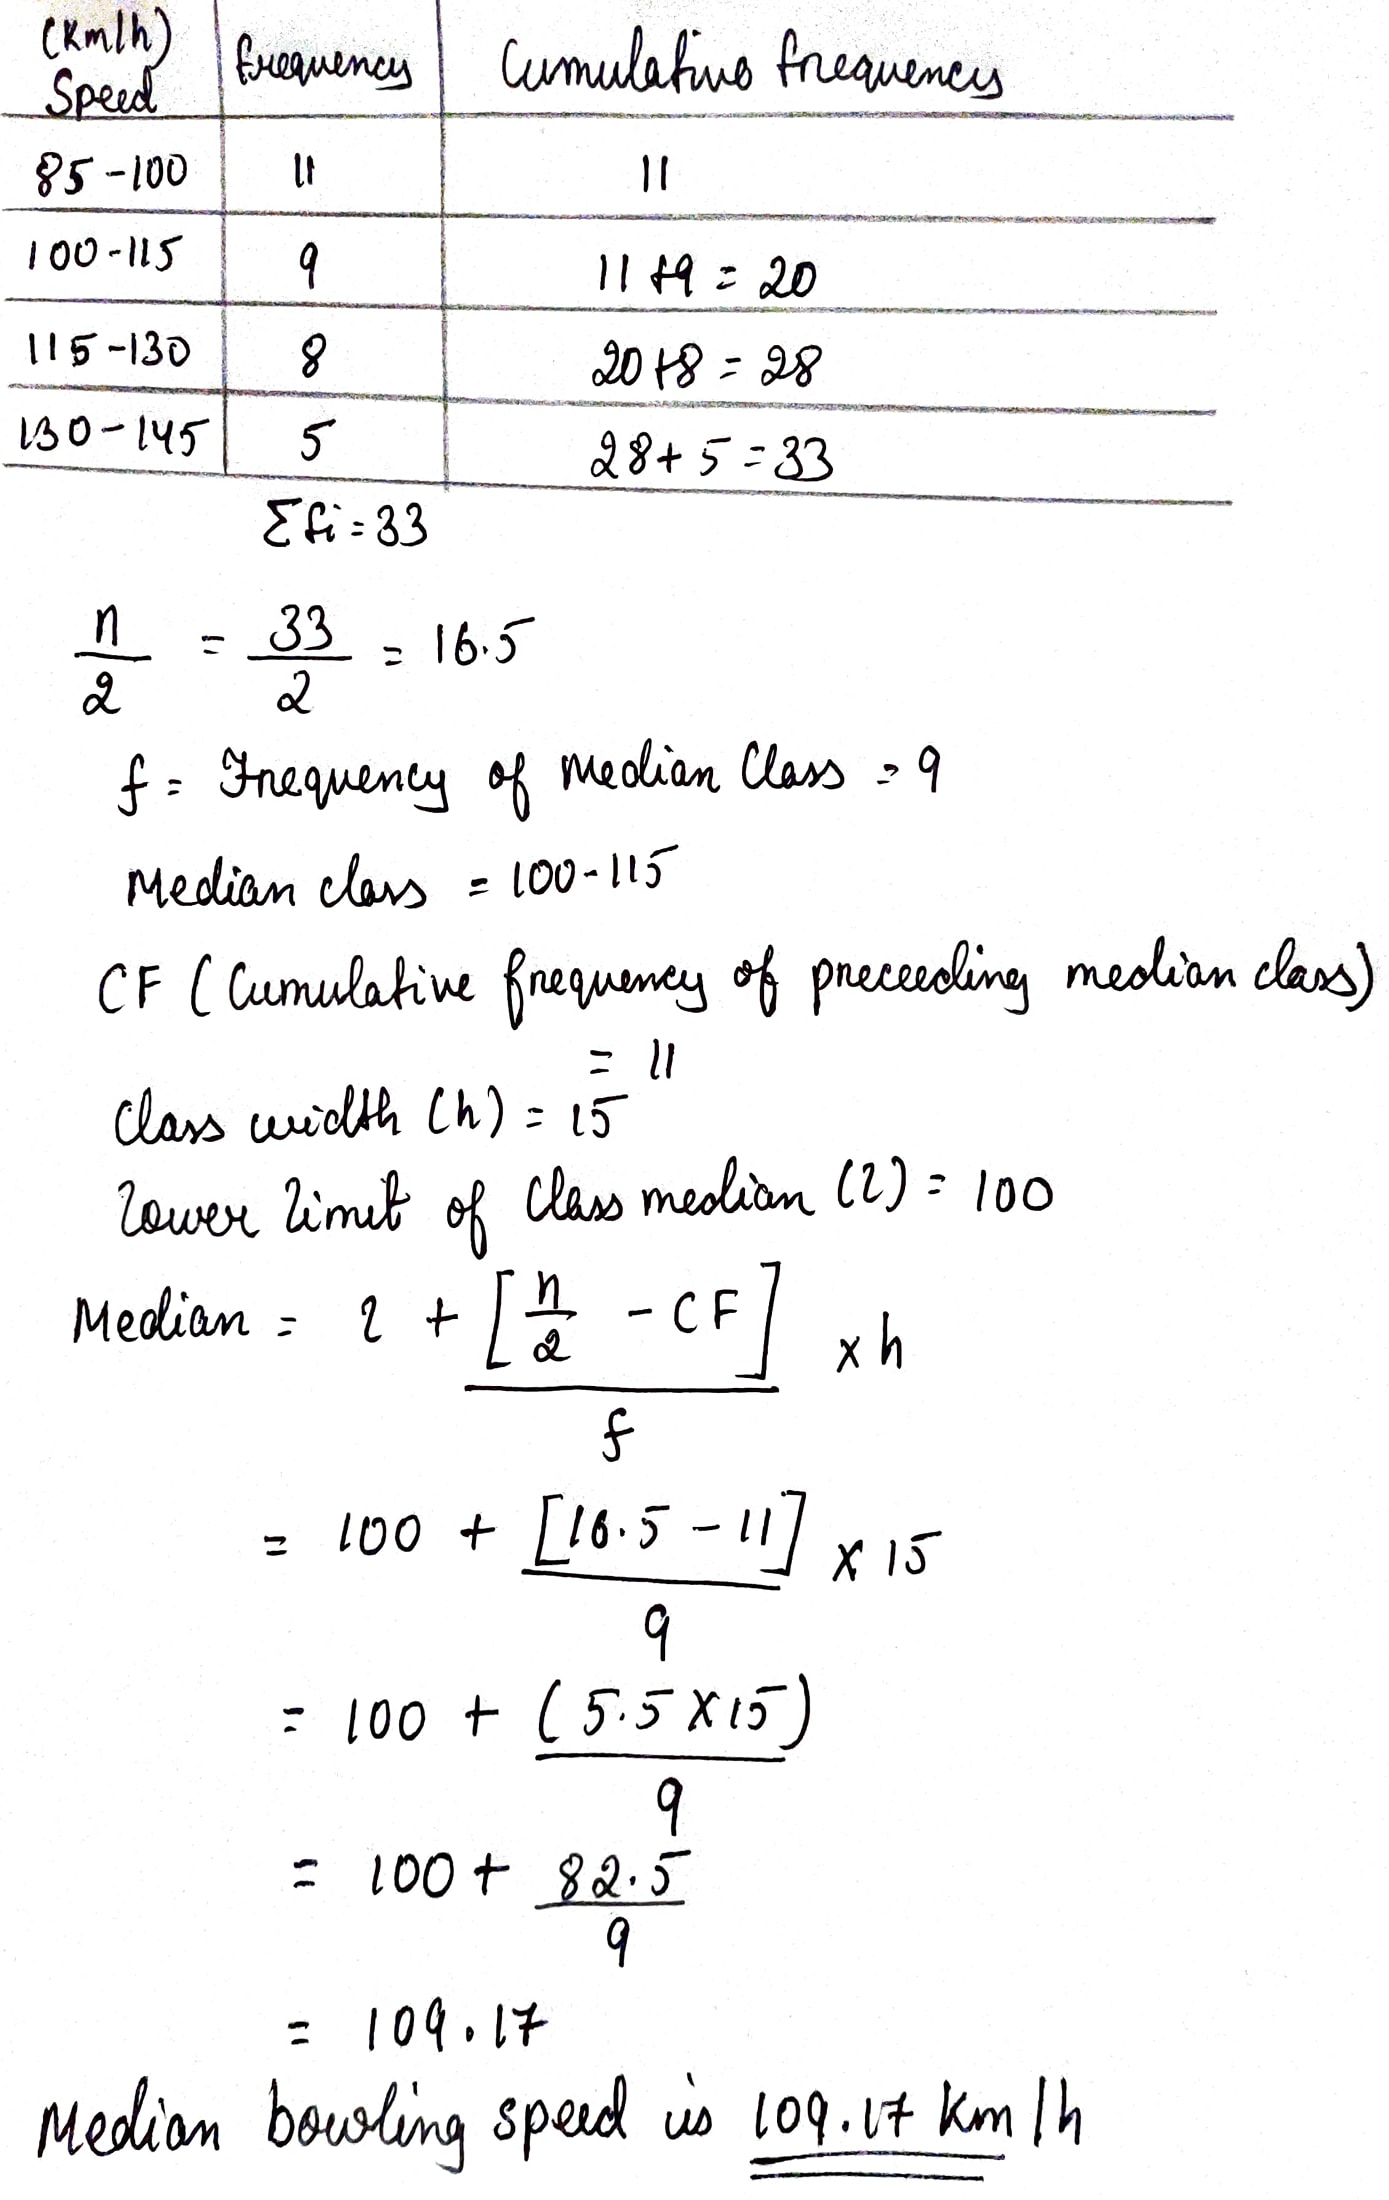
Find the value of median from the data given below:
Weight (kg)
No. of Students
93-97
3
98-102
5
103-107
12
108-112
17
113-117
14
118-122
6
123-127
3
128-132
1
|
Weight (kg) |
No. of Students |
|
93-97 |
3 |
|
98-102 |
5 |
|
103-107 |
12 |
|
108-112 |
17 |
|
113-117 |
14 |
|
118-122 |
6 |
|
123-127 |
3 |
|
128-132 |
1 |
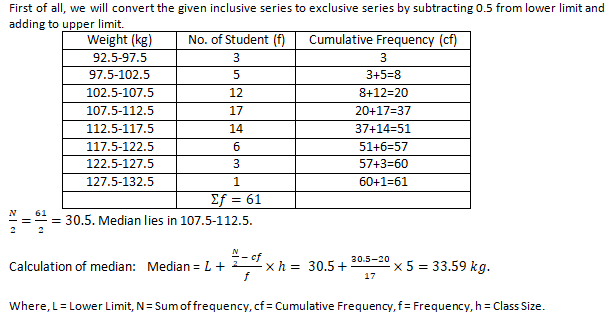
The mean weight of 8 numbers is 15 kg. If each number is multiplied by 2, what will be the new mean weight? (in kg)
The scores in mathematics test (out of 25) of 15 students are as follows:
$$19,25,23,20,9,20,15,10,5,16,25,20,24,12,20$$
Find the mode and median of this data. Are they same?
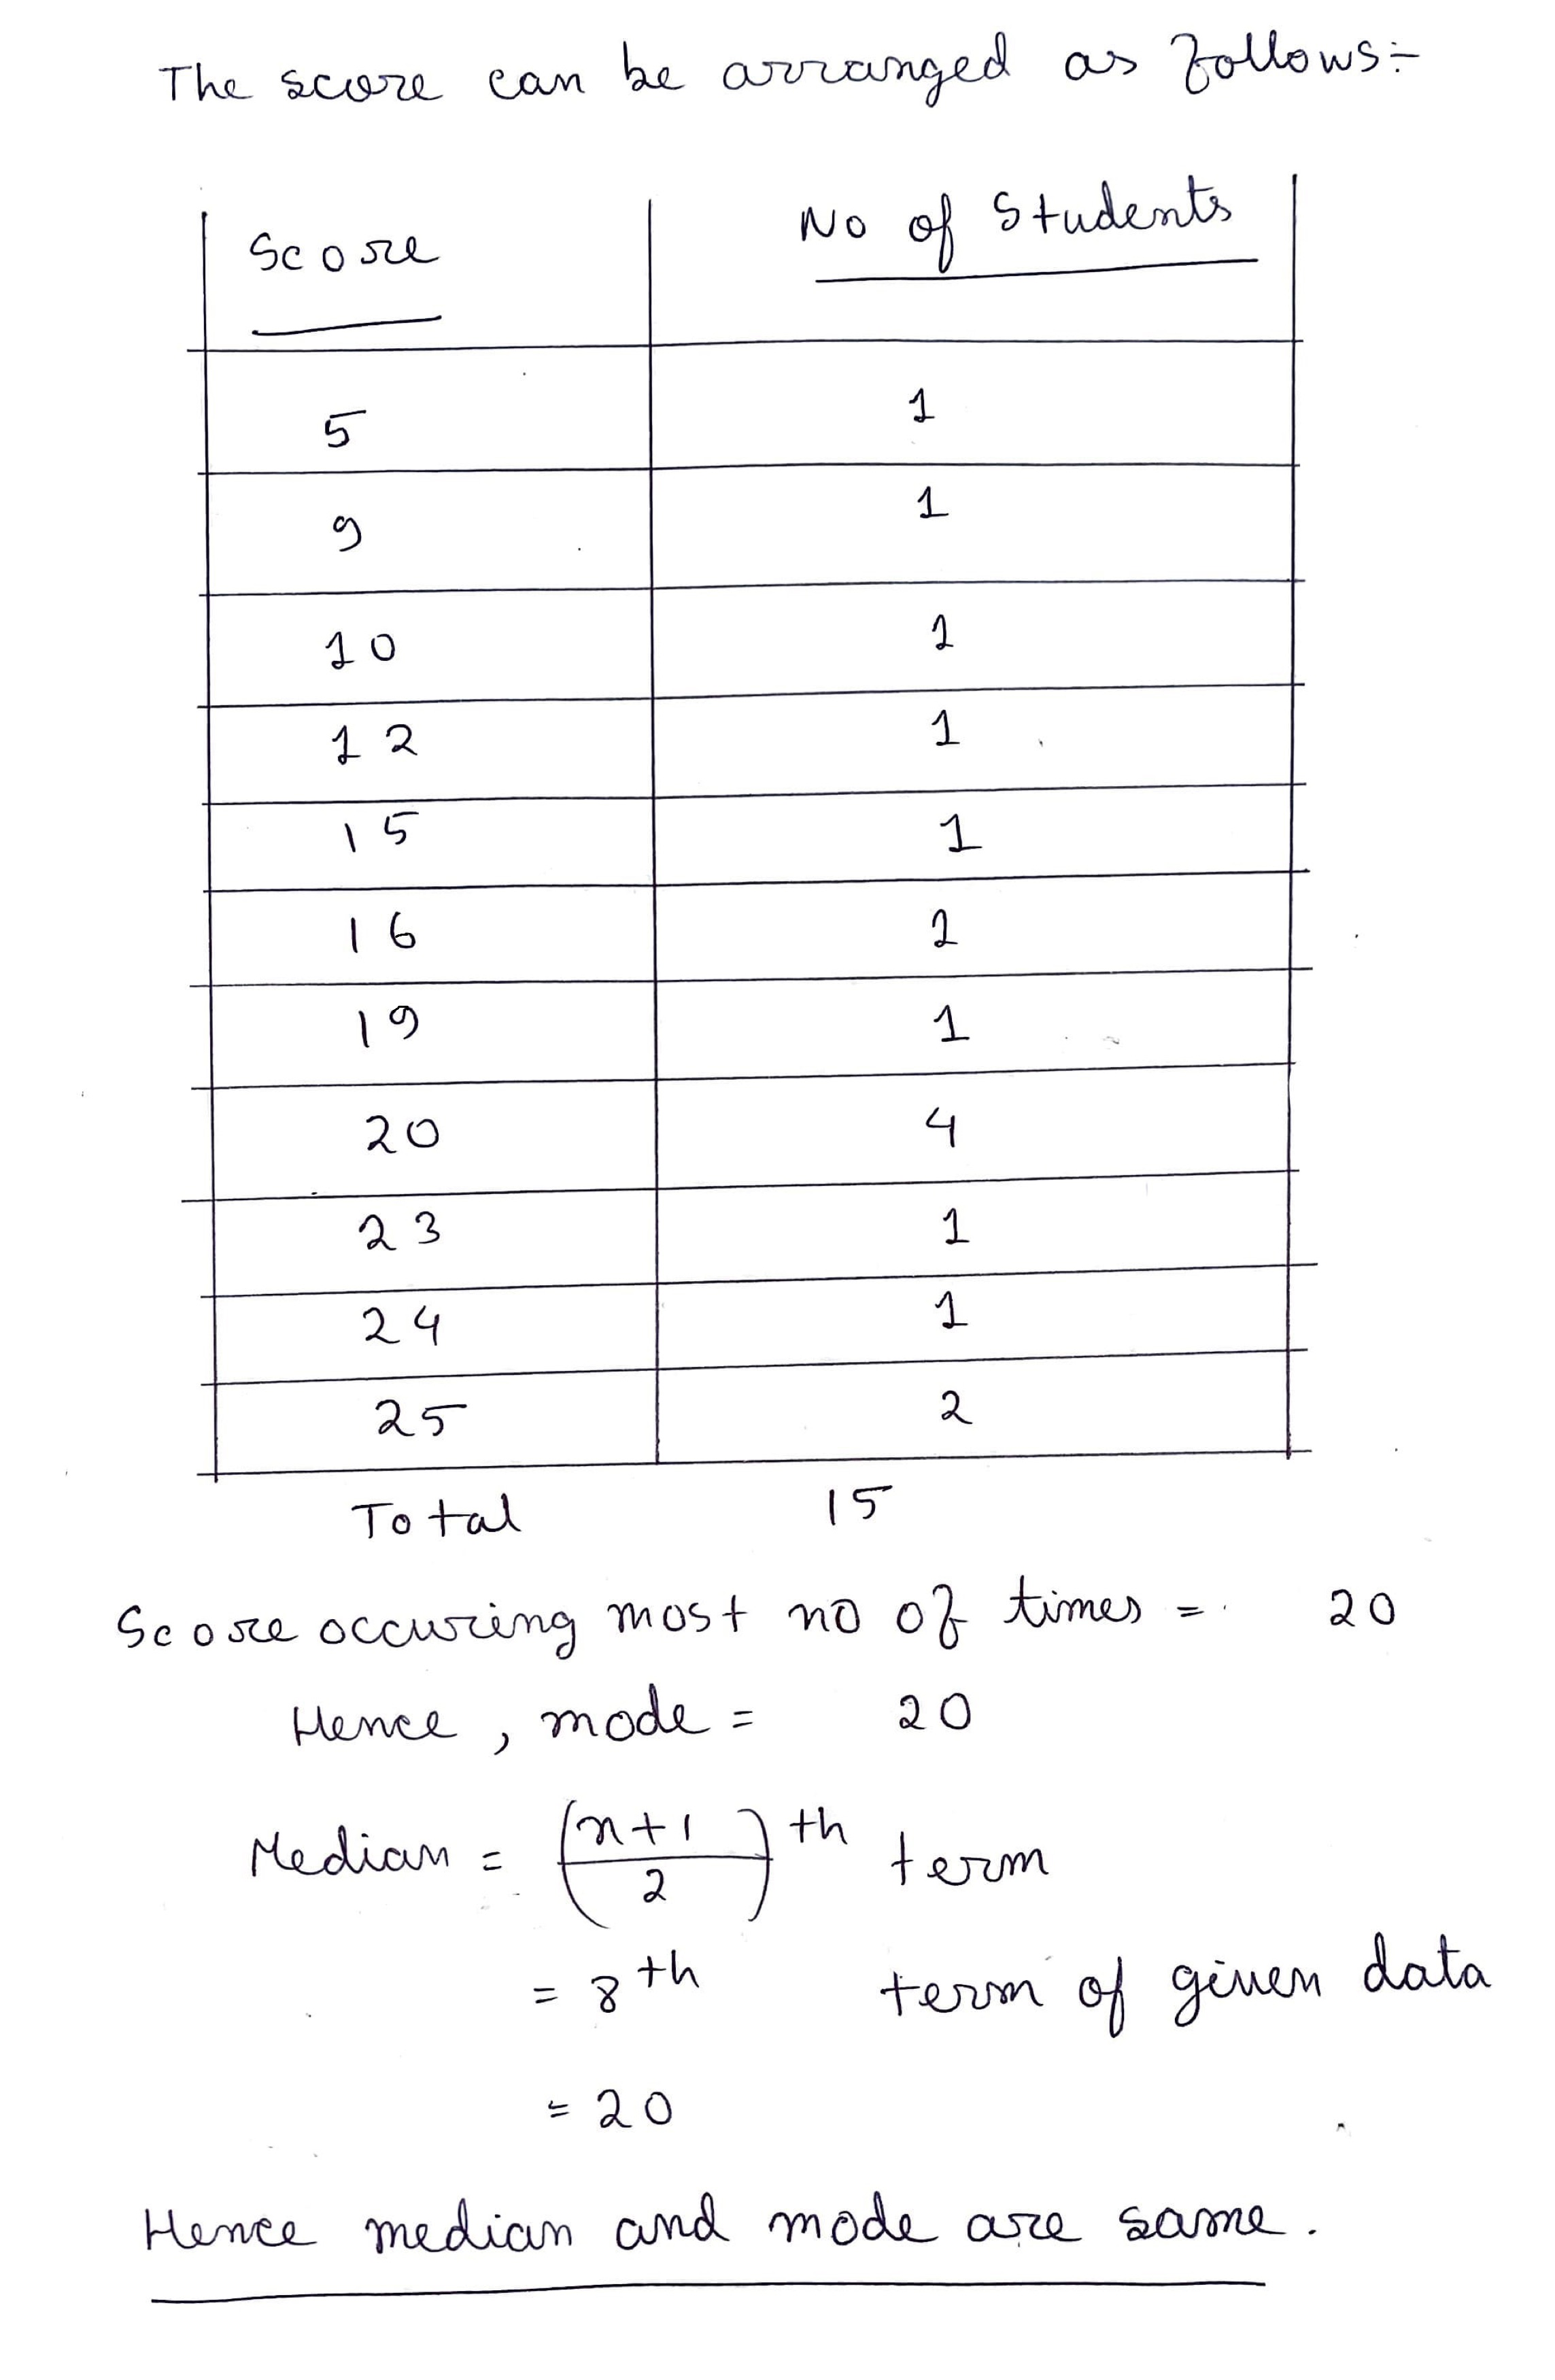
Two Samples of size 6 & 6 respectively have means 350 & 138 and standard deviation 5 andFind the mean and standard deviation of the combined sample of size 250.
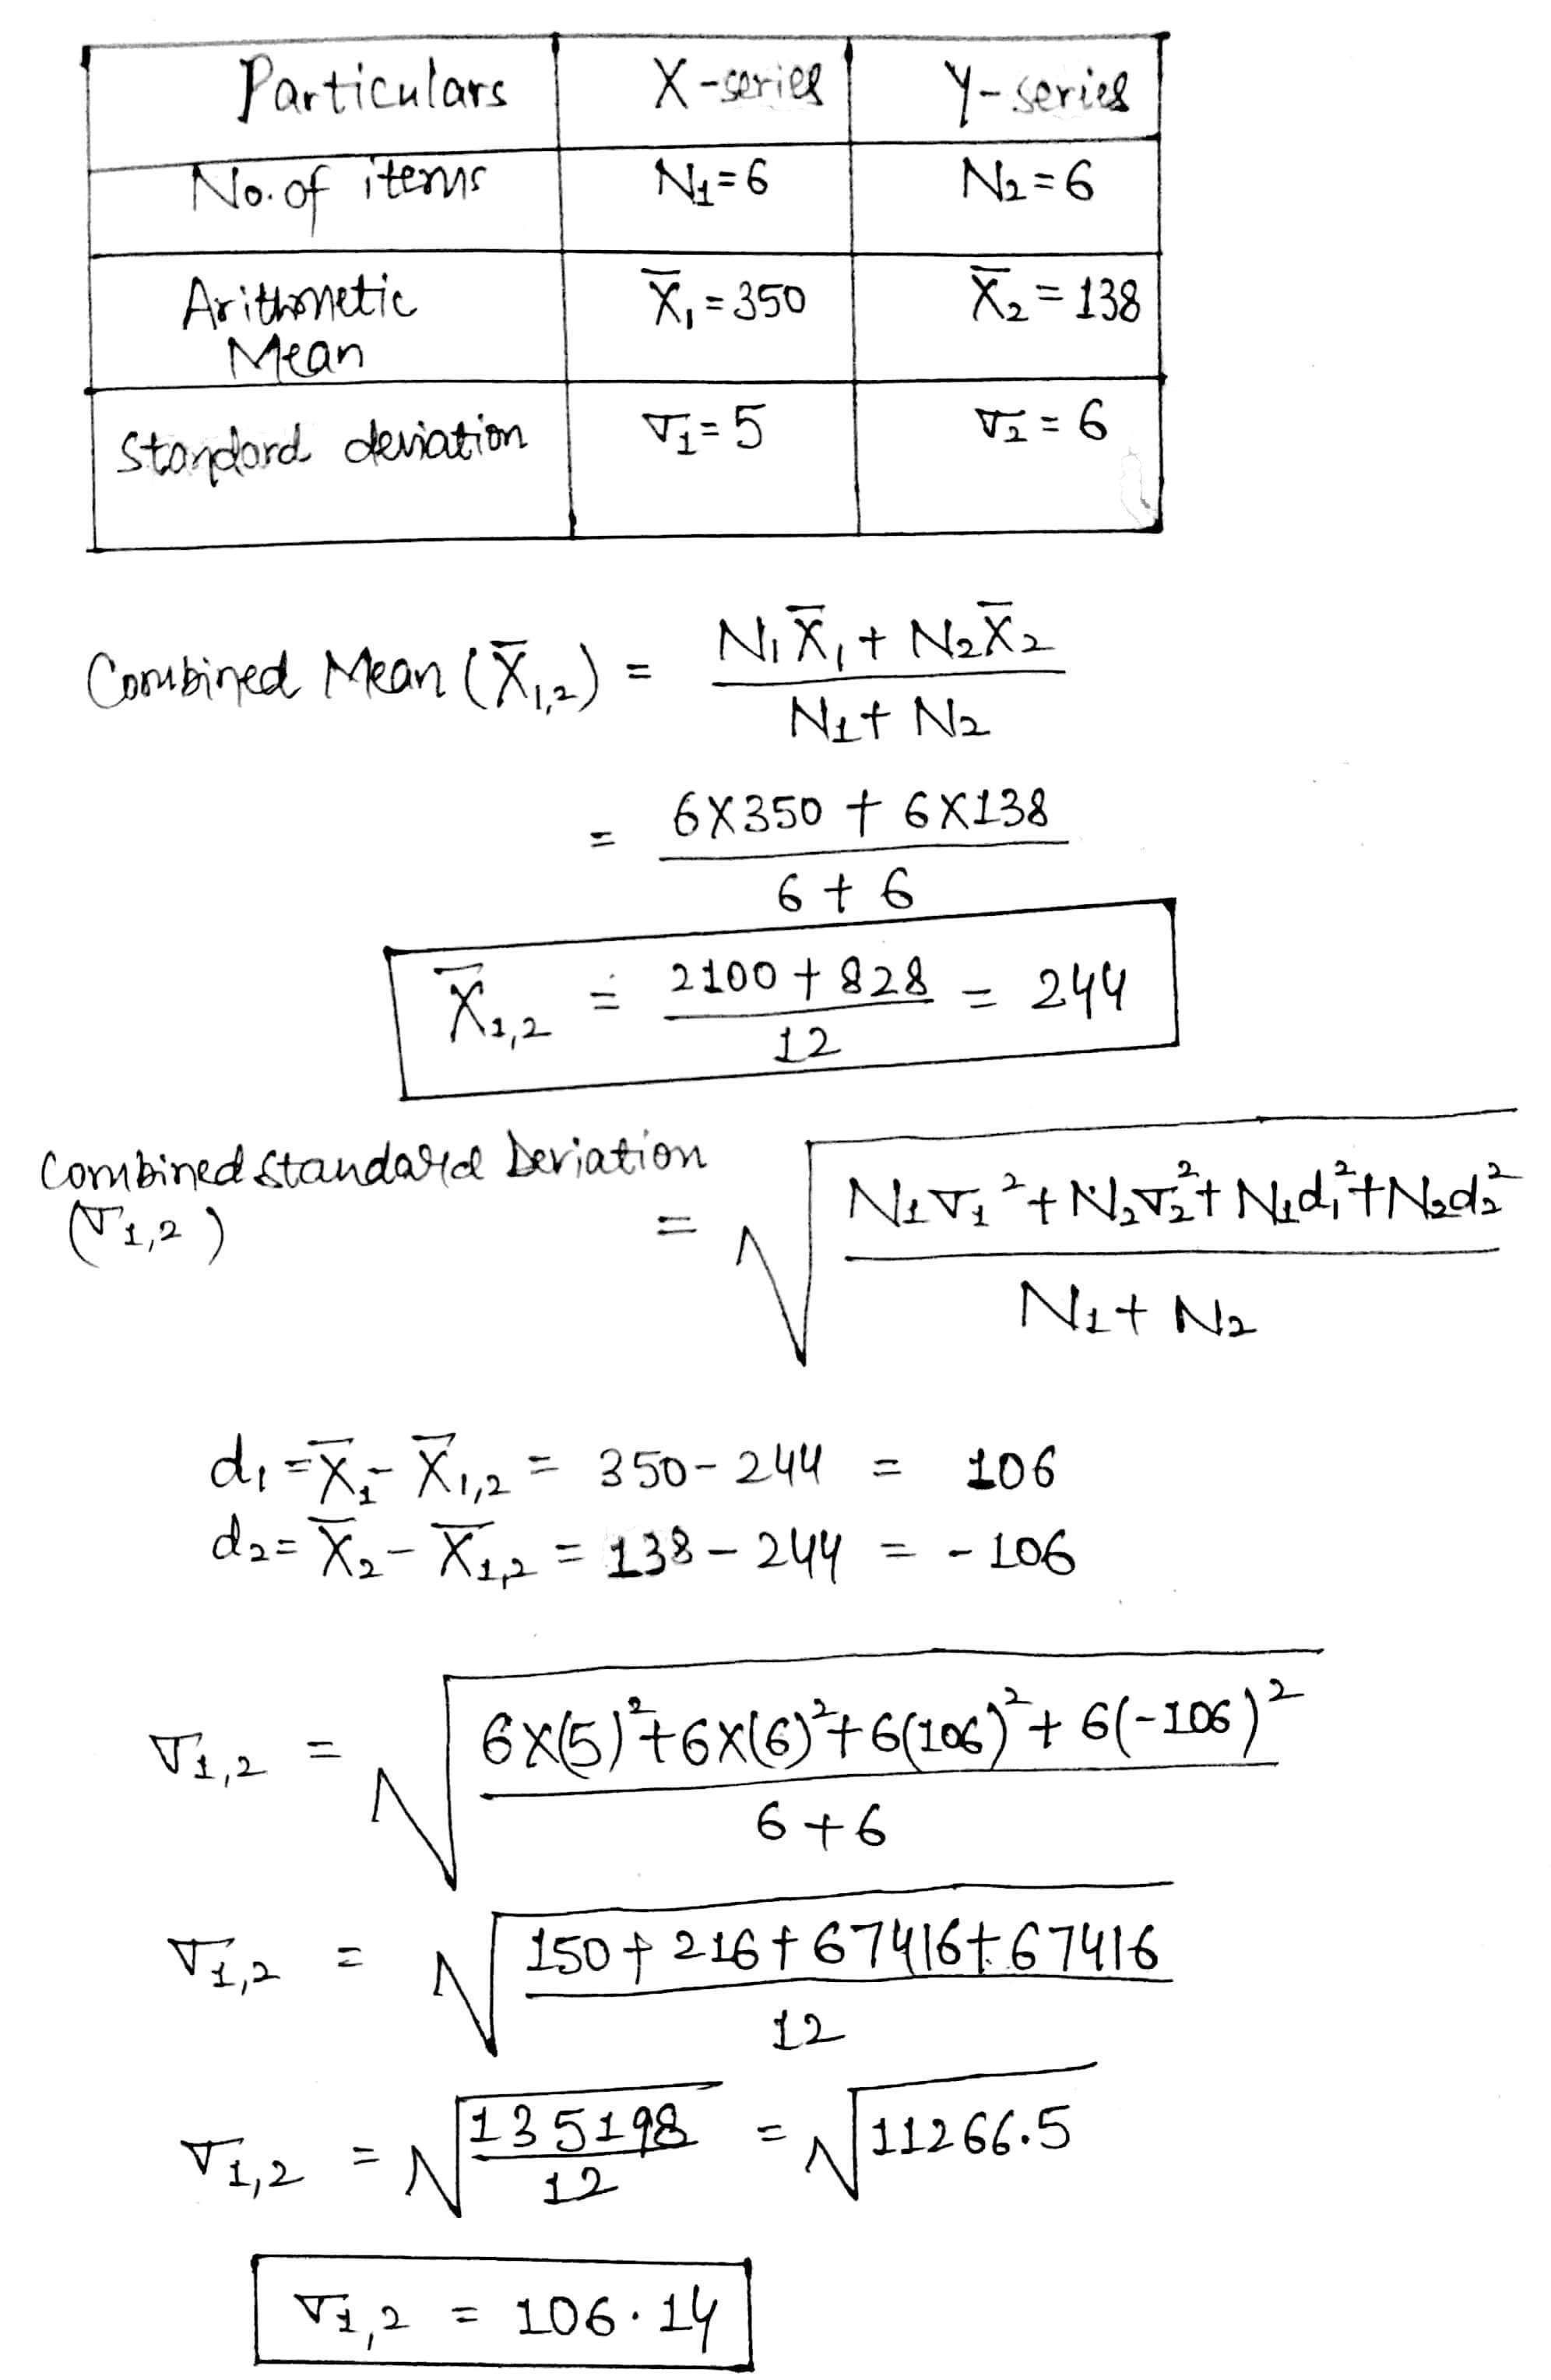
Class 11 Commerce Economics Extra Questions
- Collection Of Data Extra Questions
- Correlation Extra Questions
- Index Numbers Extra Questions
- Introduction To Economics Extra Questions
- Introduction To Microeconomics Extra Questions
- Market Equilibrium Extra Questions
- Measures Of Central Tendency Extra Questions
- Measures Of Dispersion Extra Questions
- Non-Competitive Markets Extra Questions
- Organisation Of Data Extra Questions
- Presentation Of Data Extra Questions
- Production And Costs Extra Questions
- Theory Of Consumer Behaviour Extra Questions
- The Theory Of The Firm Under Perfect Competition Extra Questions
- Use Of Statistical Tools Extra Questions