Organisation Of Data - Class 11 Commerce Economics - Extra Questions
Define arrayed data.
Distinguish between raw data and arrayed data.
Fill in the blanks:
Data obtained in the ............... form is called raw data.
Complete the following cumulative frequency table:
| Class | Frequency | Less than type frequency |
| 0-10 | $$2$$ | |
| 10-20 | $$12$$ | |
| 20-30 | $$20$$ | |
| 30-40 | $$16$$ | |
| Total | $$50$$ |
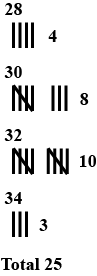
For the following raw data, form a discrete frequency distribution:
$$30, 32, 32, 28, 34, 34, 32, 30, 30, 32, 32, 34, 30, 32, 32, 28, 32, 30, 28, 30, 32, 32, 30, 28$$ and $$30$$
The required frequency table is shown below
Marks Tally marks Frequency
Marks Tally marks Frequency
The marks scored by 55 students in a test are given below.
| Marks : | 0 - 5 | 5 - 10 | 10 - 15 | 15 - 20 | 20 - 25 | 25 - 30 | 30 - 25 |
| No. of students | 2 | 6 | 13 | 17 | 11 | 4 | 2 |
Given below are the cumulative frequencies showing the weights of 685 students of a school. Prepare a frequency distribution table.
| Weight (in kg ) | No. of students |
| Below 25 | 0 |
| Below 30 | 24 |
| Below 35 | 78 |
| Below 40 | 183 |
| Below 45 | 294 |
| Below 50 | 408 |
| Below 55 | 543 |
| Below 60 | 621 |
| Below 65 | 674 |
| Below 70 | 685 |
The numbers of members in the $$40$$ families in Bhilar are as follows: $$1,\ 6,\ 5,\ 4,\ 3,\ 2,\ 7,\ 2,\ 3,\ 4,\ 5,\ 6,\ 4,\ 6,\ 2,\ 3,\ 2,\ 1,\ 4,\ 5,\ 6,\ 7,\ 3,$$$$ 4,\ 5,\ 2,\ 4,\ 3,\ 2,\ 3,\ 5,\ 5,\ 4,\ 6,\ 2,\ 3,\ 5,\ 6,\ 4,\ 2$$. Prepare a frequency table and find the mean of members of $$40$$ families.
Explain the meaning of the following terms: true class limits.
Following are the ages of 360 patients getting medical treatment in a hospital on a day :
| Age (in years ) : | 10 - 20 | 20 - 30 | 30 - 40 | 40 - 50 | 50 - 60 | 60 - 70 |
| No. of Patients : | 90 | 50 | 60 | 80 | 50 | 30 |
What is the class mark of the interval $$27-32?$$
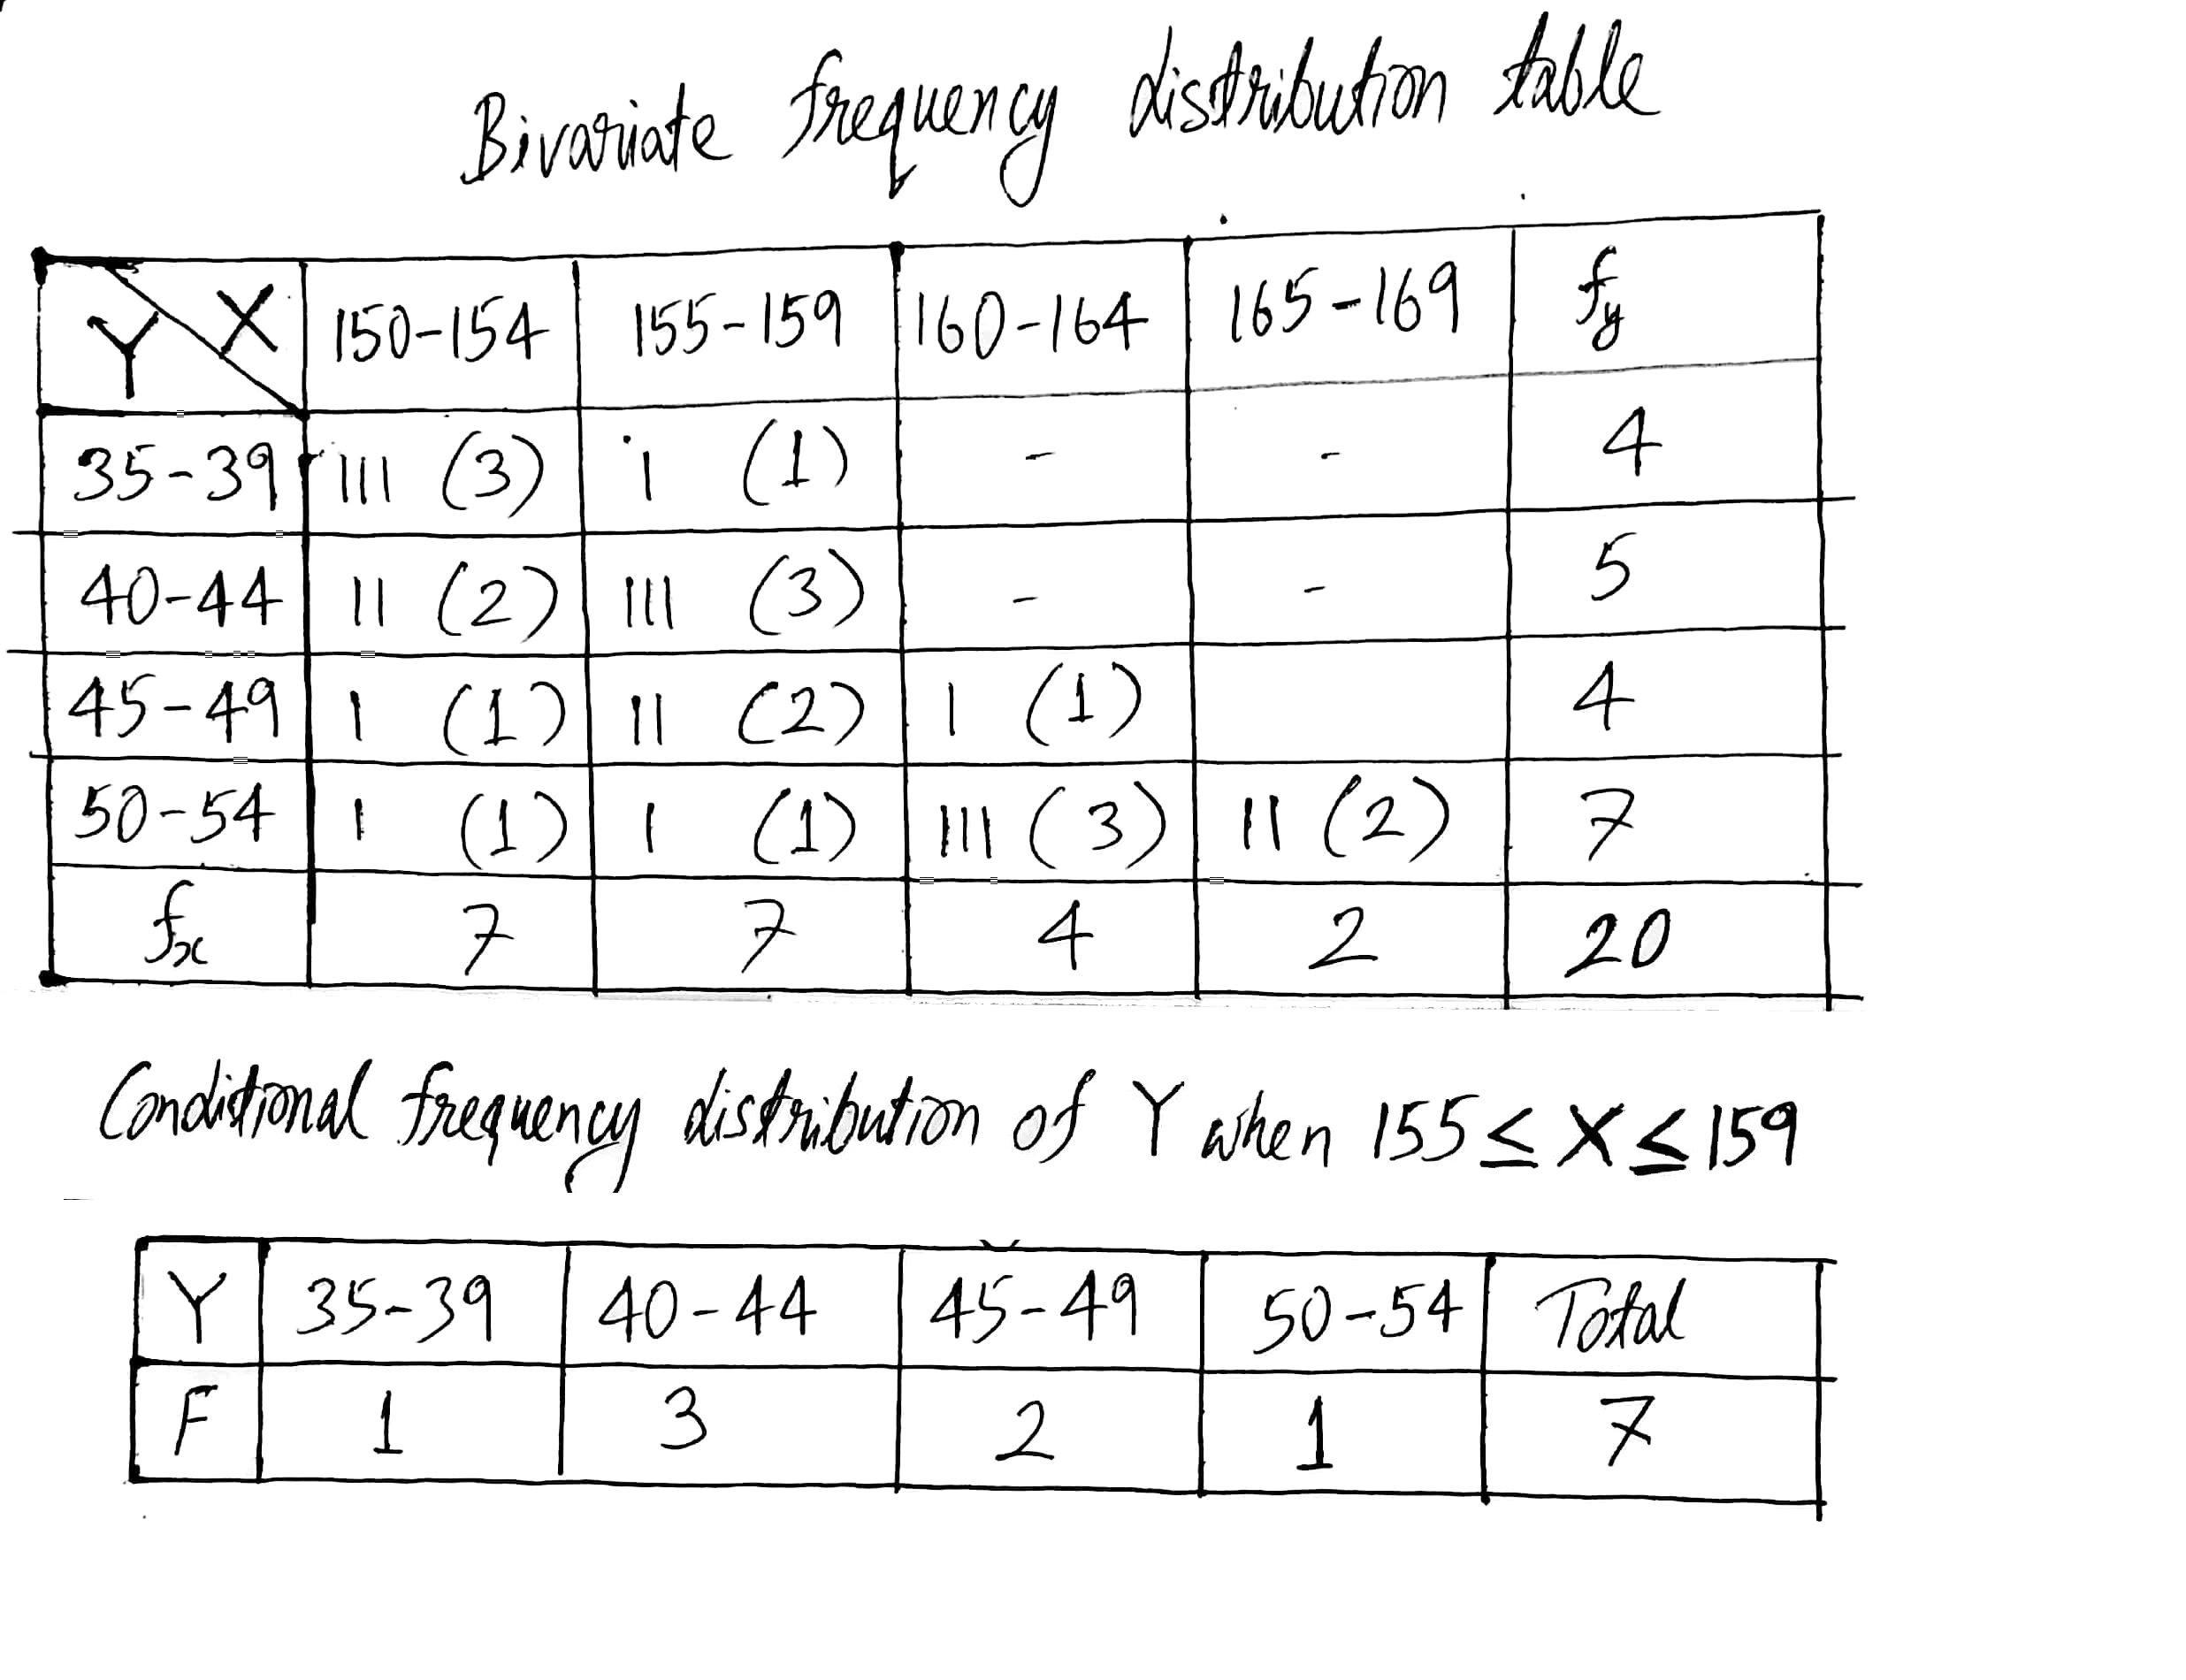
Following data gives height in cm(X) and weight in kgs(Y) of $$20$$ boys. Prepare a bivariate frequency table taking class intervals $$150-154$$, $$155-159$$ etc., for X and $$35-39$$, $$40-44$$ etc., Y. Also find conditional frequency distribution of Y when $$155 \leq X\leq 159$$
$$(152, 40)$$ $$(160, 54)$$ $$(163, 52)$$ $$(150, 35)$$
$$(154, 36)$$ $$(160, 49)$$ $$(166, 54)$$ $$(157, 38)$$
$$(159, 43)$$ $$(153, 48)$$ $$(152, 41)$$ $$(158, 51)$$
$$(155, 44)$$ $$(156, 47)$$ $$(156, 43)$$ $$(166, 53)$$
$$(160, 50)$$ $$(151, 39)$$ $$(153, 50)$$ $$(158, 46)$$.
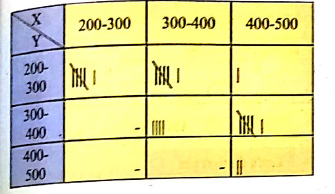
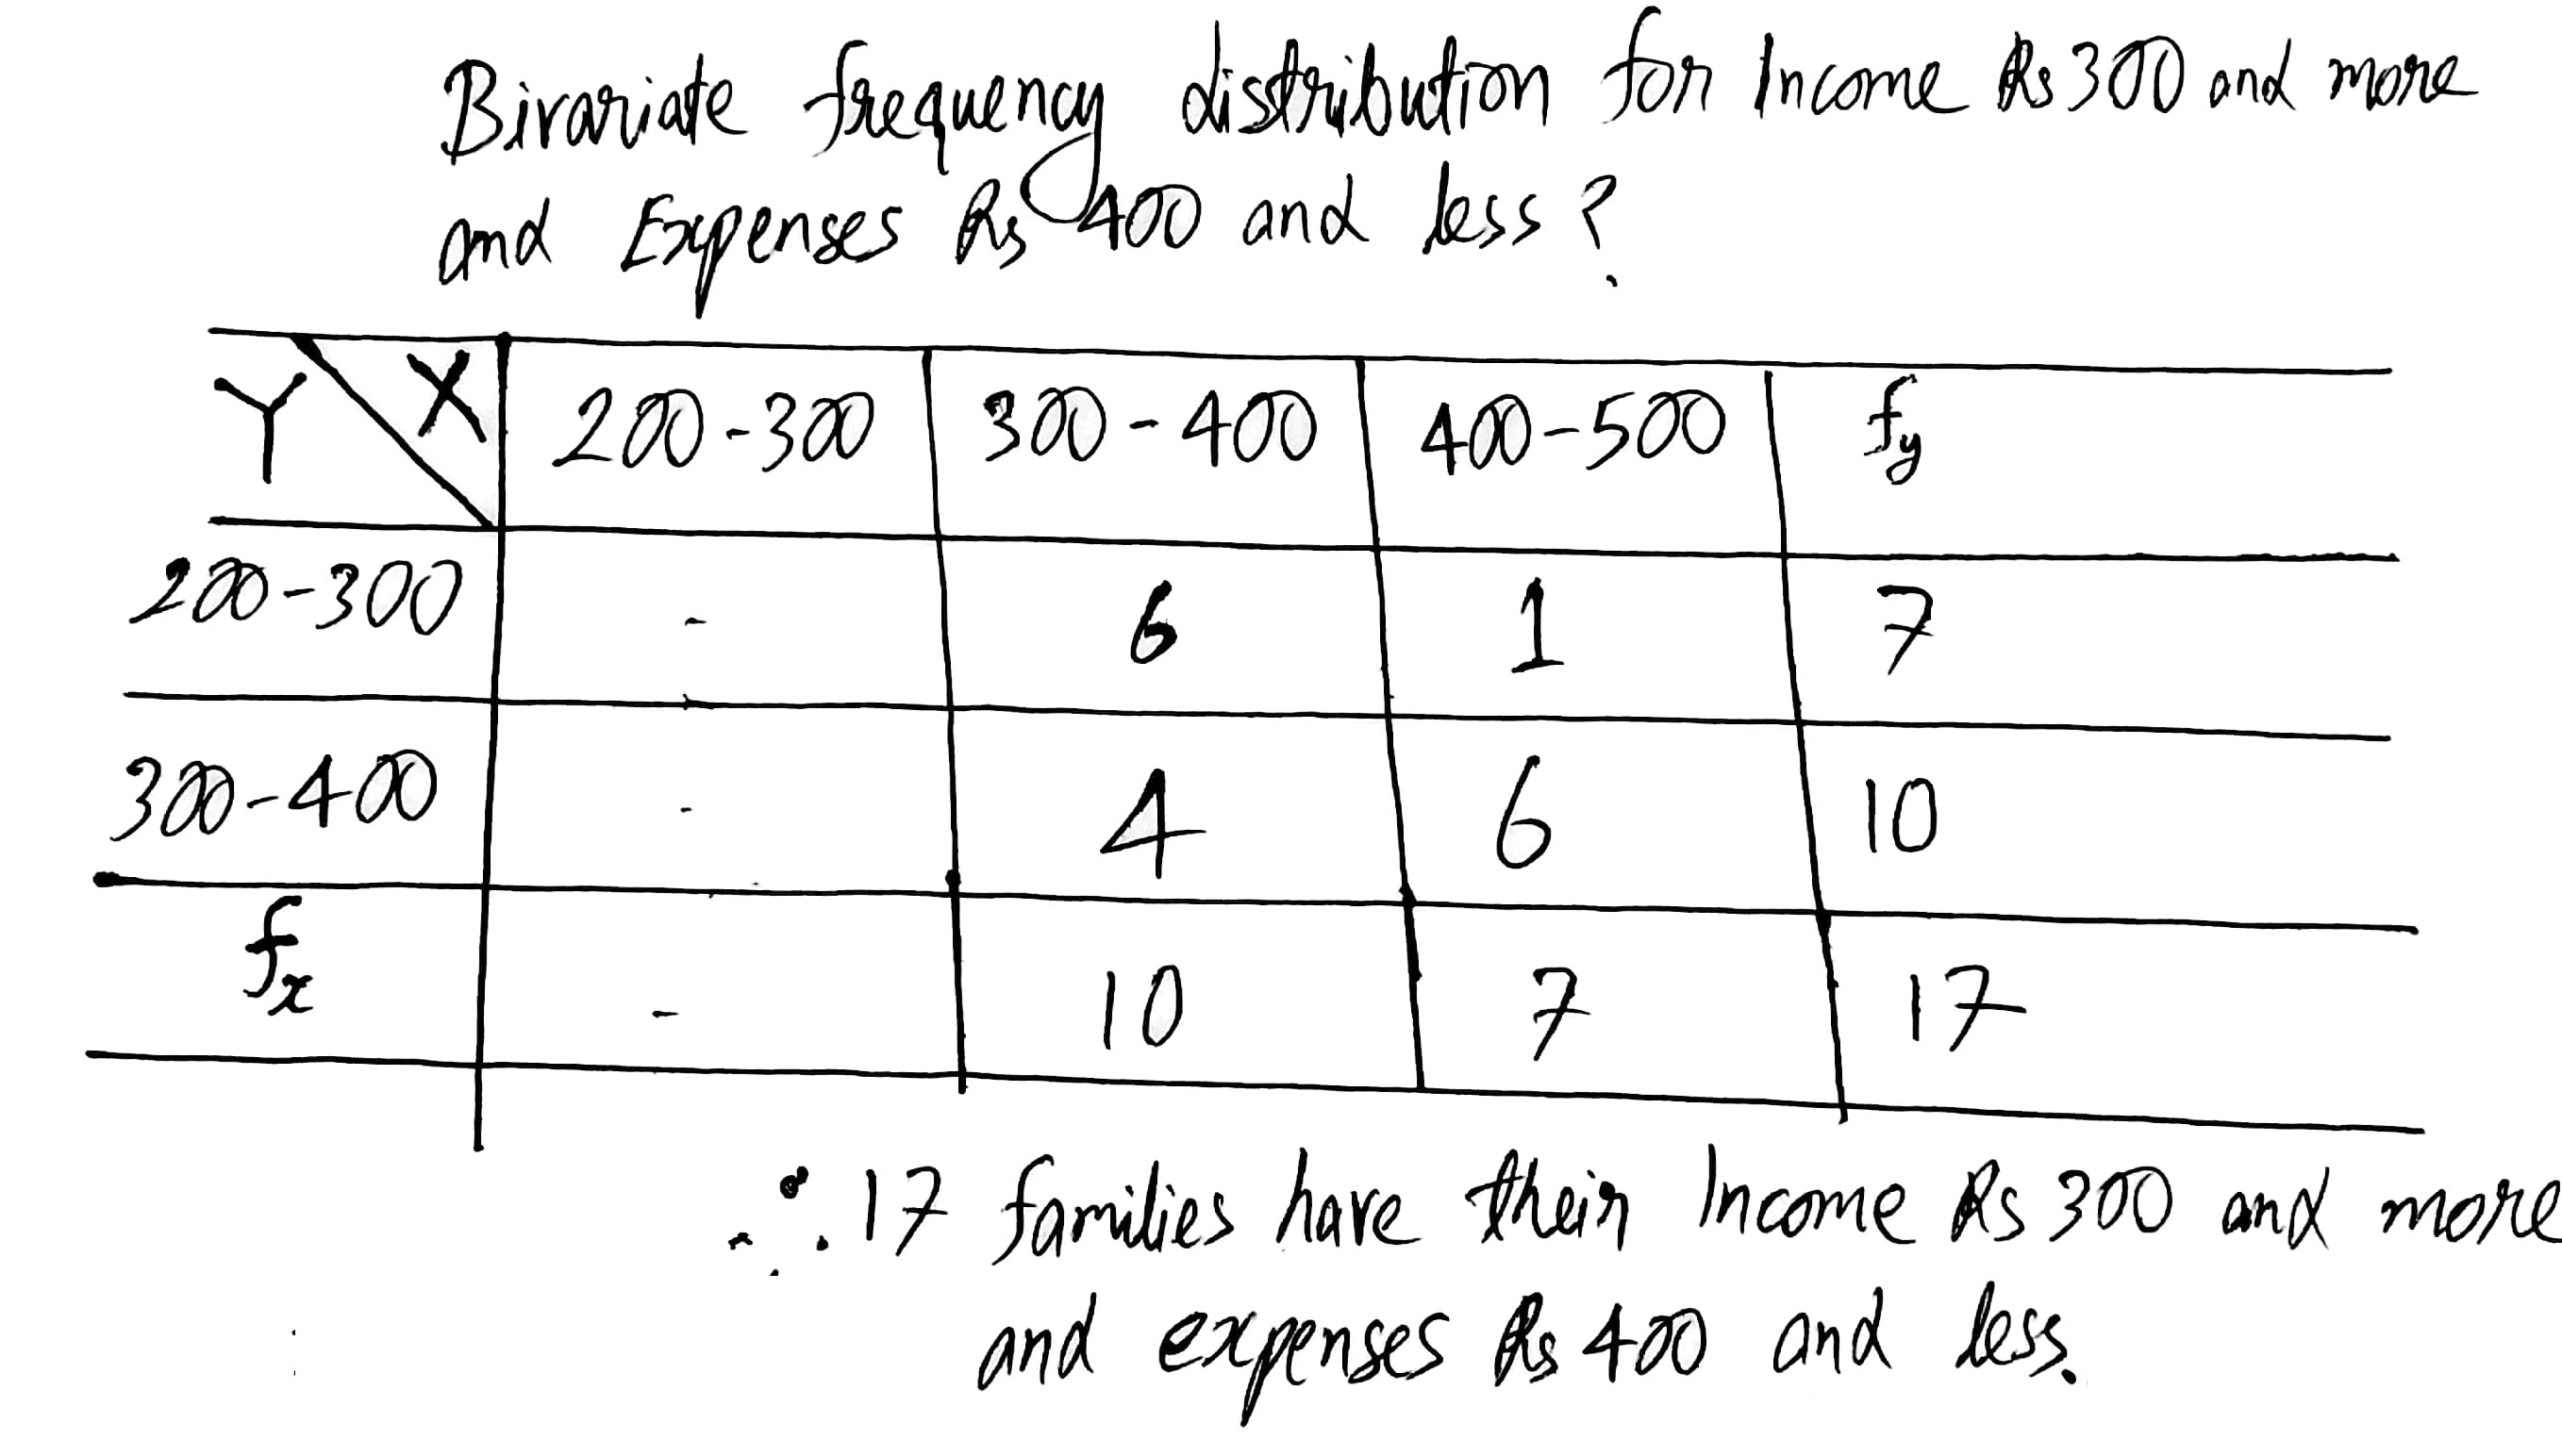
Following table gives income(X) and expenditure(Y) of $$25$$ families.
Find how many families have their income Rs. $$300$$ and more and expenses Rs. $$400$$ and less?
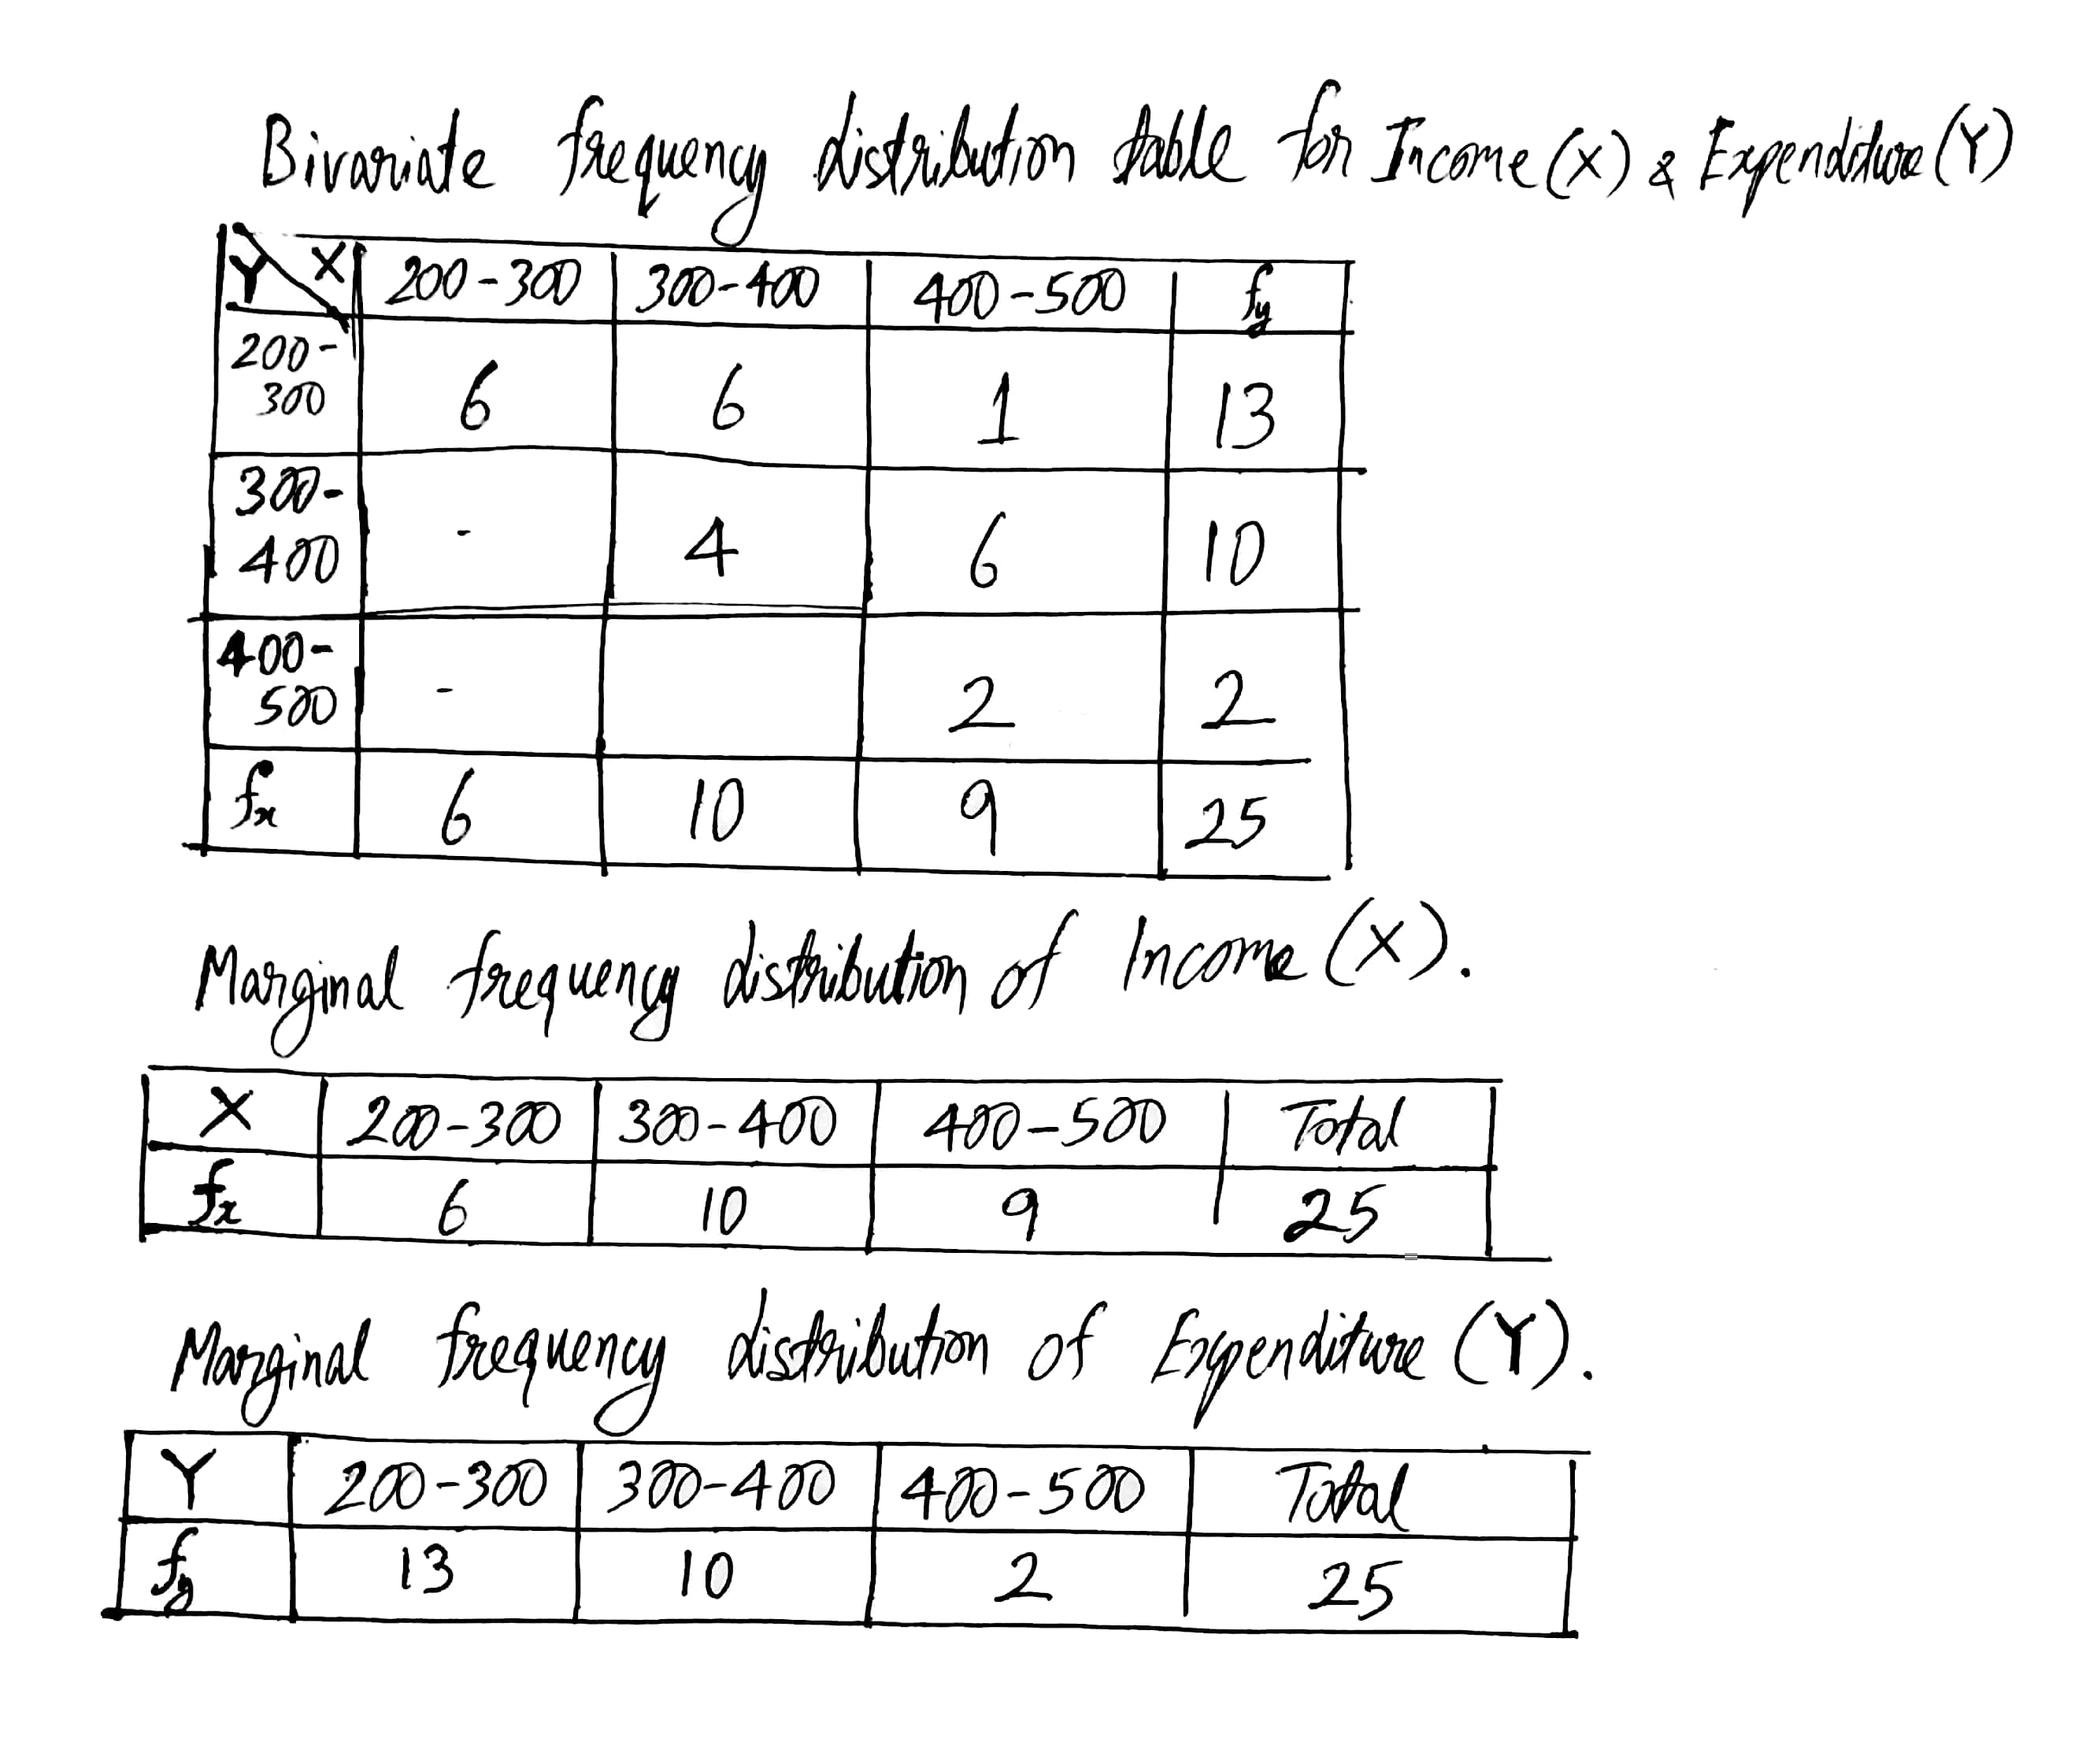
Following table gives income(X) and expenditure(Y) of $$25$$ families.
Find marginal frequency distribution of income and expenditure.

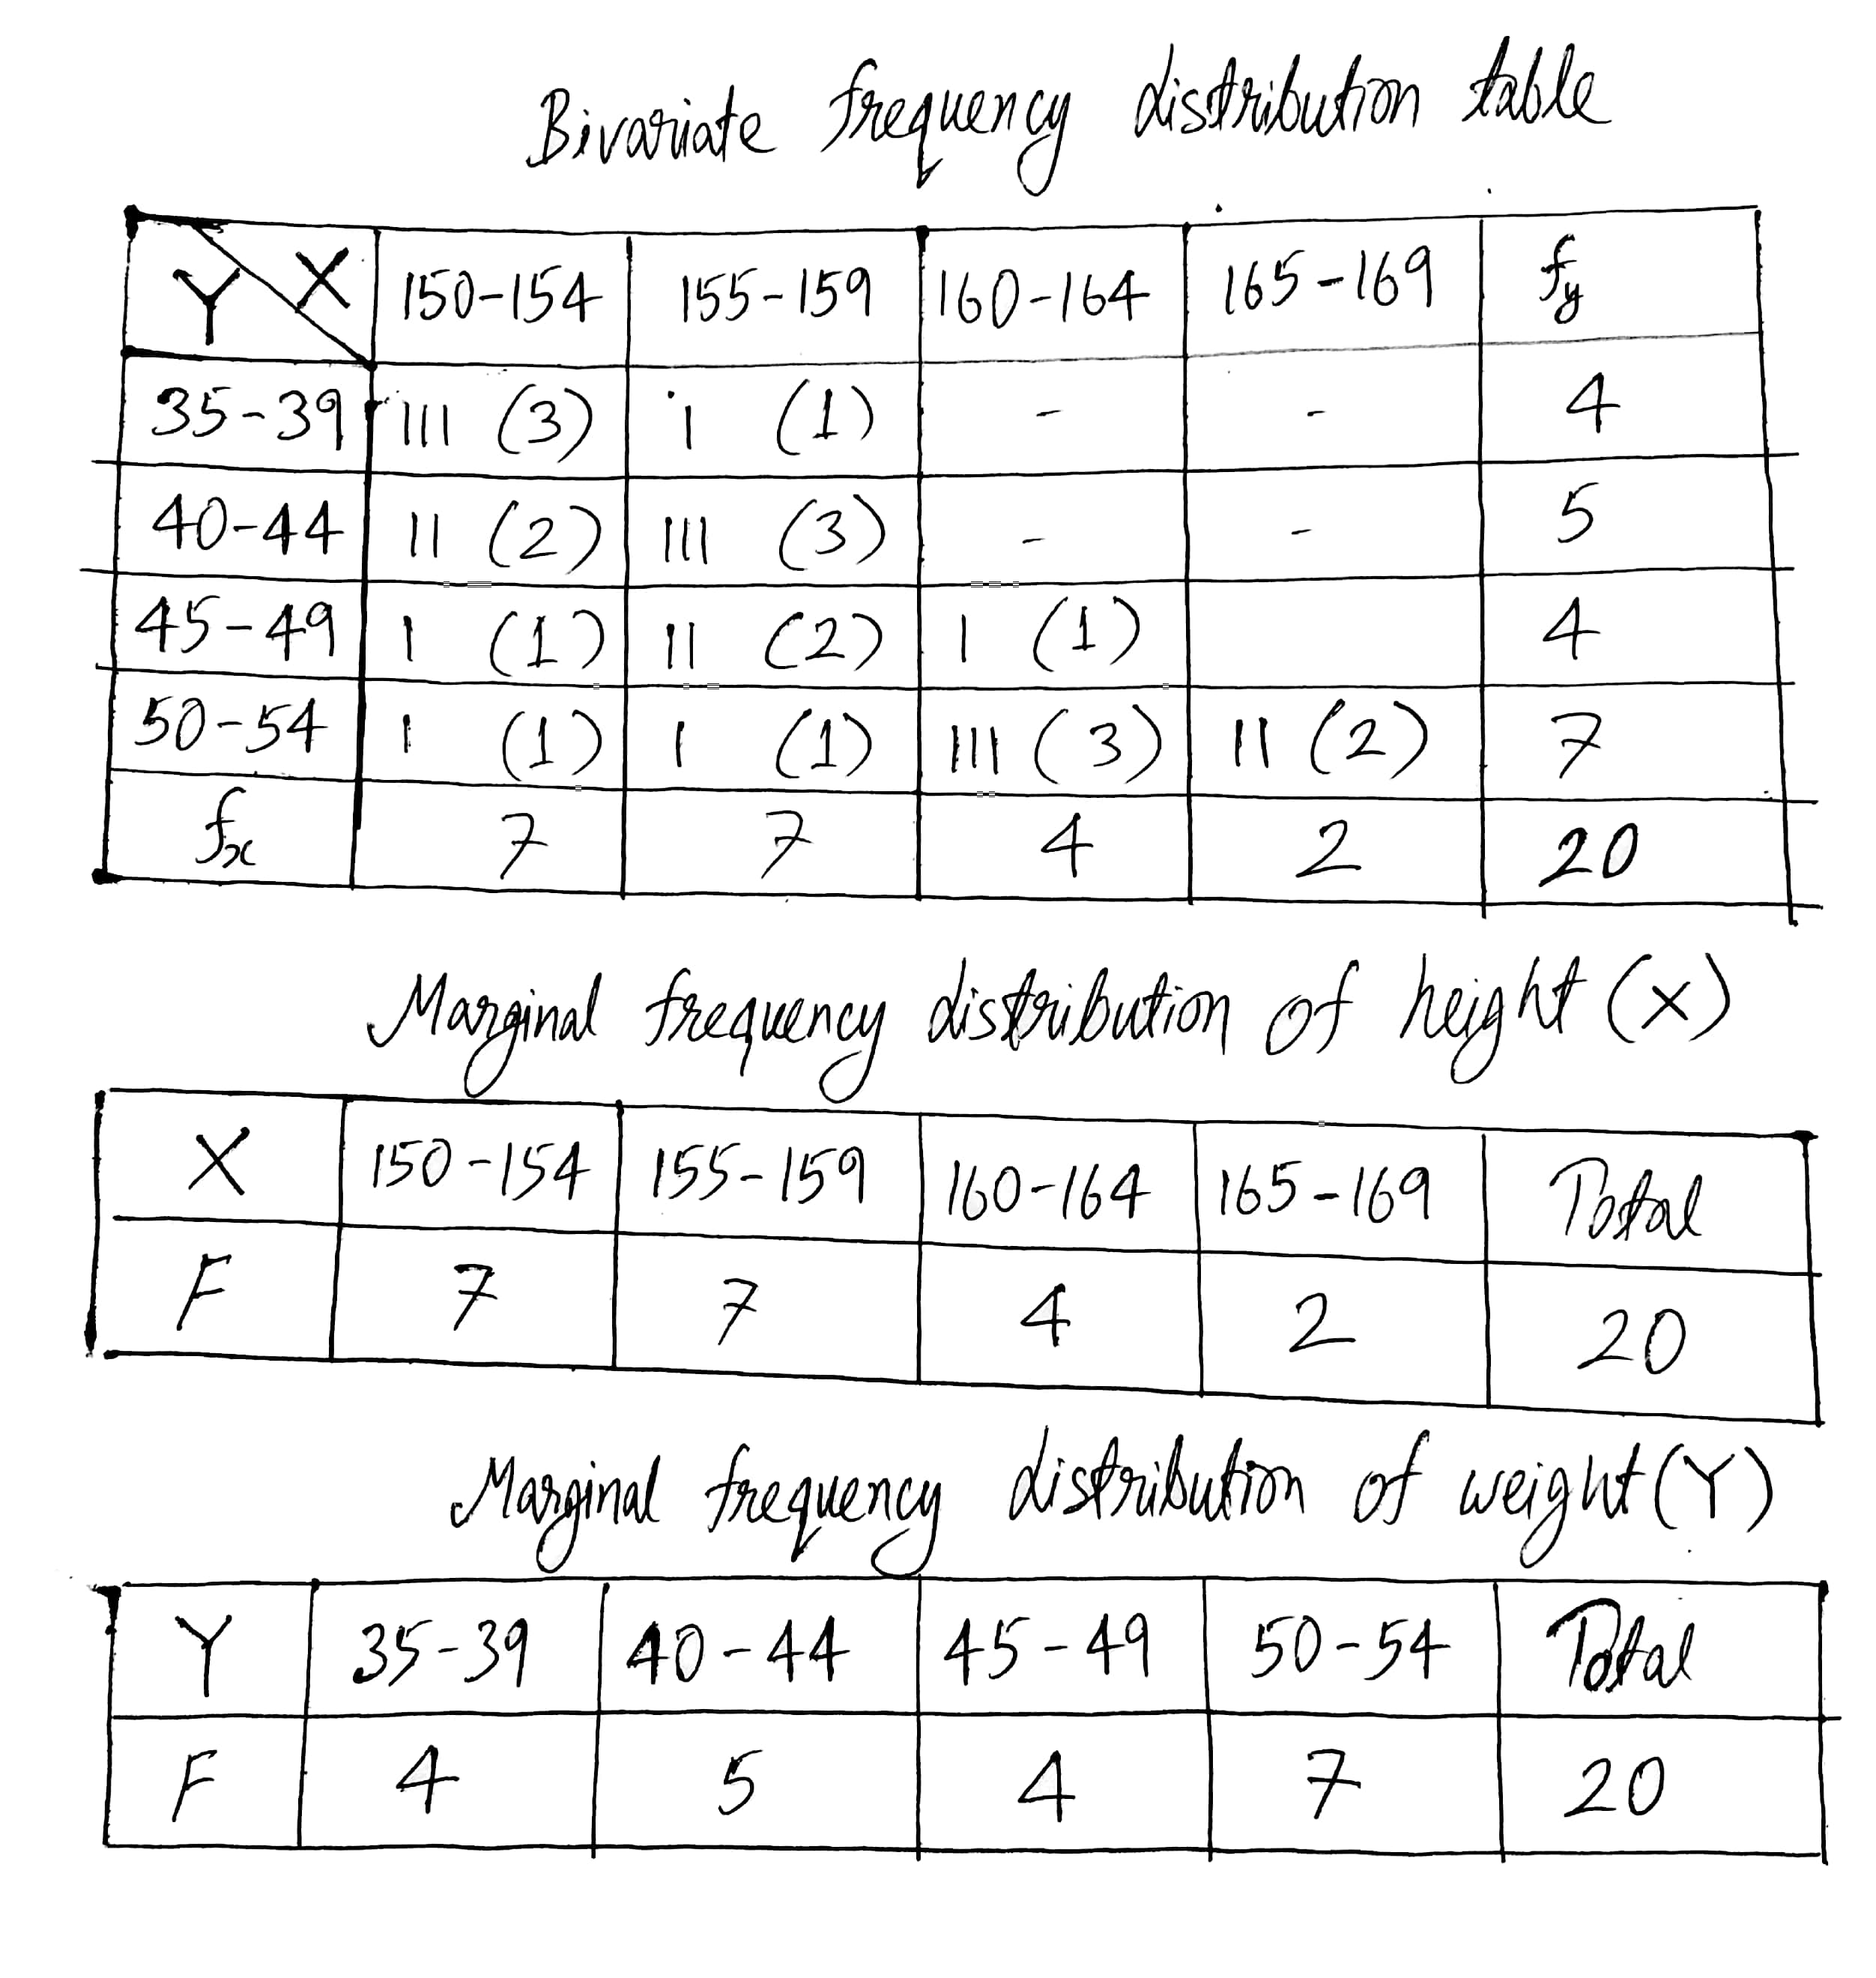
Following data gives height in cm(X) and weight in kgs(Y) of $$20$$ boys. Prepare a bivariate frequency table taking class intervals $$150-154$$, $$155-159$$… etc., for X and $$35-39$$, $$40-44$$… etc., for Y. Also find marginal frequency distributions.
$$(152, 40)$$ $$(160, 54)$$ $$(163, 52)$$ $$(150, 35)$$$$(154, 36)$$ $$(160, 49)$$ $$(166, 54)$$ $$(157, 38)$$$$(159, 43)$$ $$(153, 48)$$ $$(152, 41)$$ $$(158, 51)$$$$(155, 44)$$ $$(156, 47)$$ $$(156, 43)$$ $$(166, 53)$$$$(160, 50)$$ $$(151, 39)$$ $$(153, 50)$$ $$(158, 46)$$.
$$(152, 40)$$ $$(160, 54)$$ $$(163, 52)$$ $$(150, 35)$$
$$(154, 36)$$ $$(160, 49)$$ $$(166, 54)$$ $$(157, 38)$$
$$(159, 43)$$ $$(153, 48)$$ $$(152, 41)$$ $$(158, 51)$$
$$(155, 44)$$ $$(156, 47)$$ $$(156, 43)$$ $$(166, 53)$$
$$(160, 50)$$ $$(151, 39)$$ $$(153, 50)$$ $$(158, 46)$$.
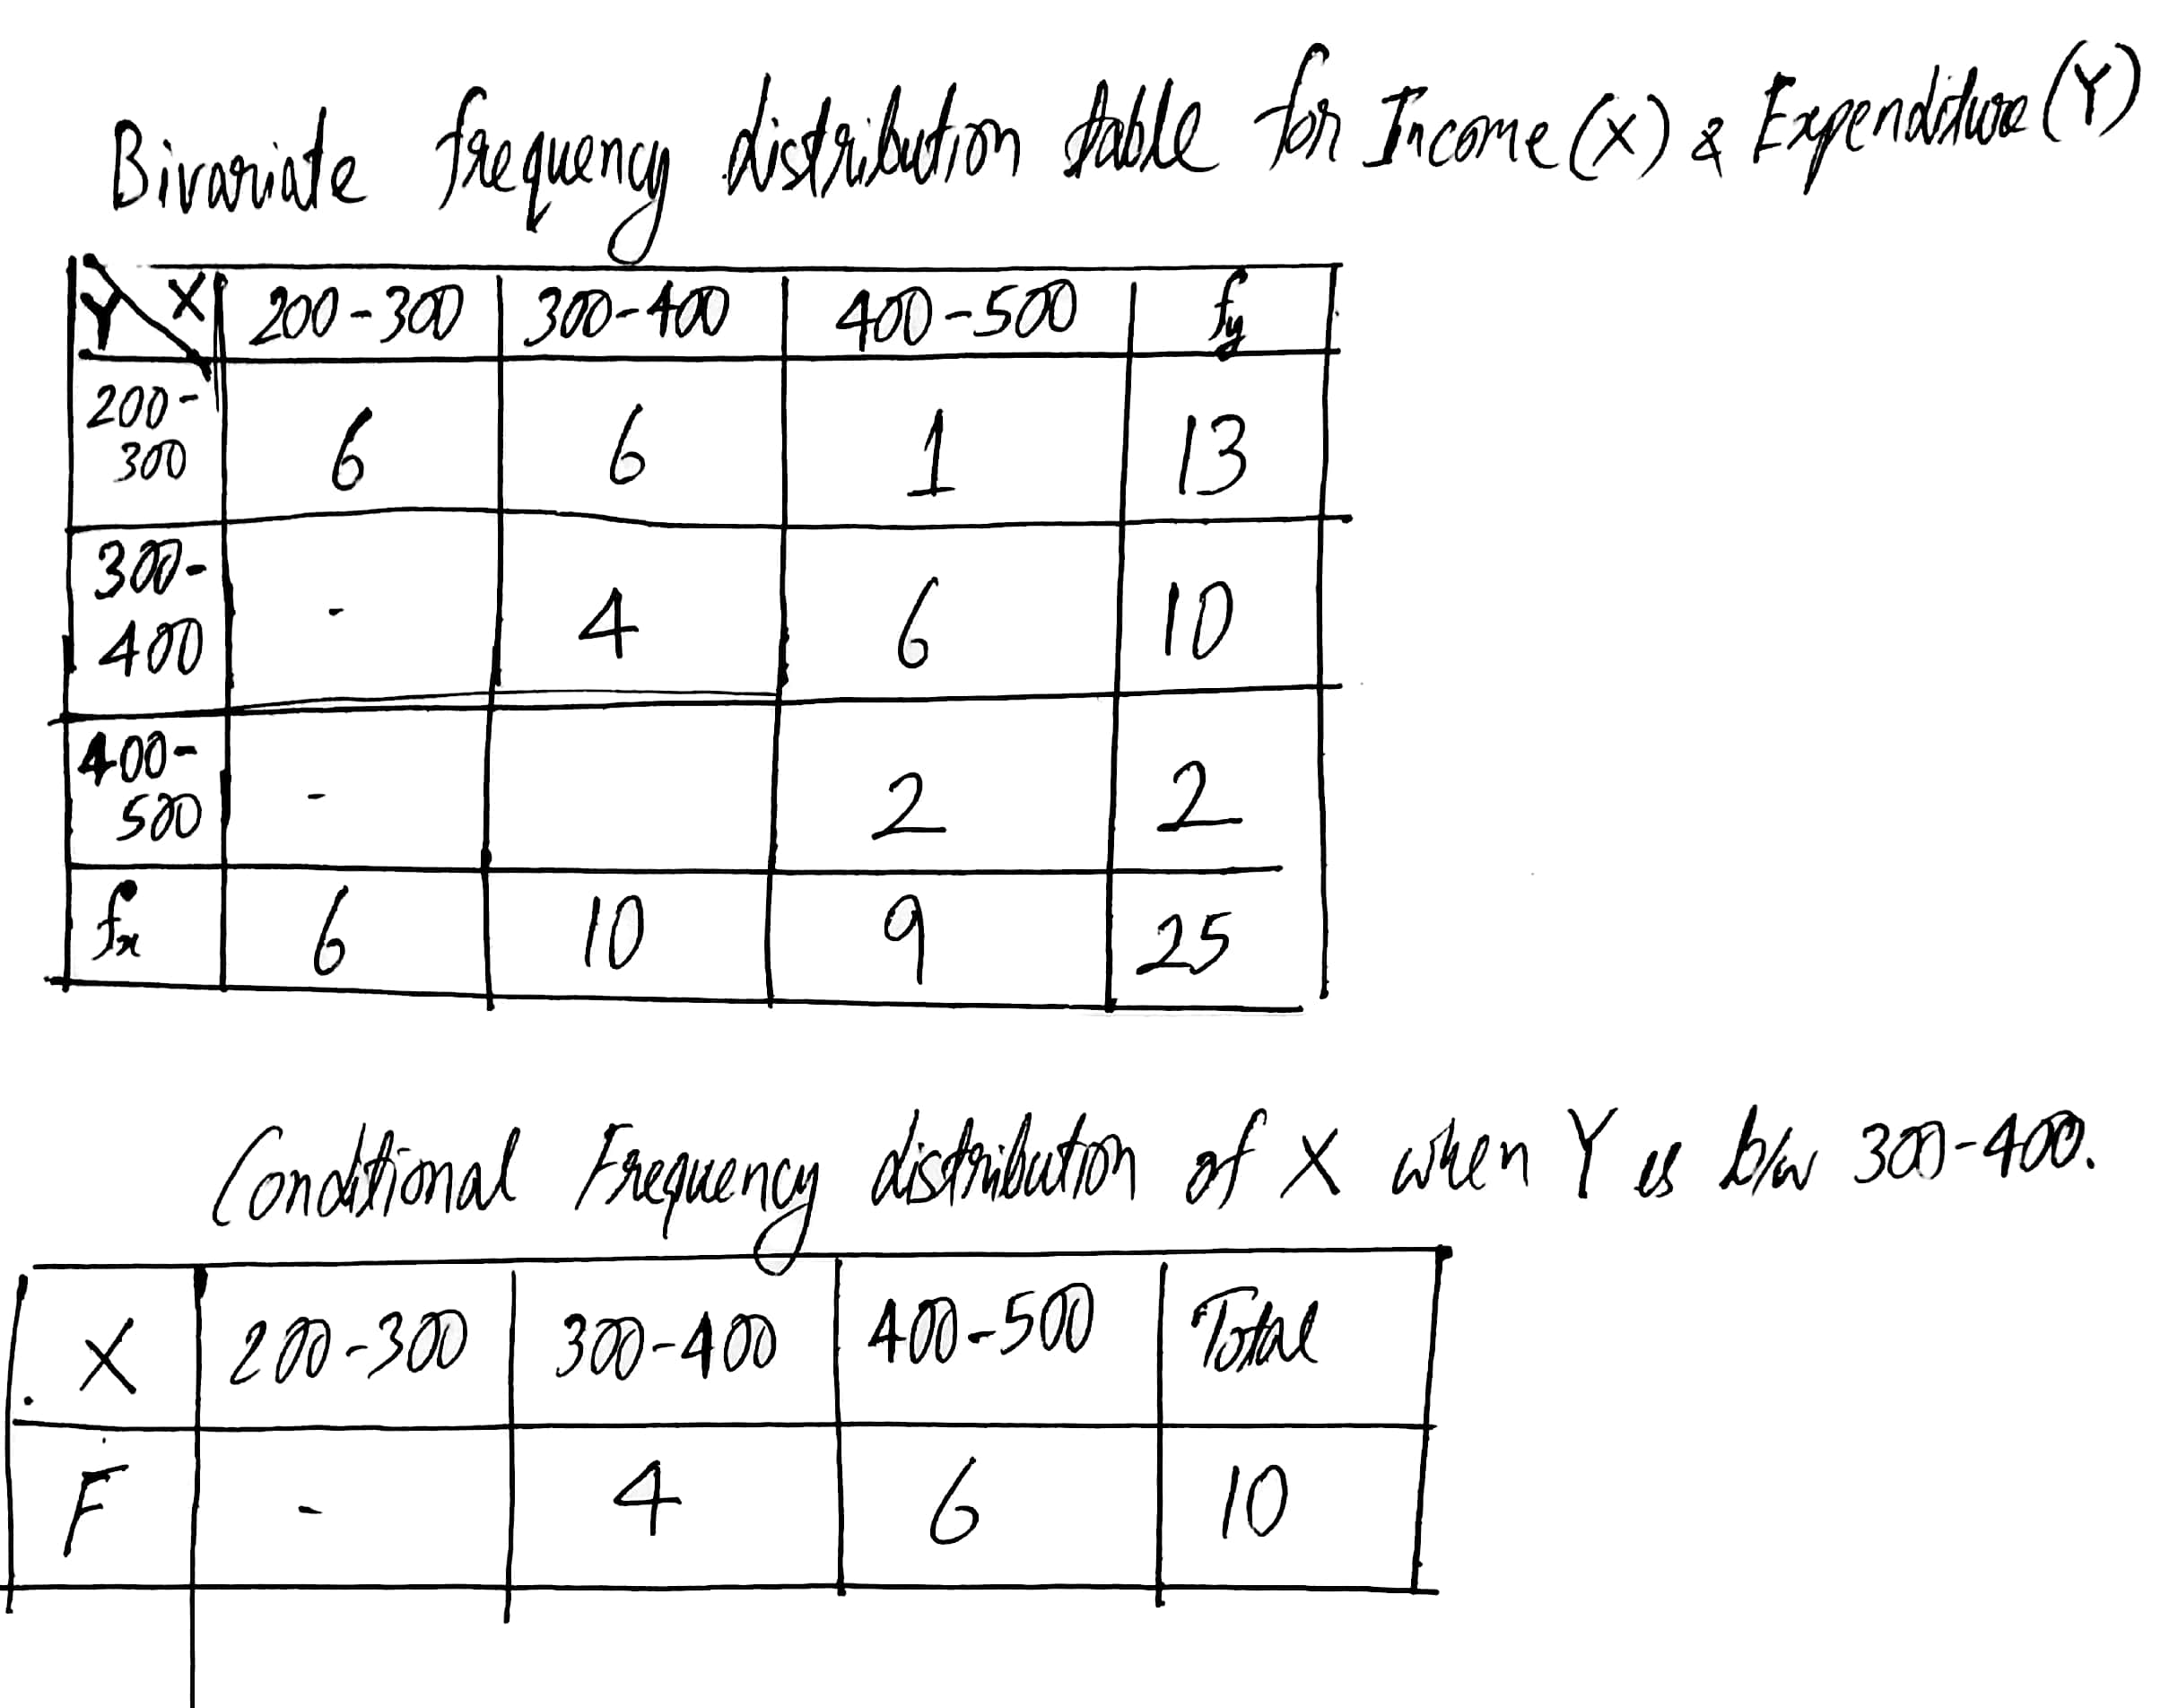
Following table gives income(X) and expenditure(Y) of $$25$$ families.
Find conditional frequency distribution of X when Y is between $$300-400$$.

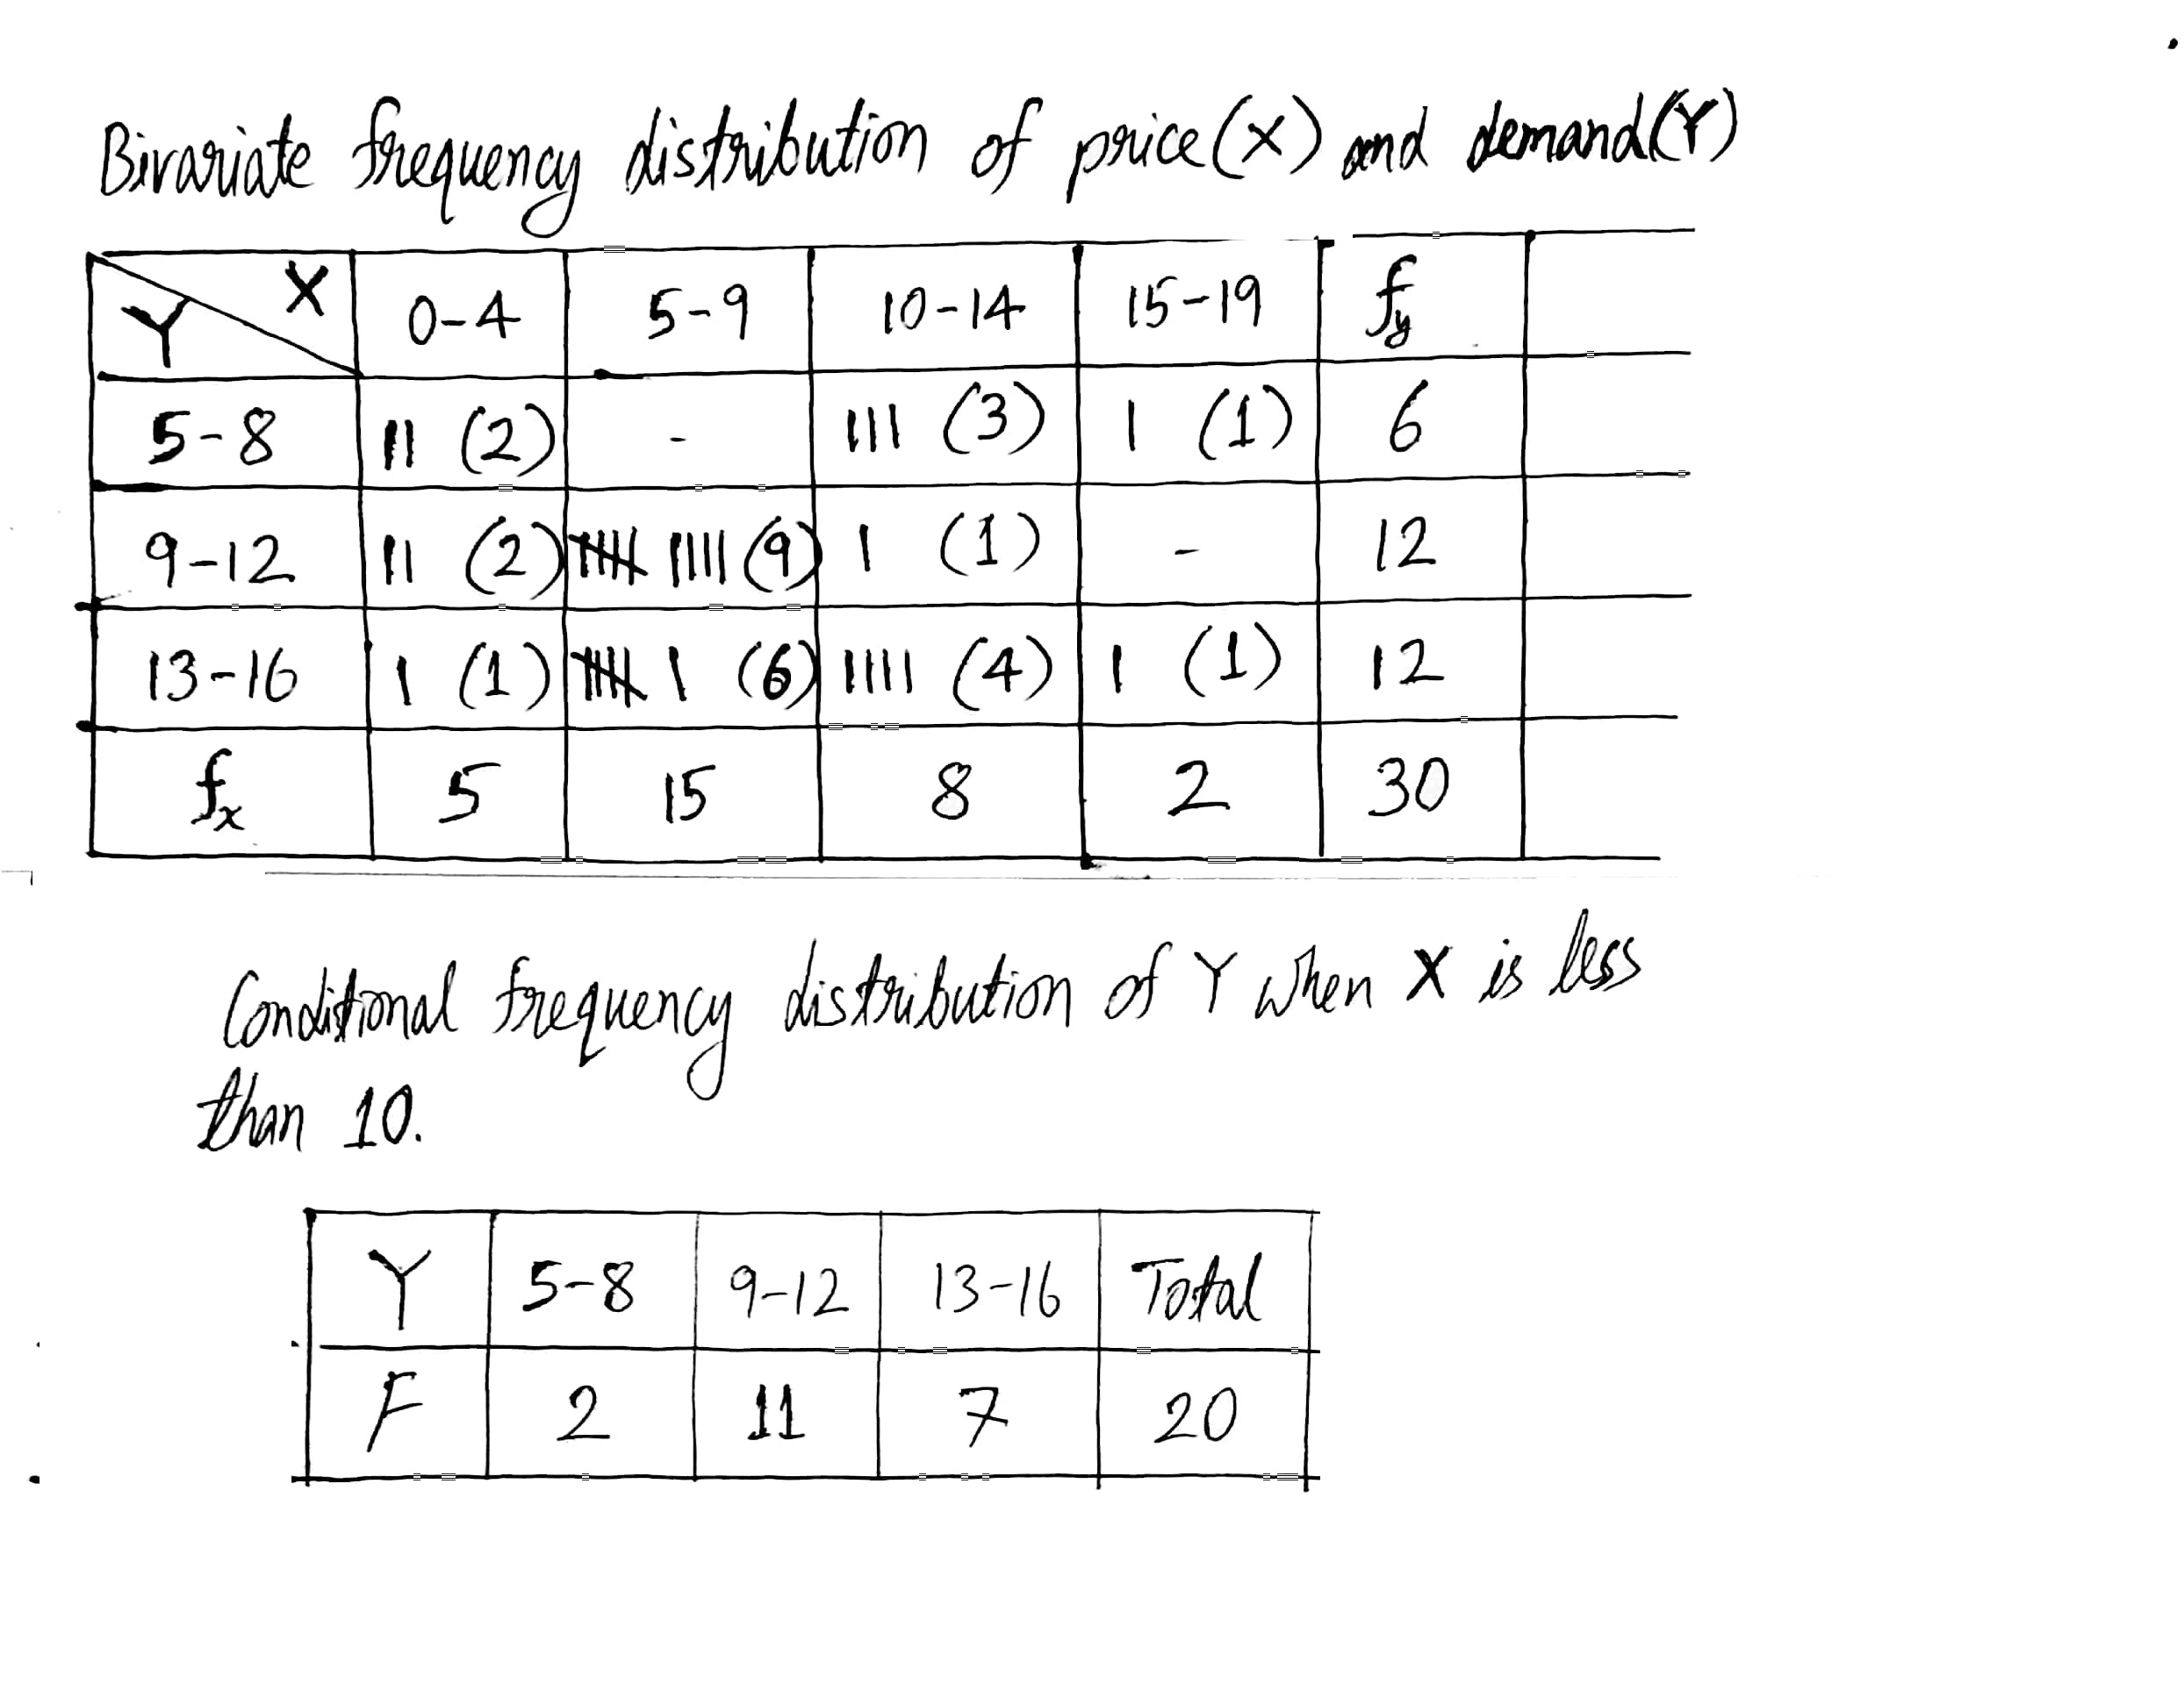
Following data gives the coded price(x) and demand(y) of a commodity.
| Price | $$5$$ | $$7$$ | $$9$$ | $$8$$ | $$10$$ | $$7$$ | $$9$$ | $$8$$ | $$5$$ | $$11$$ | $$11$$ | $$10$$ | $$2$$ | $$3$$ | $$9$$ |
| Demand | $$9$$ | $$15$$ | $$13$$ | $$15$$ | $$14$$ | $$10$$ | $$11$$ | $$14$$ | $$10$$ | $$14$$ | $$6$$ | $$14$$ | $$15$$ | $$11$$ | $$12$$ |
| Price | $$2$$ | $$4$$ | $$3$$ | $$14$$ | $$6$$ | $$10$$ | $$7$$ | $$15$$ | $$8$$ | $$6$$ | $$5$$ | $$6$$ | $$11$$ | $$14$$ | $$15$$ |
| Demand | $$6$$ | $$11$$ | $$8$$ | $$11$$ | $$10$$ | $$15$$ | $$9$$ | $$15$$ | $$13$$ | $$9$$ | $$14$$ | $$10$$ | $$7$$ | $$5$$ | $$6$$ |
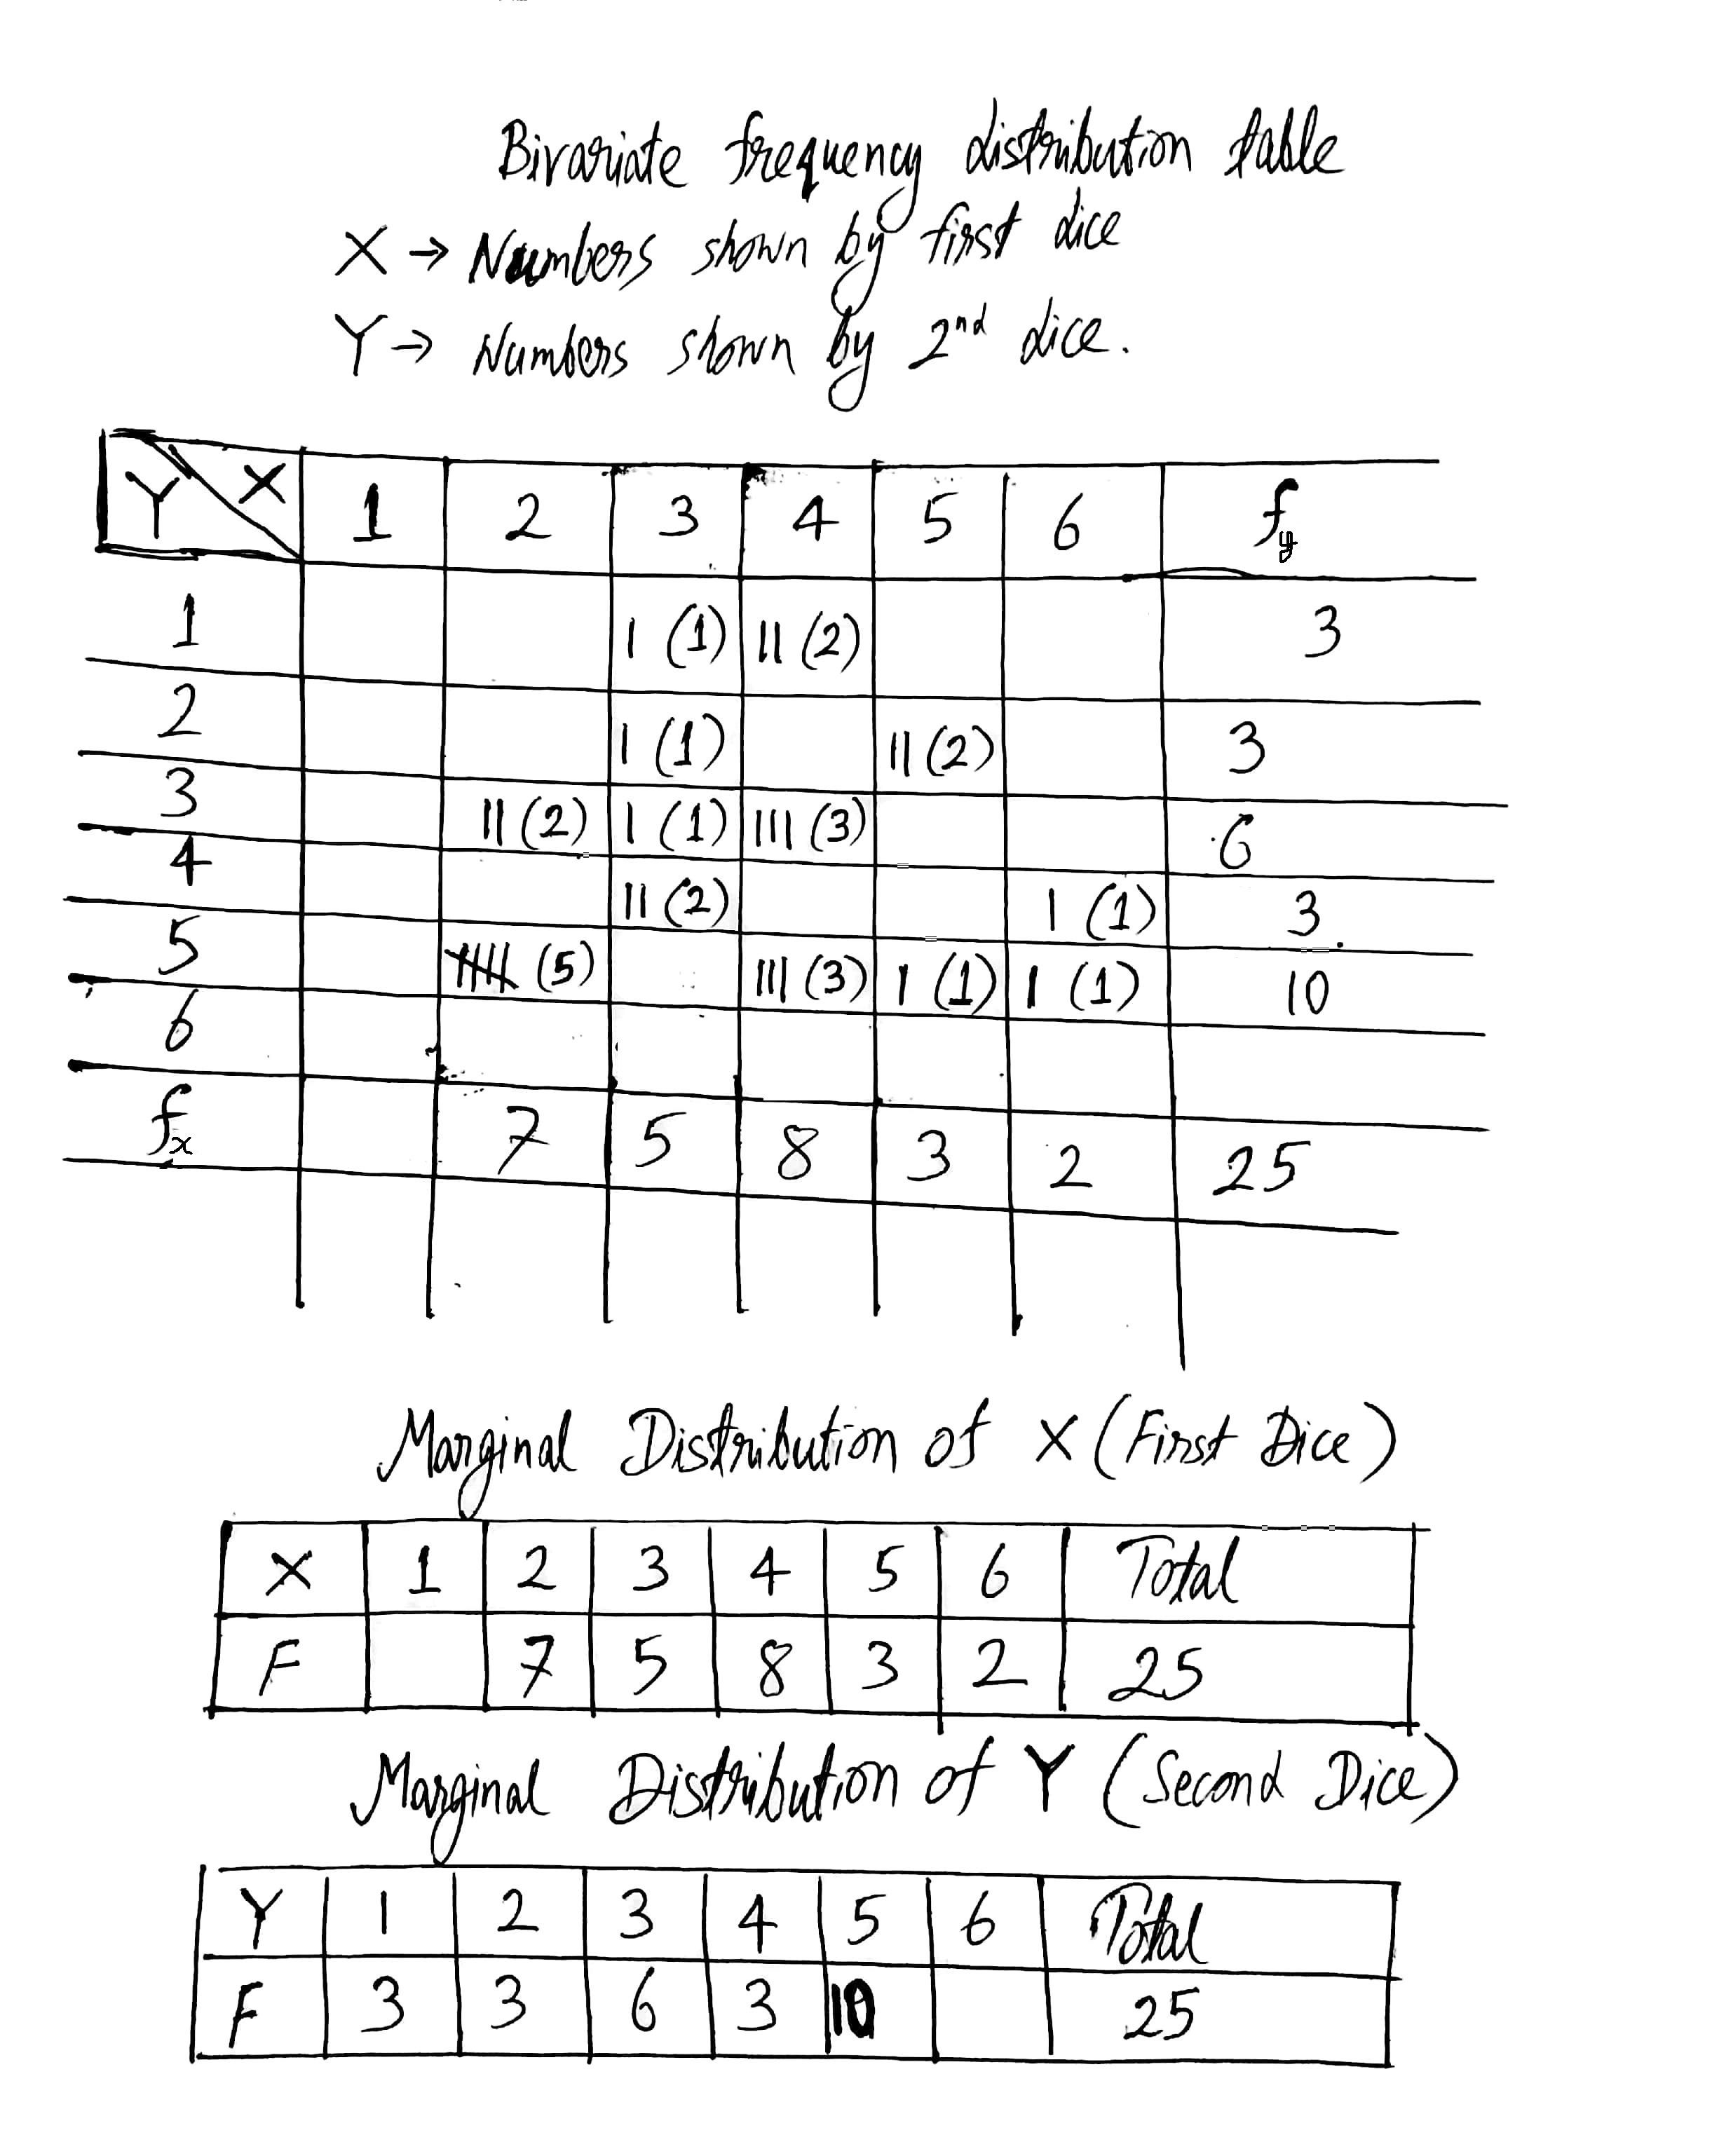
Two dice are thrown simultaneously $$25$$ times. The following pairs of observations are obtained.
$$(2, 3)$$ $$(2, 5)$$ $$(5, 5)$$ $$(4, 5)$$ $$(6, 4)$$ $$(3, 2)$$ $$(5, 2)$$ $$(4, 1)$$ $$(2, 5)$$ $$(6, 1)$$ $$(3, 1)$$ $$(3, 3)$$ $$(4, 3)$$ $$(4, 5)$$ $$(2, 5)$$ $$(3, 4)$$ $$(2, 5)$$ $$(3, 4)$$ $$(2, 5)$$ $$(4, 3)$$ $$(5, 2)$$ $$(4, 5)$$ $$(4, 3)$$ $$(2, 3)$$ $$(4, 1)$$.
Prepare a bivariate frequency distribution table for the given data. Also obtain the marginal distributions.
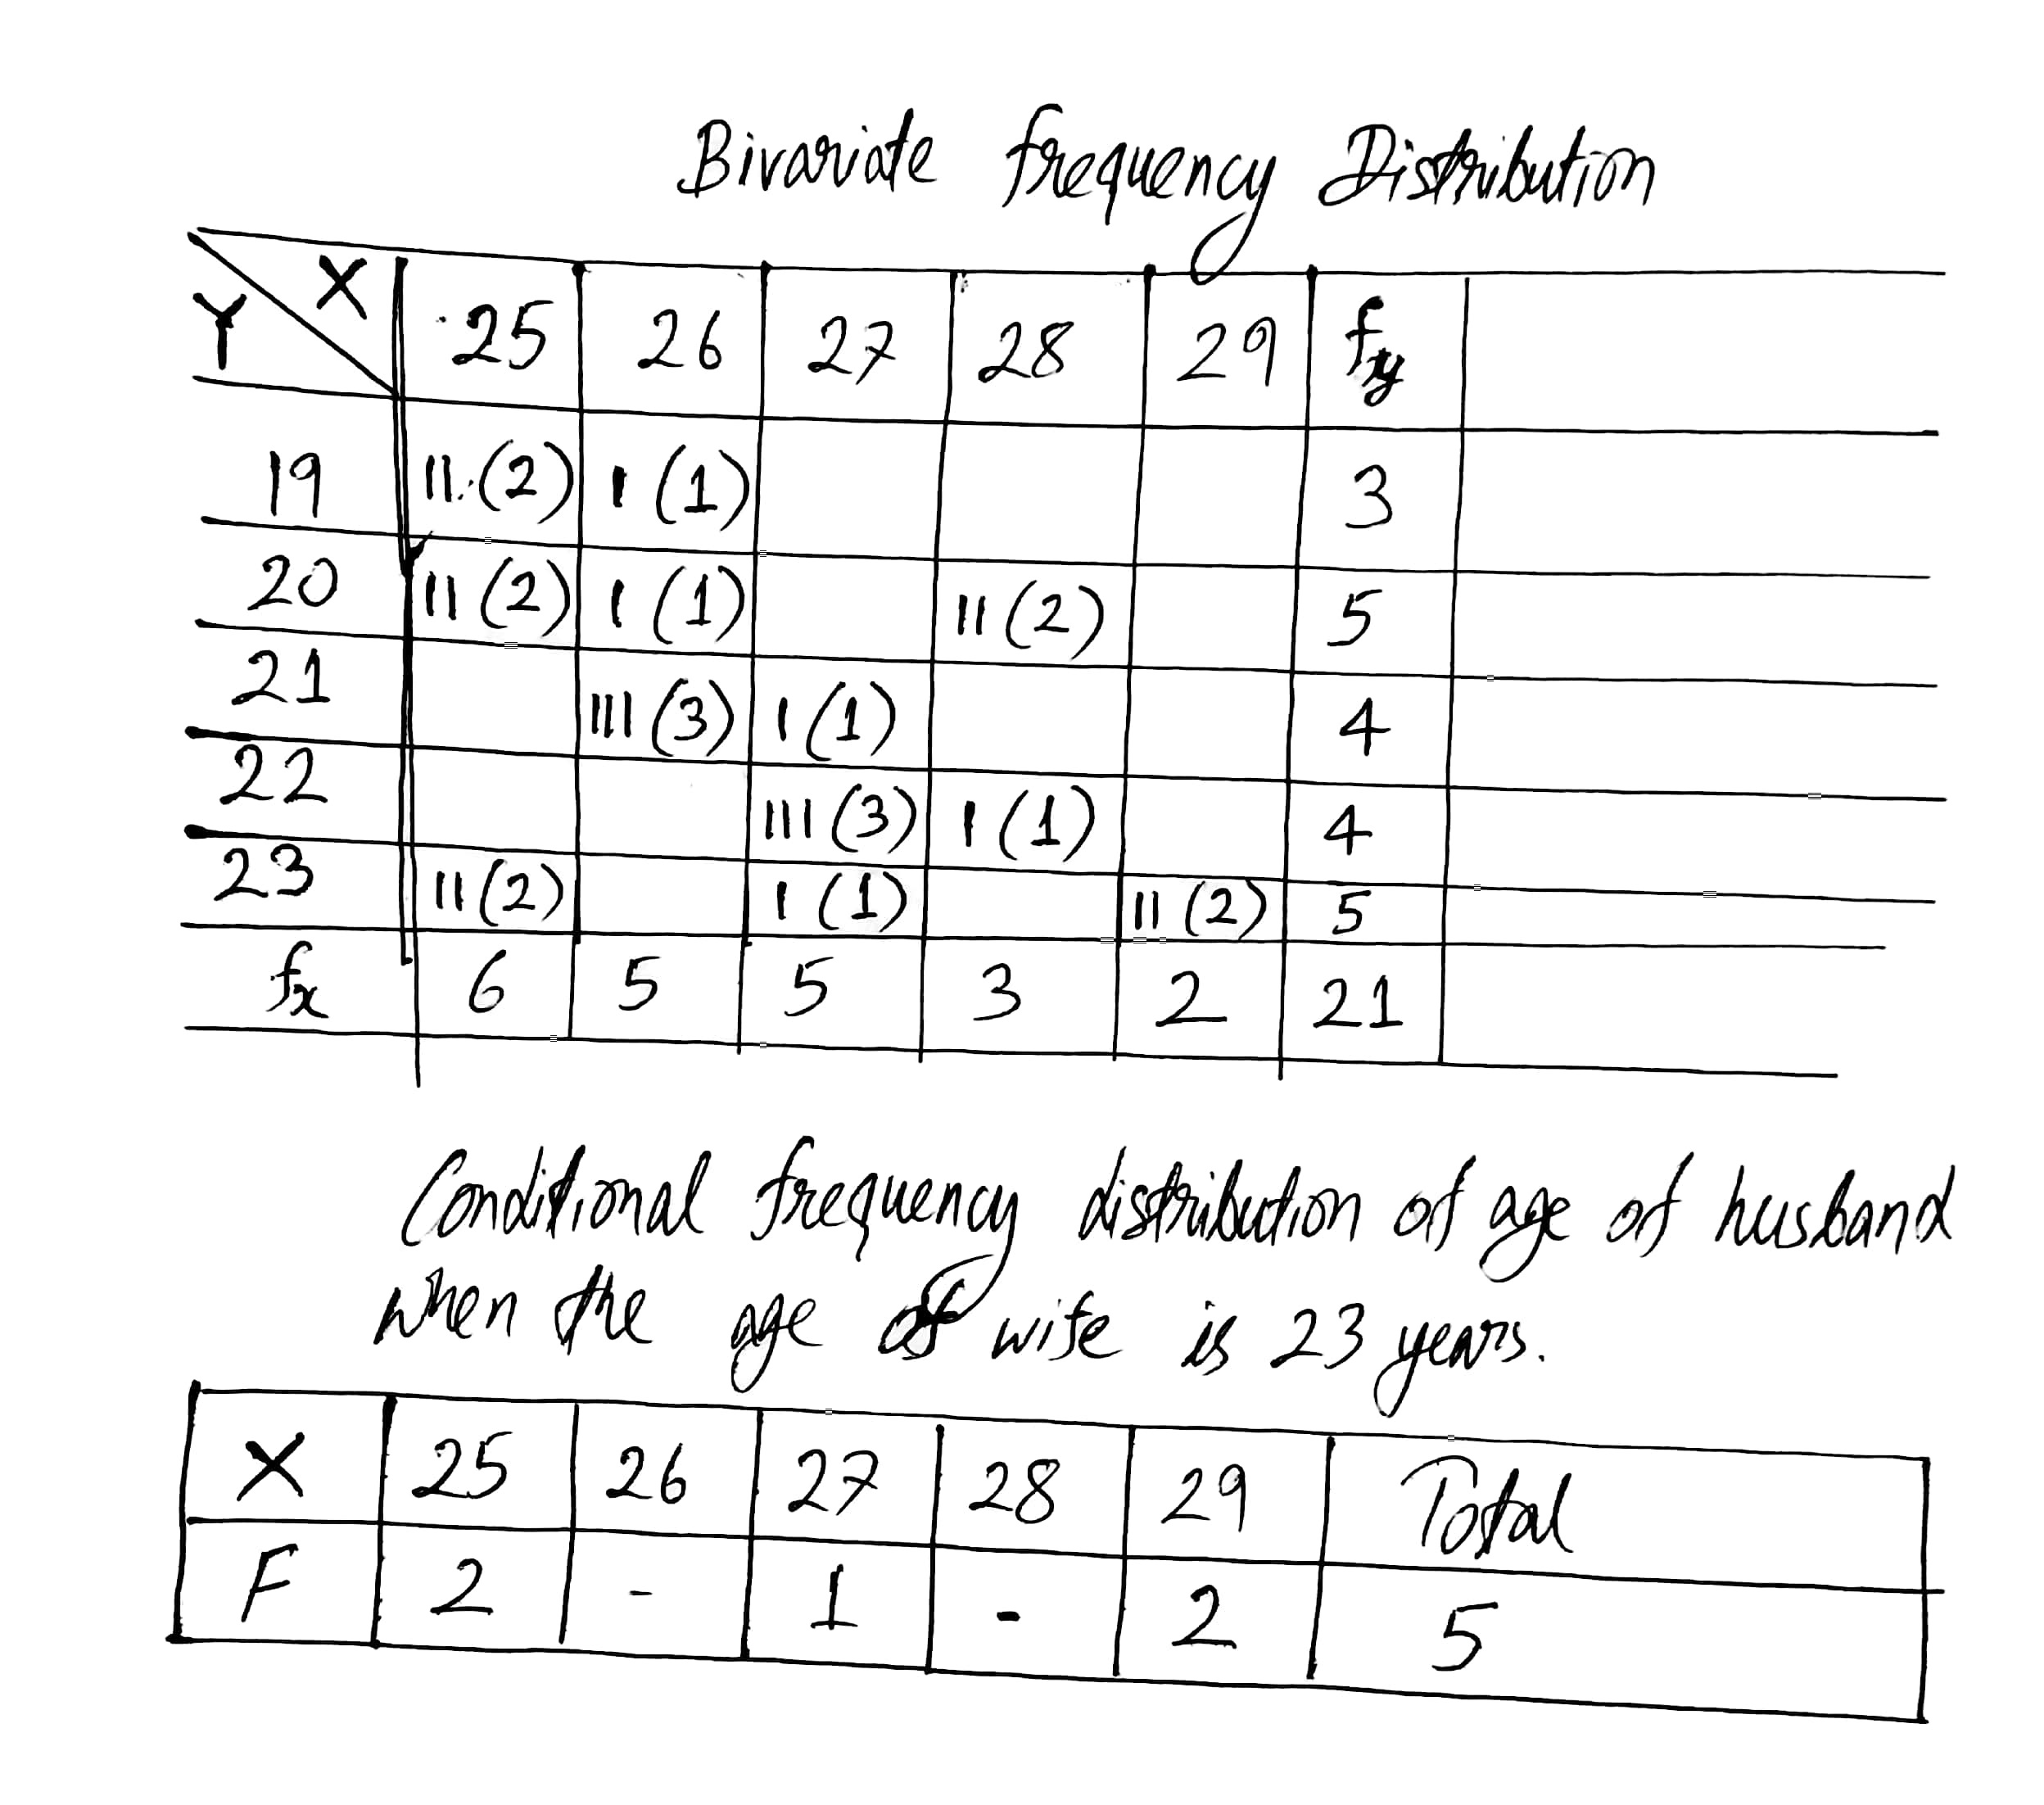
Following data gives the age of husbands(X) and age of wives(Y) in years. Construct a bivariate frequency distribution table and find the marginal distributions.
| X | $$27$$ | $$25$$ | $$28$$ | $$26$$ | $$29$$ | $$27$$ | $$28$$ | $$26$$ | $$25$$ | $$25$$ | $$27$$ |
| Y | $$21$$ | $$20$$ | $$20$$ | $$21$$ | $$23$$ | $$22$$ | $$20$$ | $$20$$ | $$19$$ | $$19$$ | $$23$$ |
| X | $$26$$ | $$29$$ | $$25$$ | $$27$$ | $$26$$ | $$25$$ | $$28$$ | $$25$$ | $$27$$ | $$26$$ | |
| Y | $$19$$ | $$23$$ | $$23$$ | $$22$$ | $$21$$ | $$20$$ | $$22$$ | $$23$$ | $$22$$ | $$21$$ |
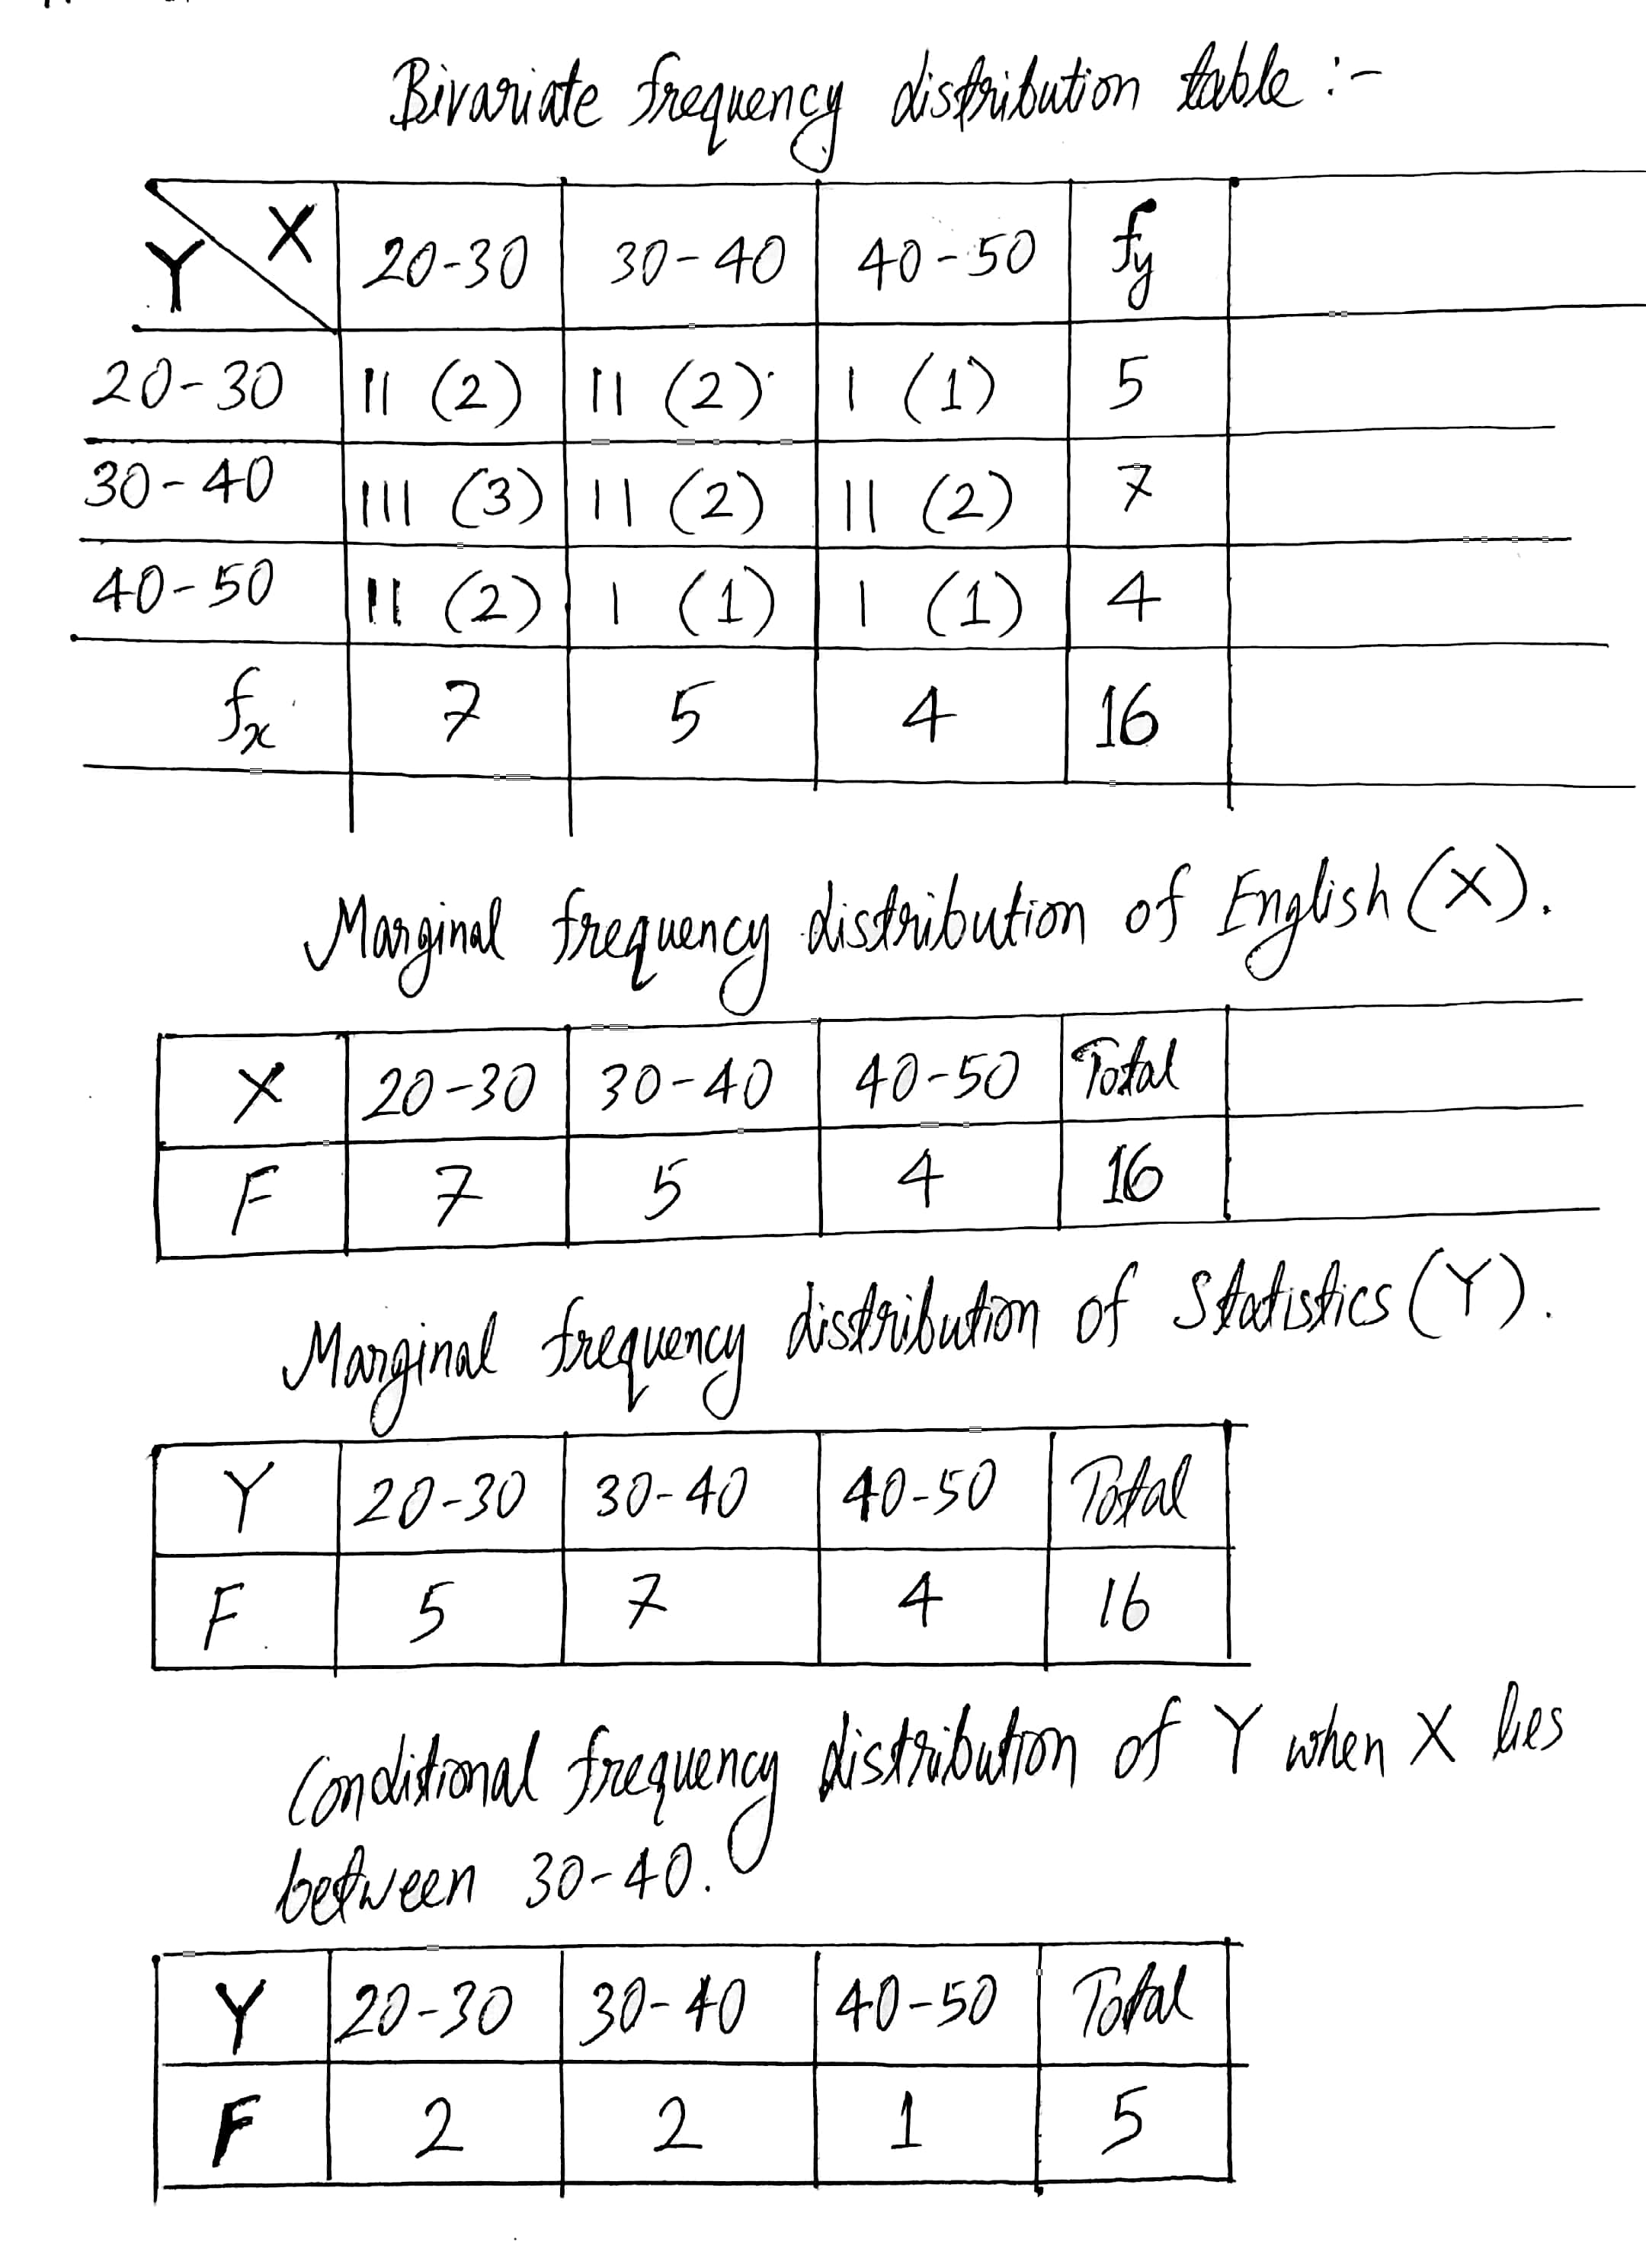
Construct a bivariate frequency distribution table of the marks obtained by students in English(X) and Statistics(Y).
| Marks in Statistics(X) | $$37$$ | $$20$$ | $$46$$ | $$28$$ | $$35$$ | $$26$$ | $$41$$ | $$48$$ | $$32$$ | $$23$$ | $$20$$ | $$39$$ | $$47$$ | $$33$$ | $$27$$ | $$26$$ |
| Marks in English(Y) | $$30$$ | $$32$$ | $$41$$ | $$33$$ | $$29$$ | $$43$$ | $$30$$ | $$21$$ | $$44$$ | $$38$$ | $$47$$ | $$24$$ | $$32$$ | $$31$$ | $$20$$ | $$21$$ |
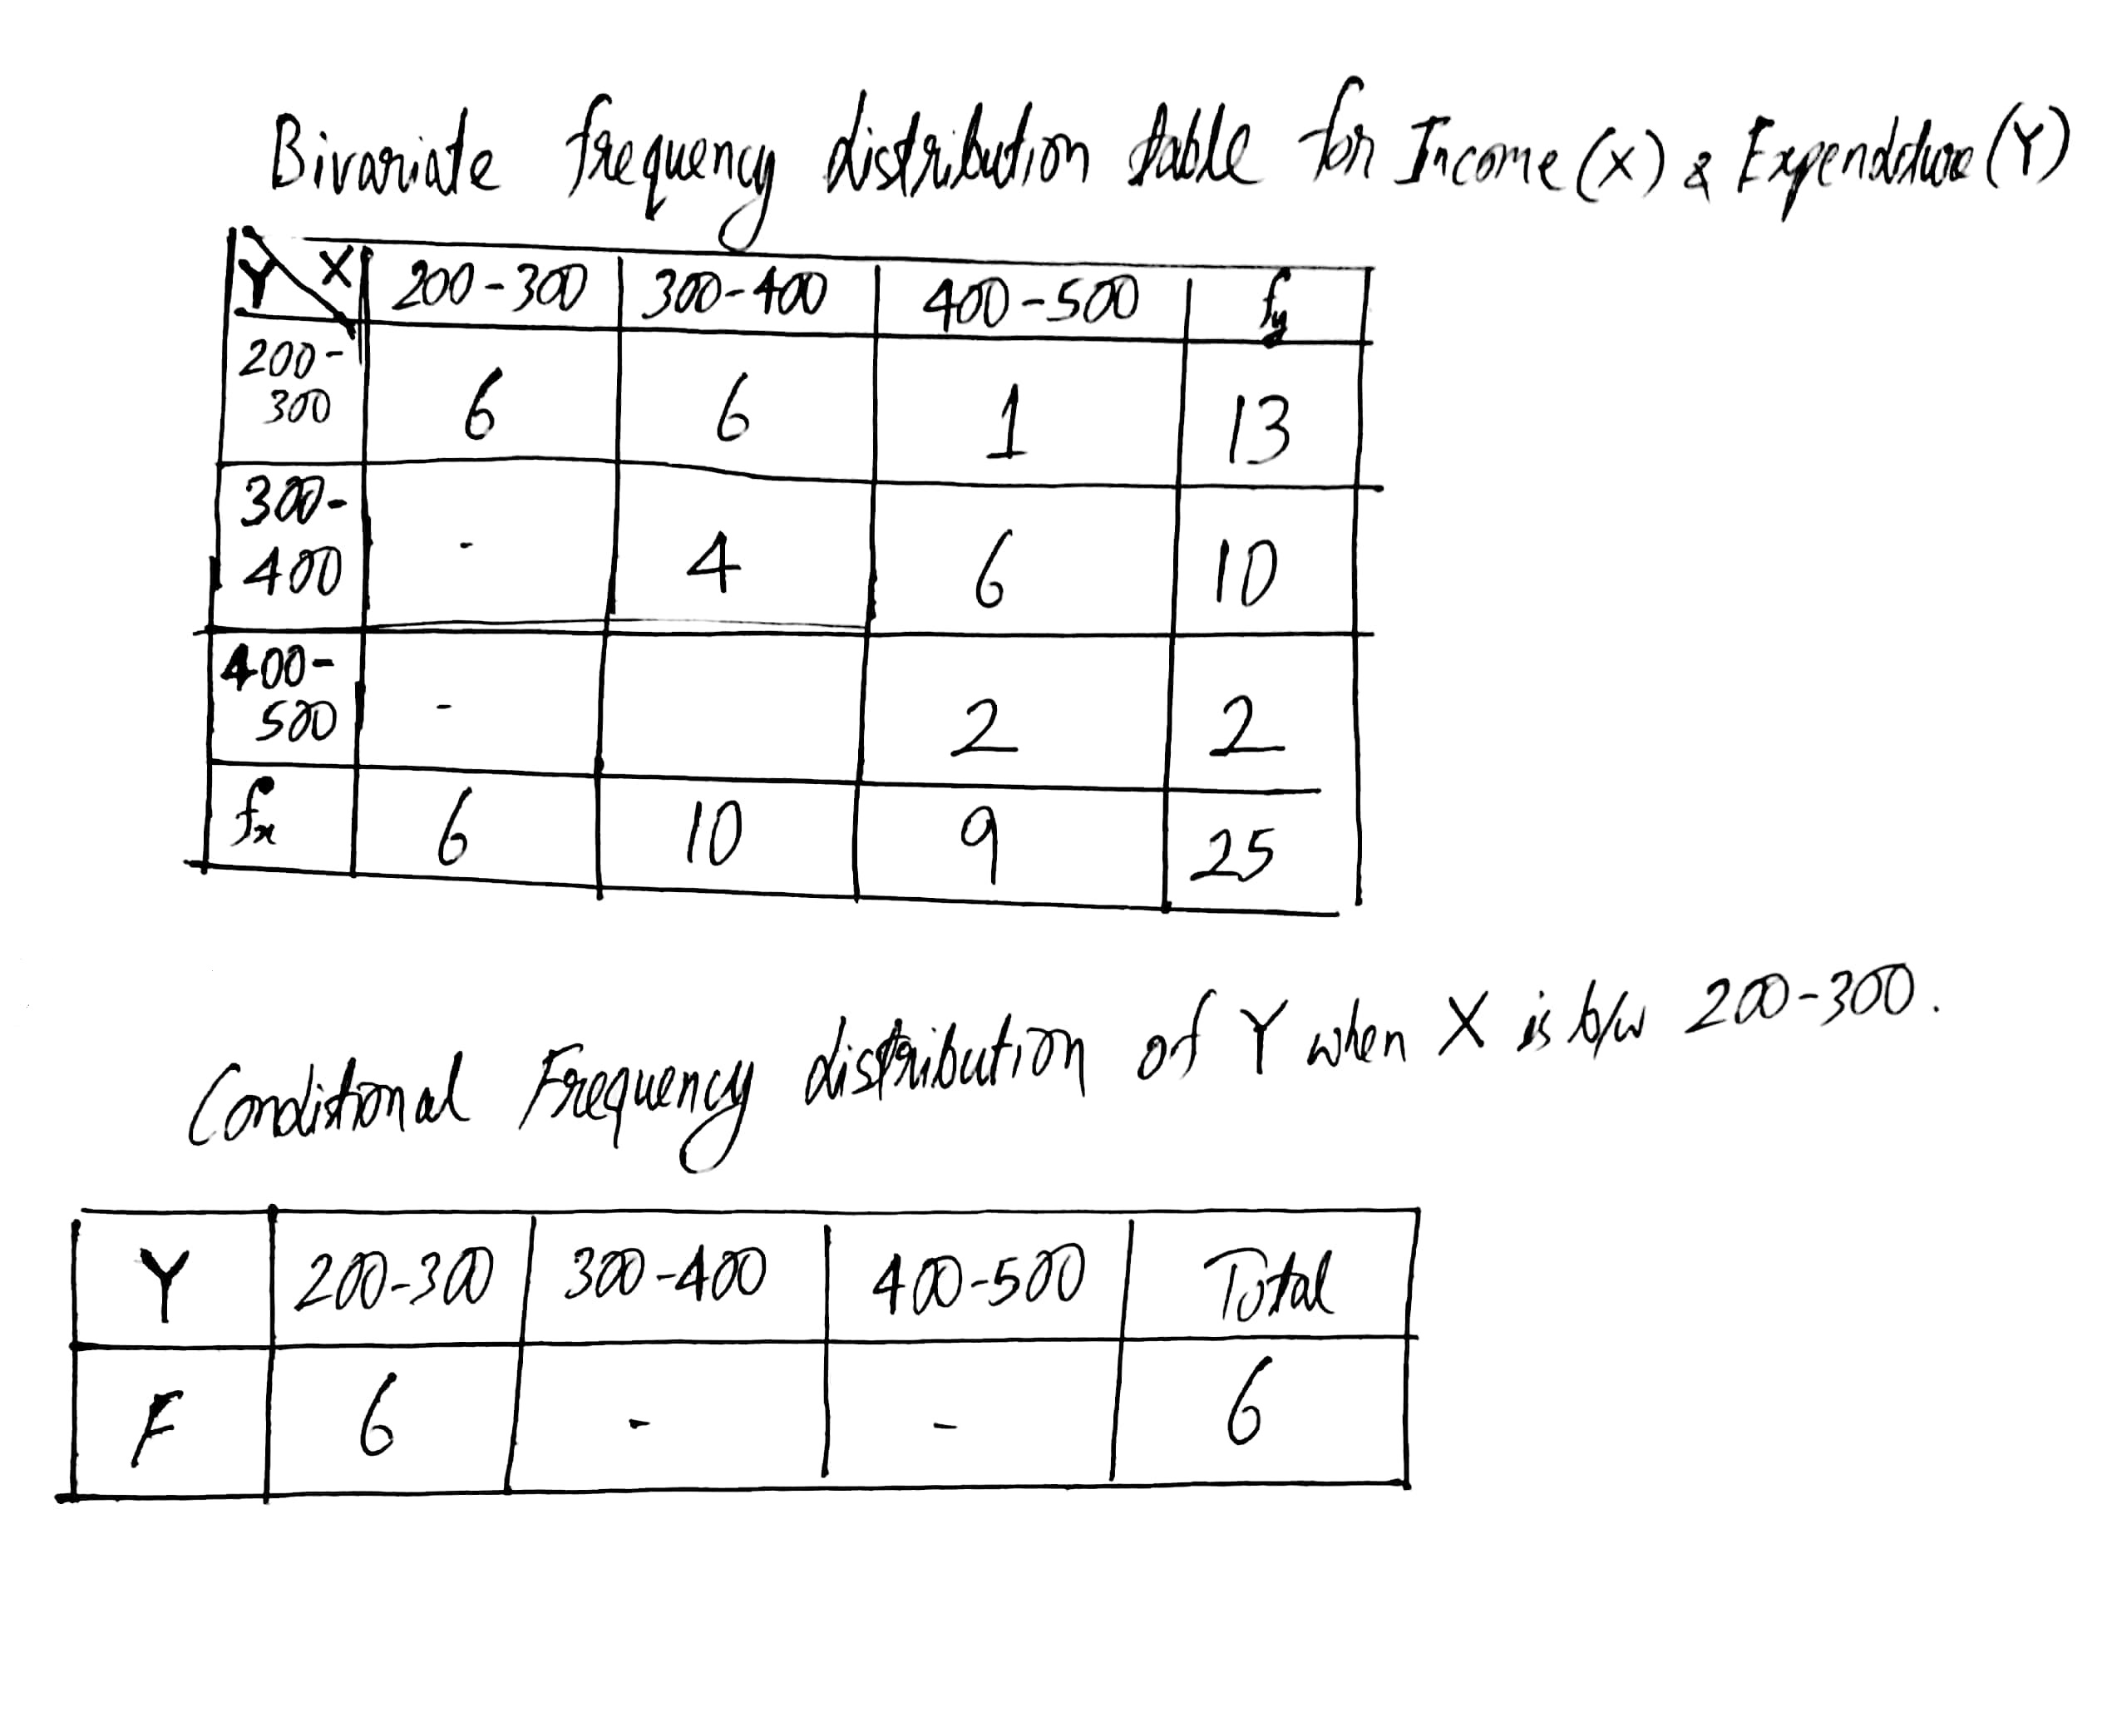
Following table gives income(X) and expenditure(Y) of $$25$$ families.
Find conditional frequency distribution of Y when X is between $$200-300$$.

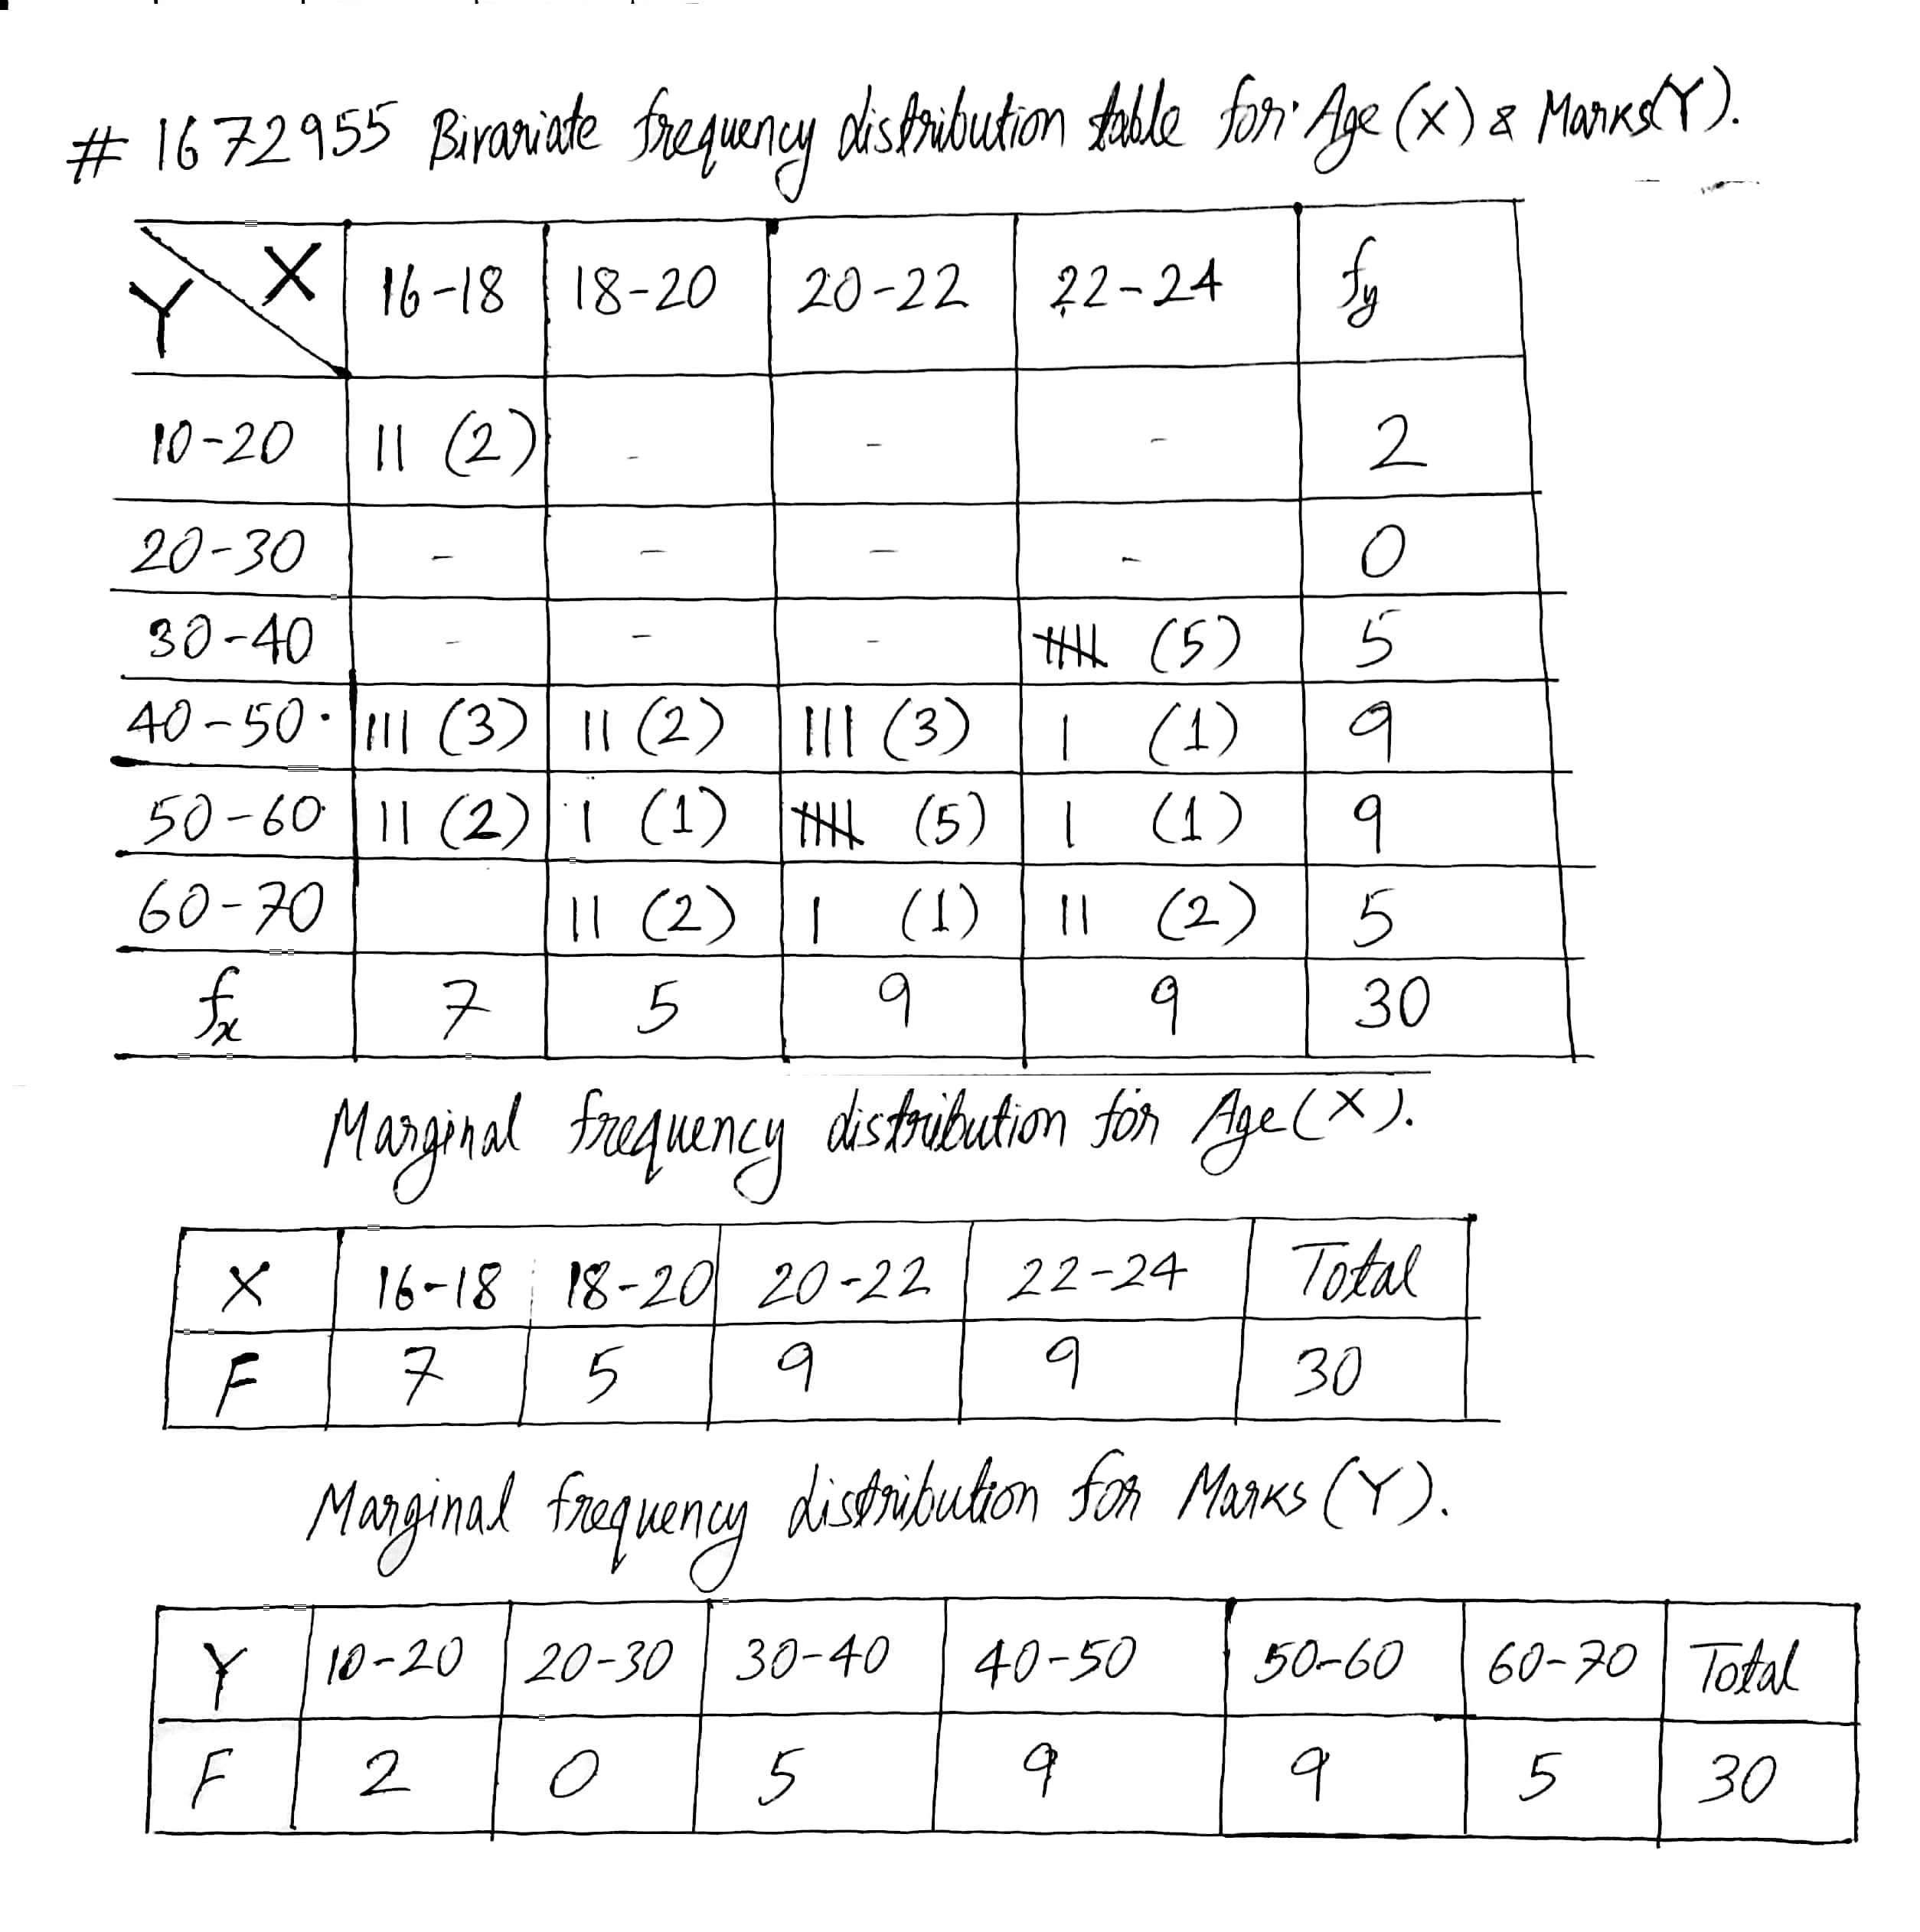
Following data gives the age in years and marks obtained by $$30$$ students in an intelligence test.
| Age | $$16$$ | $$17$$ | $$22$$ | $$19$$ | $$21$$ | $$16$$ |
| Marks | $$16$$ | $$19$$ | $$39$$ | $$50$$ | $$48$$ | $$41$$ |
| Age | $$21$$ | $$20$$ | $$20$$ | $$23$$ | $$22$$ | $$19$$ |
| Marks | $$59$$ | $$44$$ | $$42$$ | $$62$$ | $$37$$ | $$67$$ |
| Age | $$23$$ | $$20$$ | $$22$$ | $$22$$ | $$23$$ | $$22$$ |
| Marks | $$45$$ | $$57$$ | $$35$$ | $$37$$ | $$38$$ | $$56$$ |
| Age | $$17$$ | $$18$$ | $$16$$ | $$21$$ | $$19$$ | $$20$$ |
| Marks | $$54$$ | $$61$$ | $$47$$ | $$67$$ | $$49$$ | $$56$$ |
| Age | $$17$$ | $$18$$ | $$23$$ | $$21$$ | $$20$$ | $$16$$ |
| Marks | $$51$$ | $$42$$ | $$65$$ | $$56$$ | $$52$$ | $$48$$ |
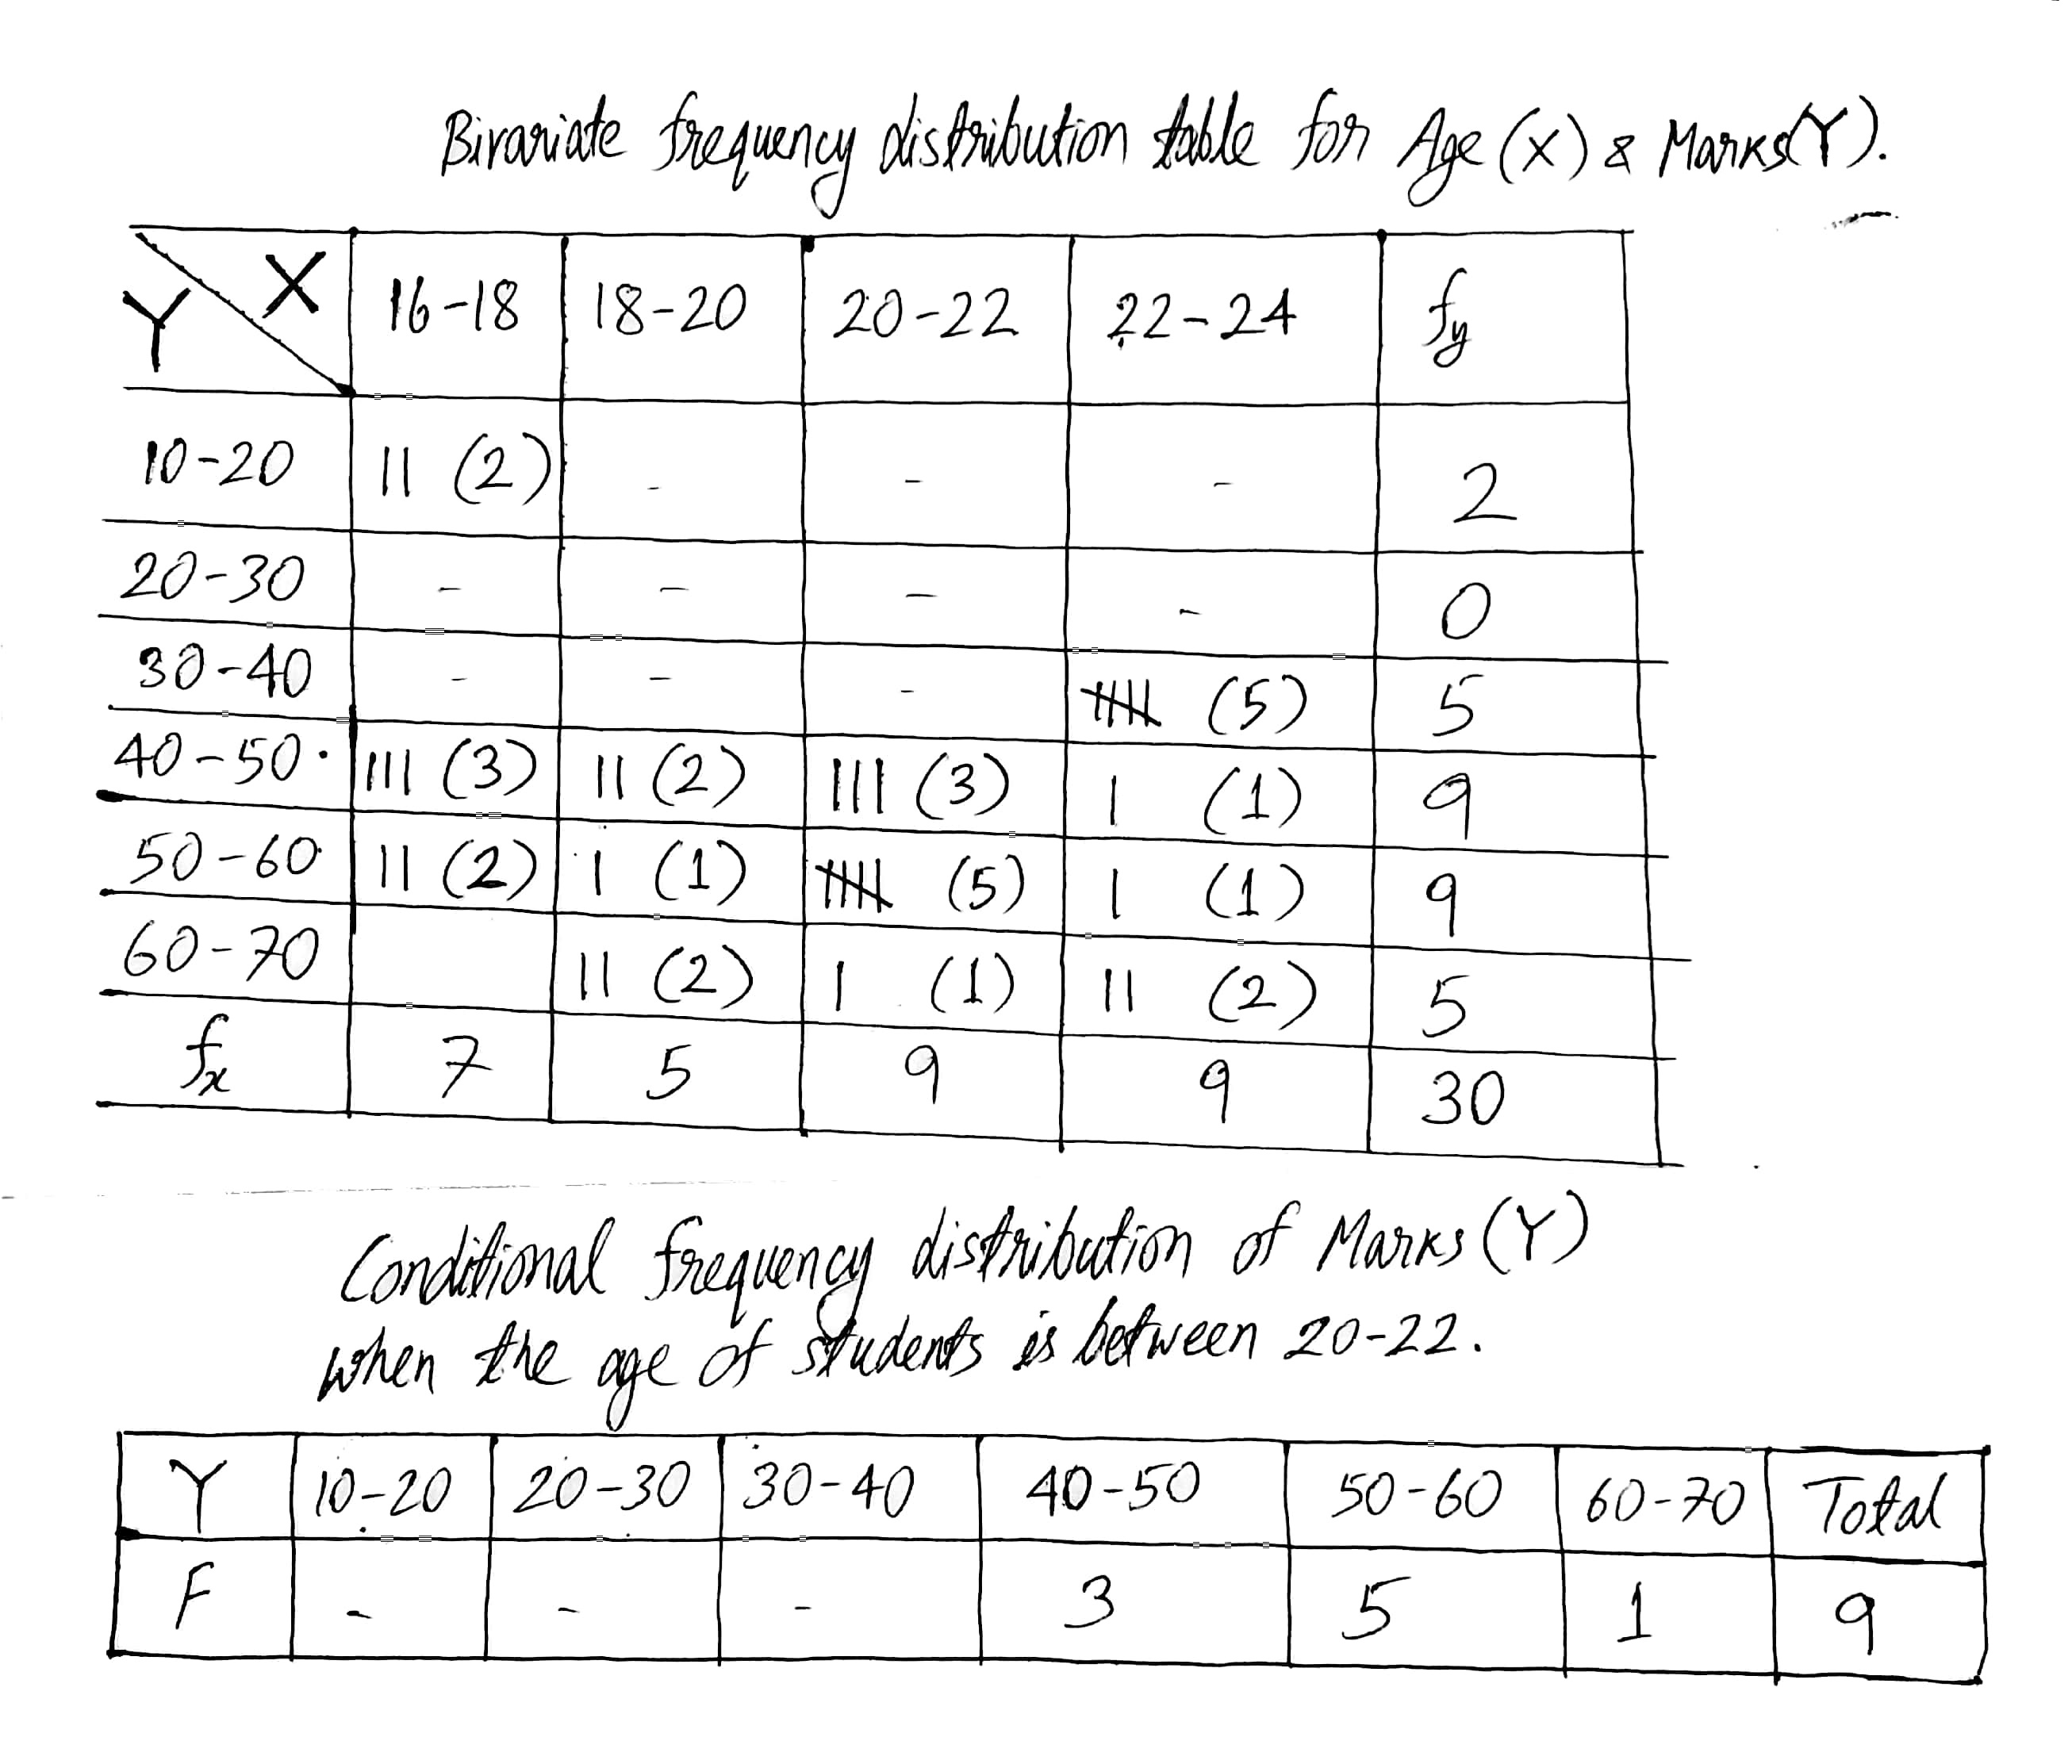
Find marginal frequency distributions.
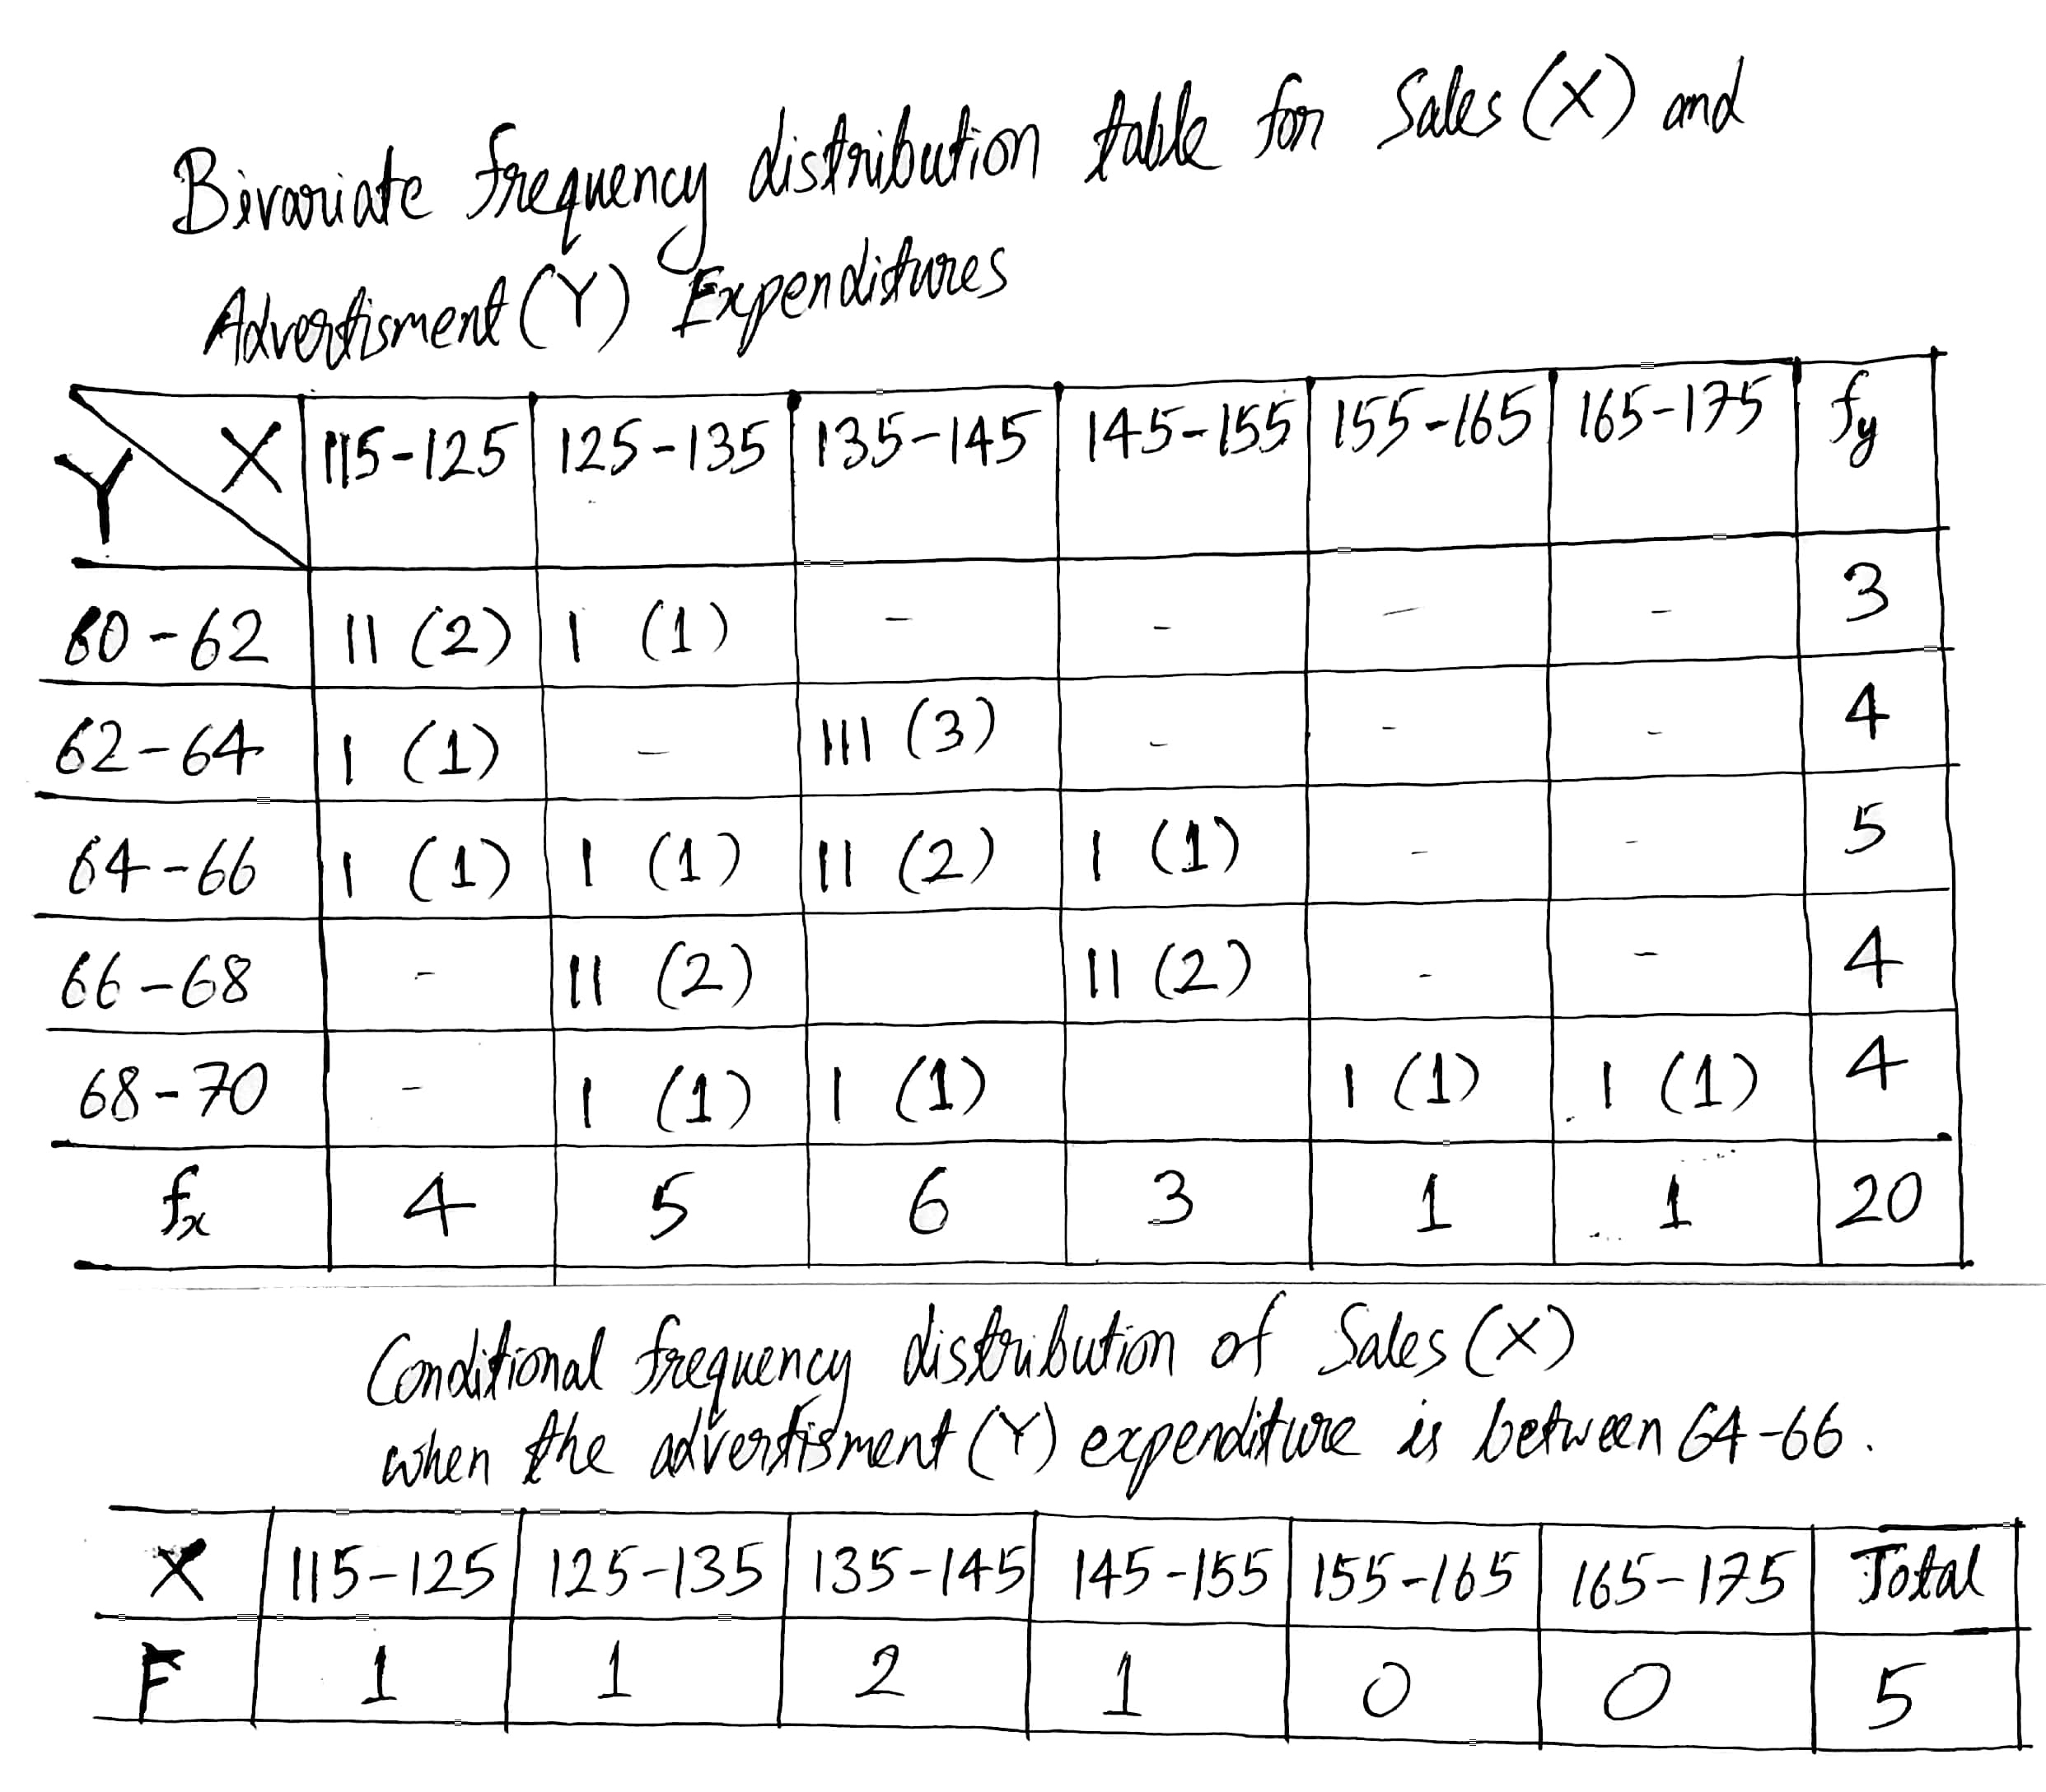
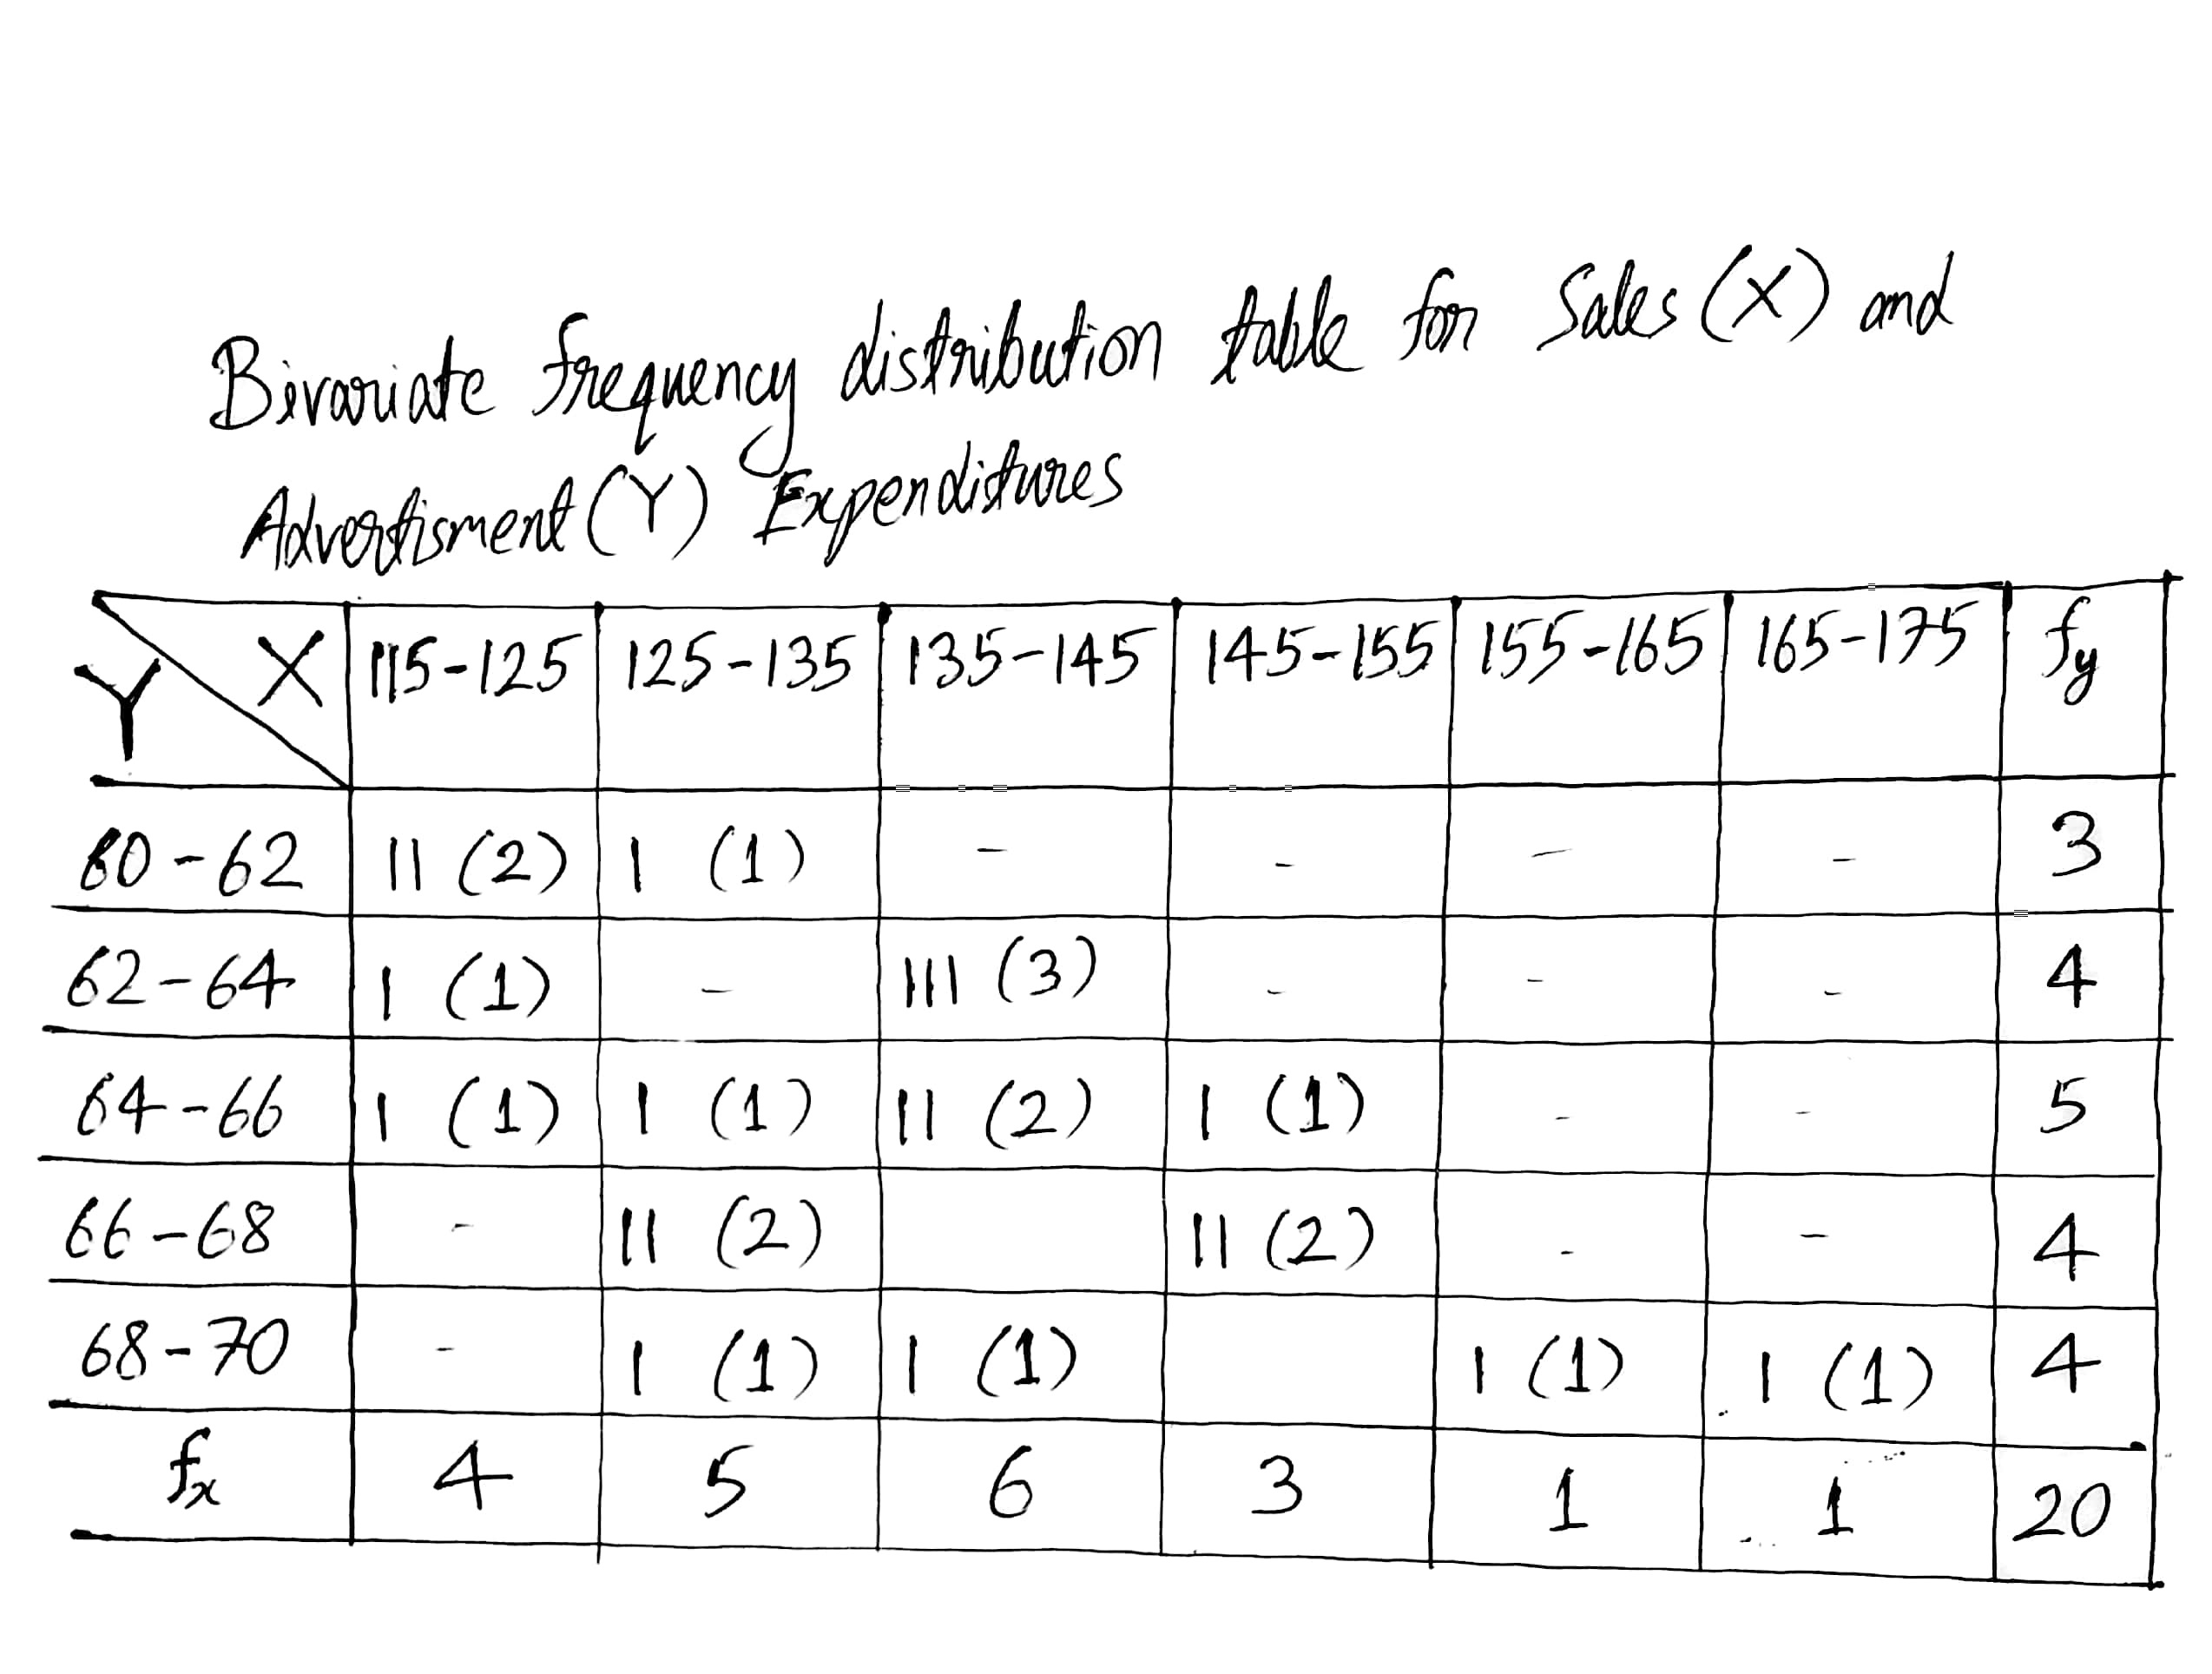
Conditional frequency distribution of Sales when the advertisement expenditure is between $$64-66$$. (Thousand Rs.)
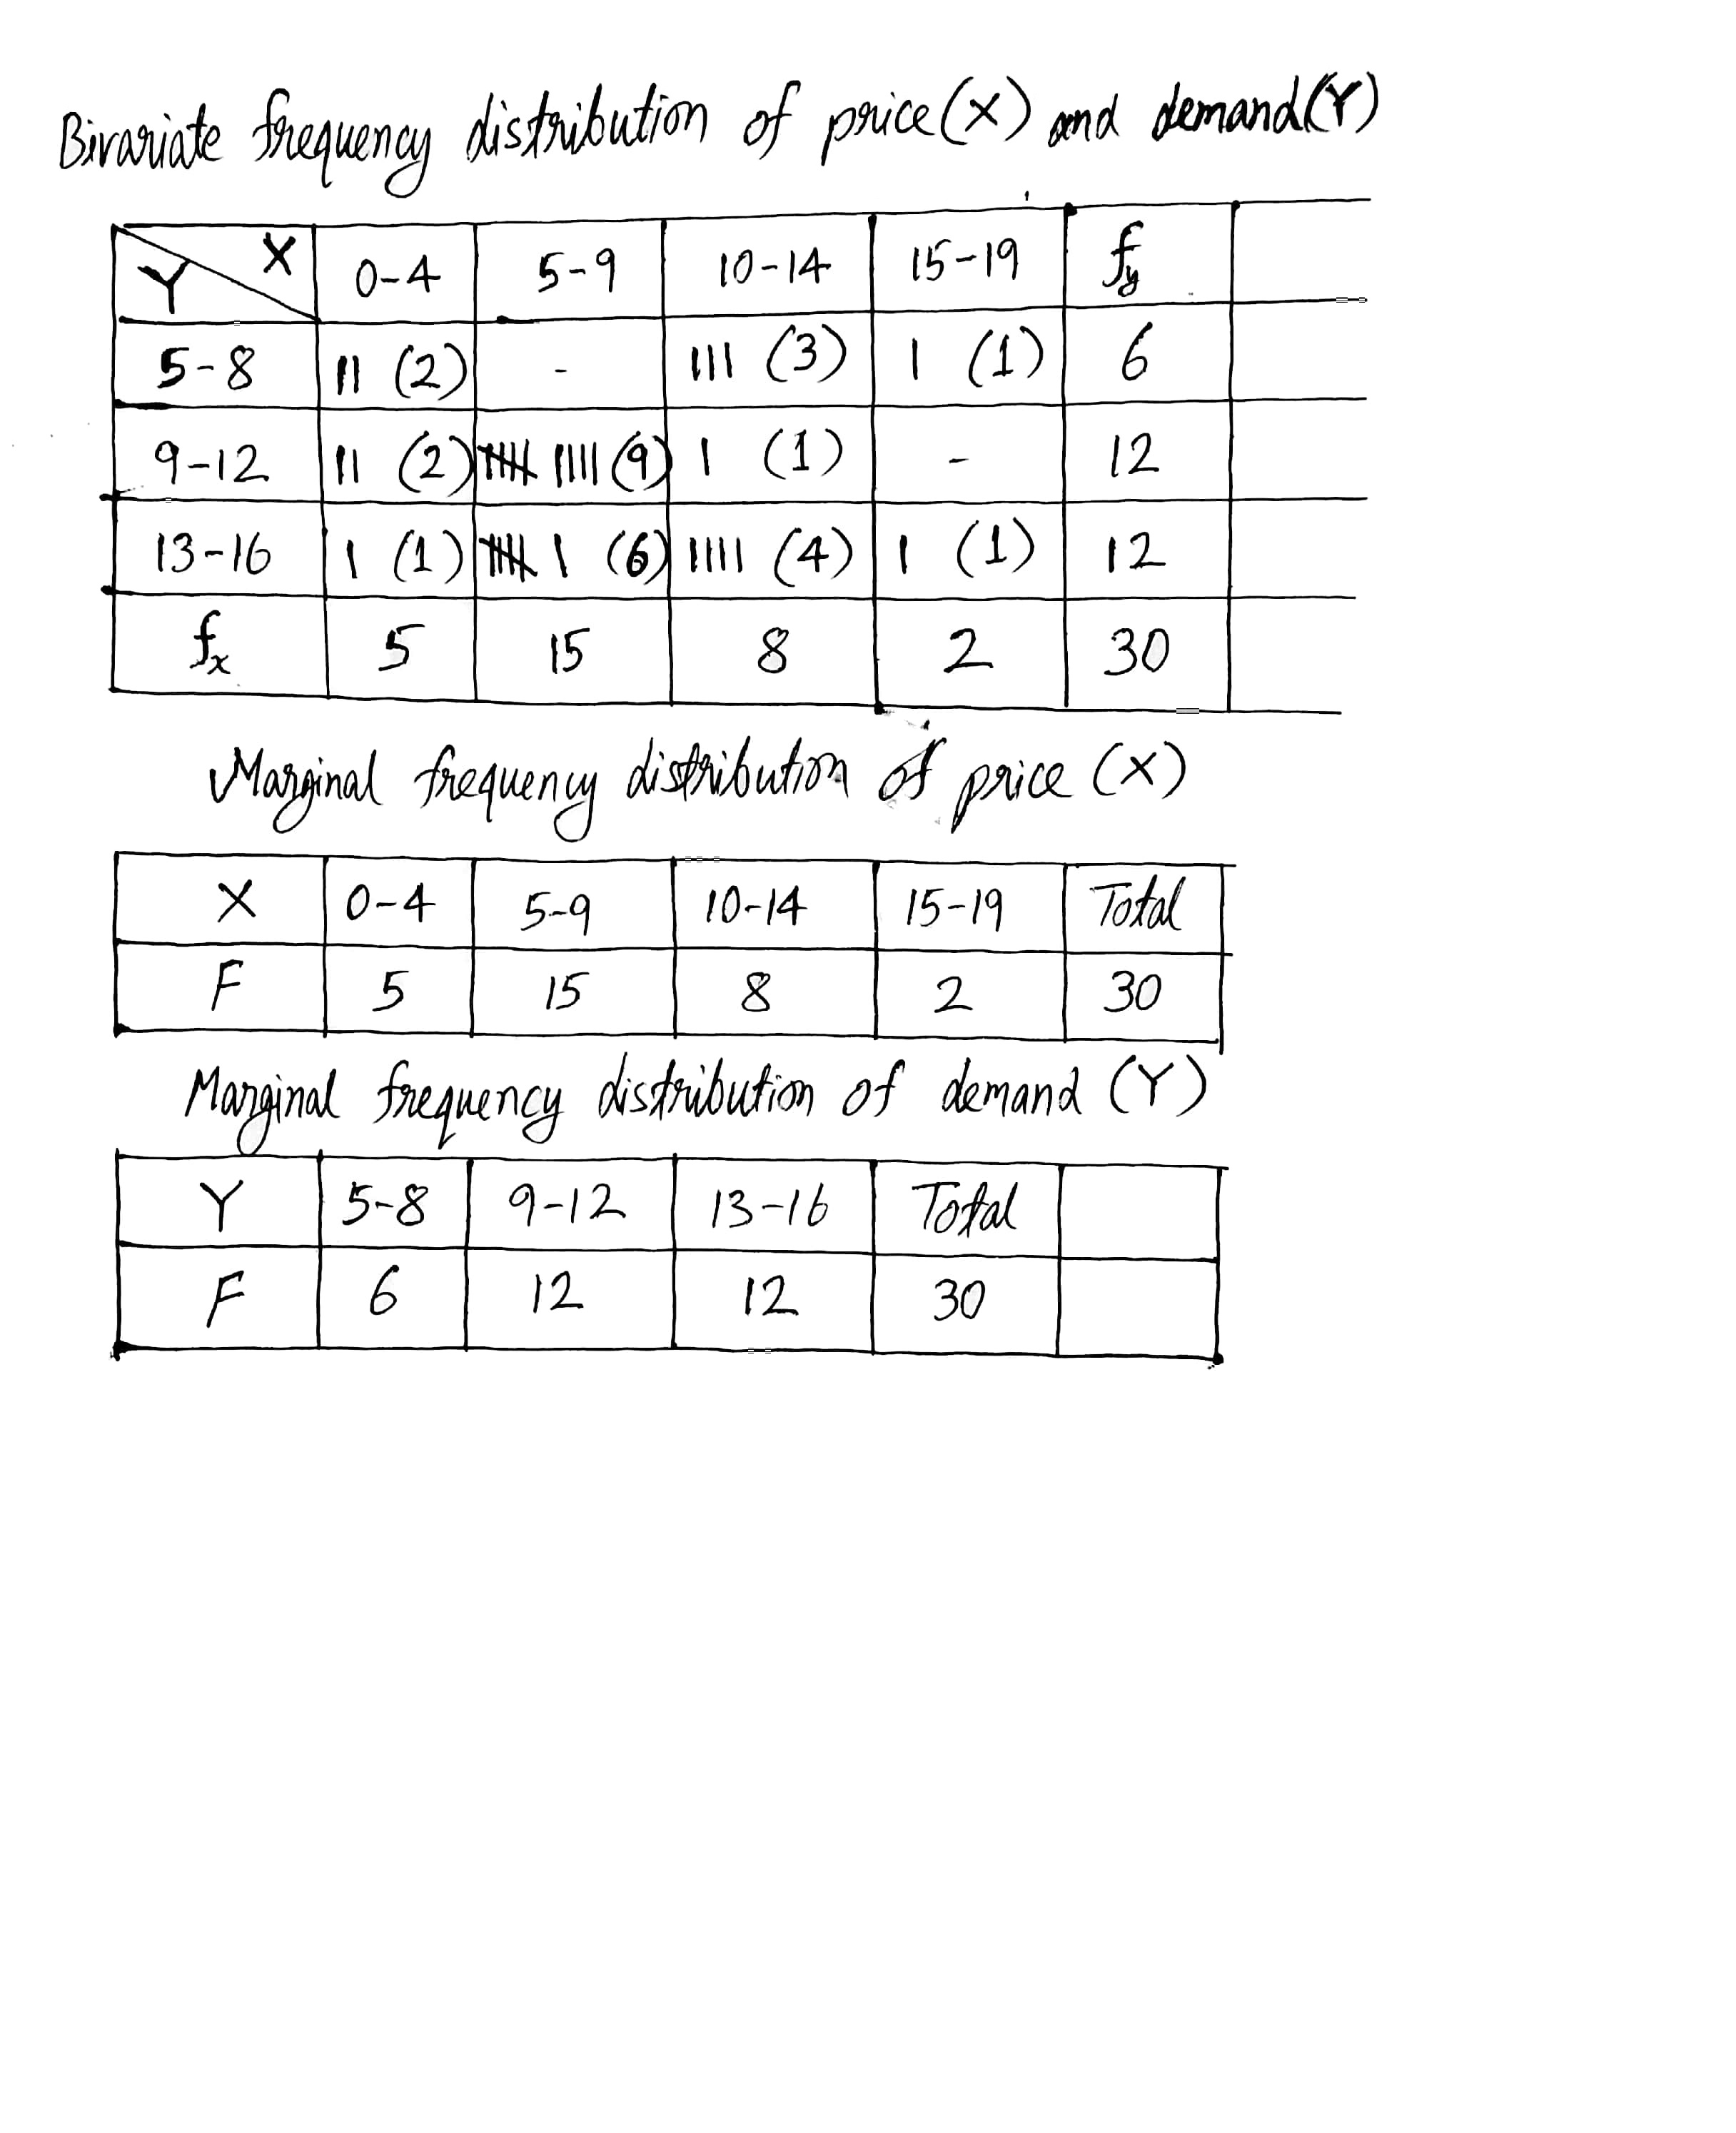
Following data gives the coded price(x) and demand(y) of a commodity.
| Price | $$5$$ | $$7$$ | $$9$$ | $$8$$ | $$10$$ | $$7$$ | $$9$$ | $$8$$ | $$5$$ | $$11$$ | $$11$$ | $$10$$ | $$2$$ | $$3$$ | $$9$$ |
| Demand | $$9$$ | $$15$$ | $$13$$ | $$15$$ | $$14$$ | $$10$$ | $$11$$ | $$14$$ | $$10$$ | $$14$$ | $$6$$ | $$14$$ | $$15$$ | $$11$$ | $$12$$ |
| Price | $$2$$ | $$4$$ | $$3$$ | $$14$$ | $$6$$ | $$10$$ | $$7$$ | $$15$$ | $$8$$ | $$6$$ | $$5$$ | $$6$$ | $$11$$ | $$14$$ | $$15$$ |
| Demand | $$6$$ | $$11$$ | $$8$$ | $$11$$ | $$10$$ | $$15$$ | $$9$$ | $$15$$ | $$13$$ | $$9$$ | $$14$$ | $$10$$ | $$7$$ | $$5$$ | $$6$$ |
Also find conditional frequency distribution of y when x is less than $$10$$.
Prepare a frequency table of the following ages (in years) of 30 students of class VIII in your school:
$$13,14,13,12,14,13,14,15,13,14,13,14,16,12,14$$
$$13,14,15,16,13,14,13,12,17,13,12,13,13,13,14$$
Following figures relate the weekly wages (in Rs.) of 15 workers in a factory:
$$300,250,200,250,200,150,350,200,250,200,150,300,150,200,250$$
Prepare a frequency table.
Which mark is occurring more frequently?
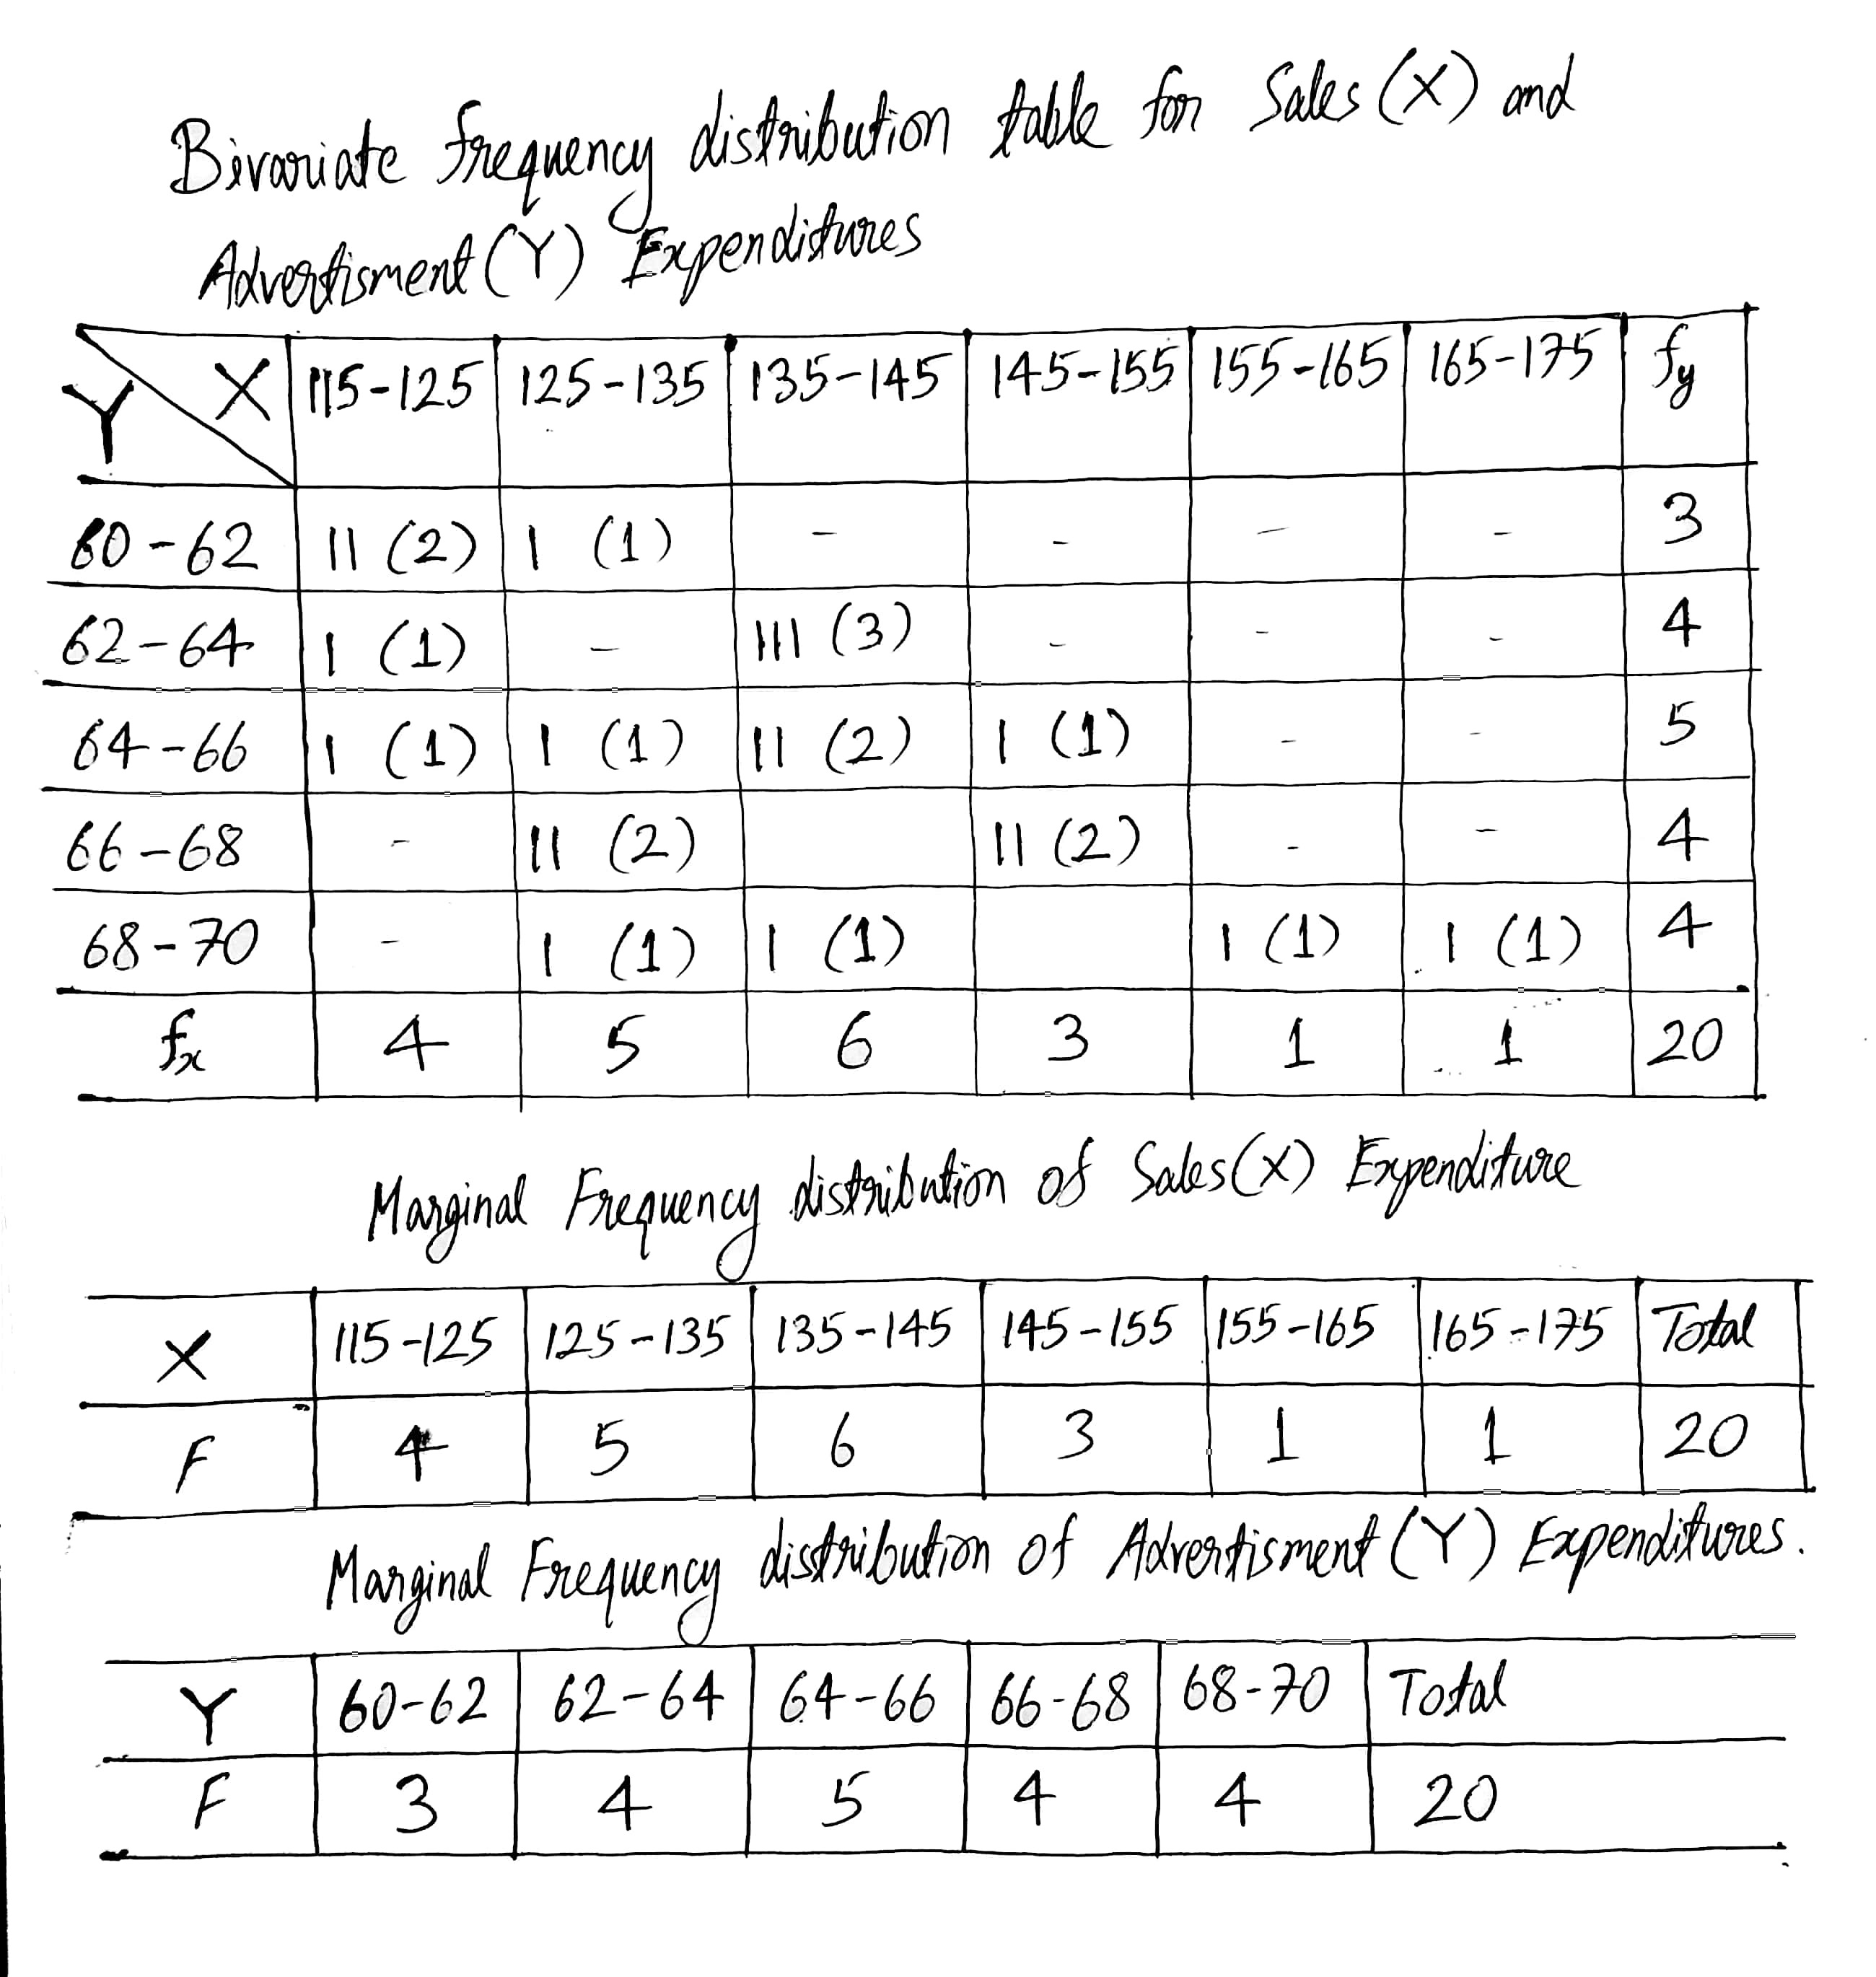
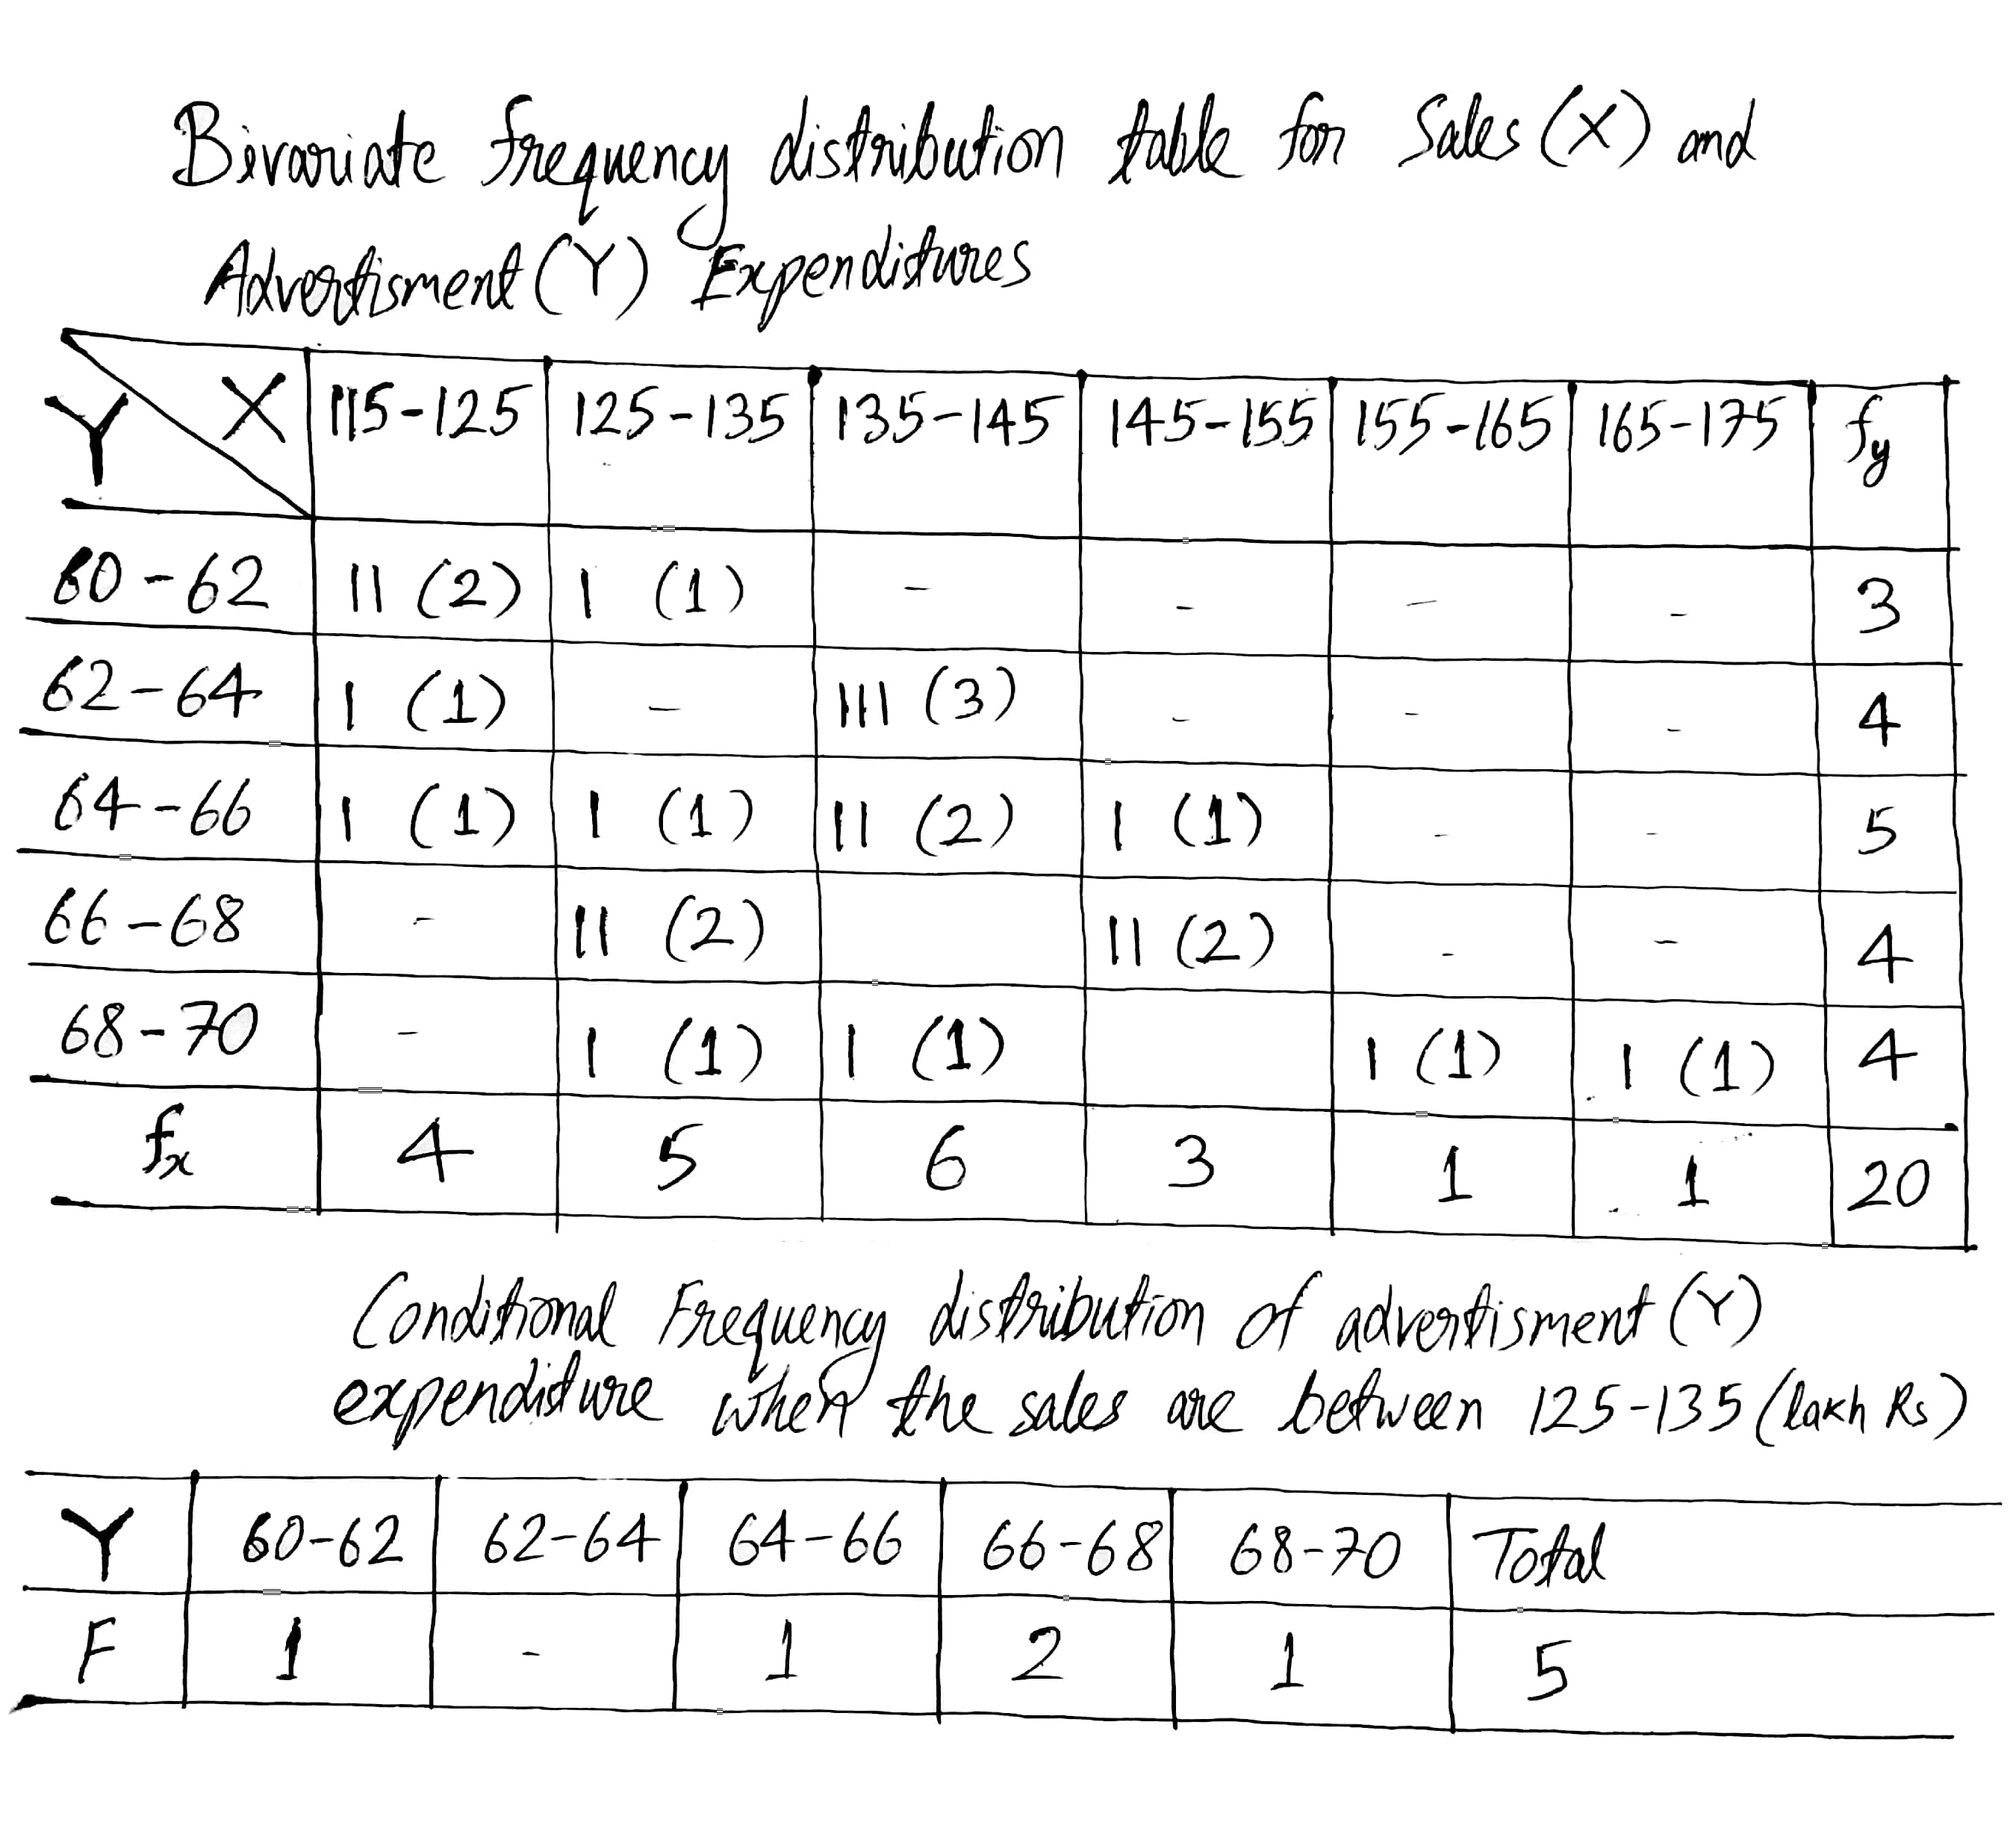
Construct a bivariate frequency distribution table for the given data by taking classes $$115-125$$, $$125-135$$,... etc., for sales and $$60-62, 62-64$$,... etc., for advertisement expenditure.
Conditional frequency distribution of advertisement expenditure when the sales are between $$125-135$$. (lakh Rs.)
Fill in the blanks:
Arranging the numerical figures in ascending or descending order is called an .............
Define the term Raw data
Define the term Array
Define the term:
Array.
Arrange the following as an array (in descending order):
$$0,2,0,3,4,1,2,3,5$$
Arrange the following as an array (in ascending order):
$$6.3,5.9,9.8,12.3,5.6,4.7$$
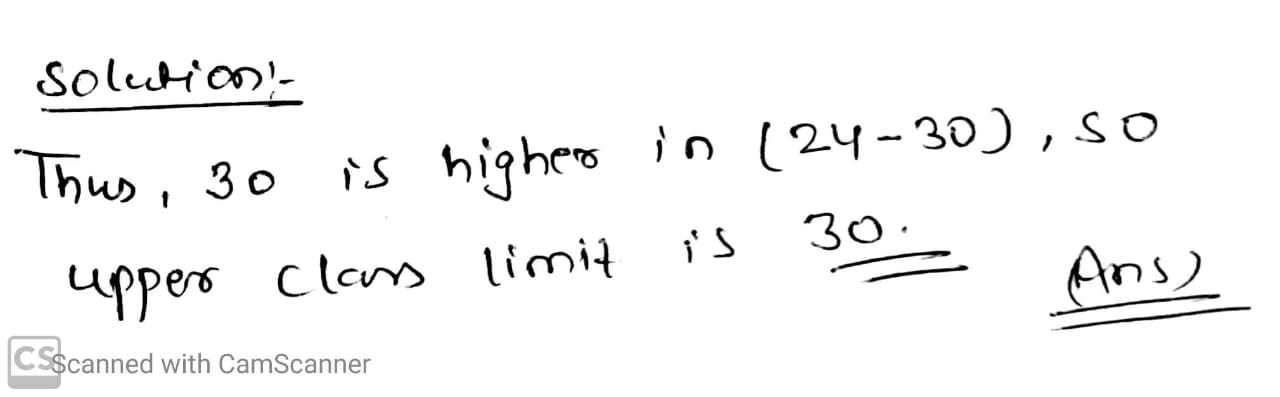
Upper clas limit of $$24-30$$ is _______
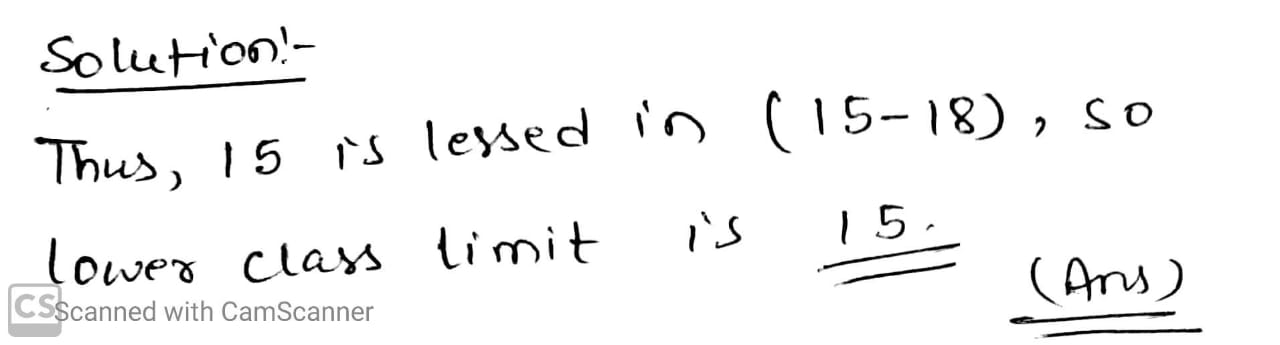
Fill in the blanks:
Lower class limit of $$15-18$$ is
A die is thrown $$25$$ times and the scores were as given below:
$$2, 1, 4, 6, 2, 3, 1, 5, 6, 3, 4, 5, 2, 1, 6, 6, 6, 3, 2, 2, 2, 4, 3, 2, 2$$
Construct data array.
Arrange the following as an array (in descending order):
$$9.1.3.7.5.6.8.3.11.5.10.6$$
Arrange the following as an array (in ascending order):
$$7,5,15,12,10,11,16$$
Uses the table given to find:
The upper and lower limits of the fifth class
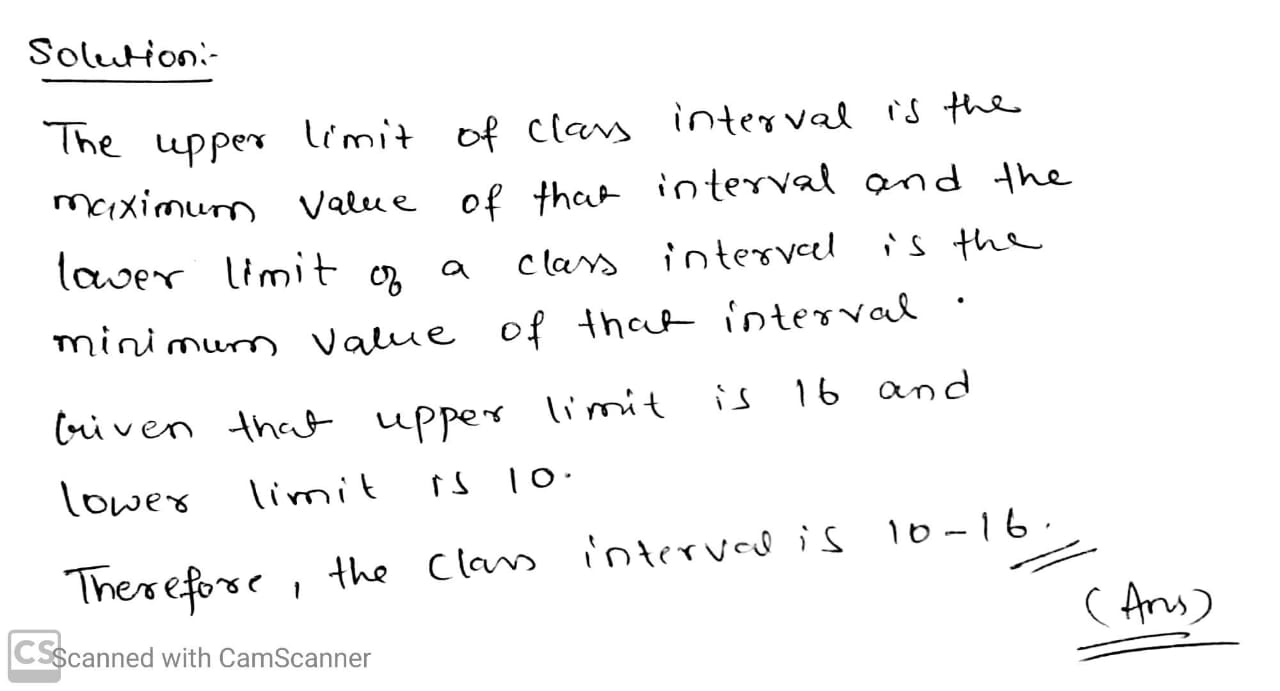
If the upper limit and the lower limits of a class interval are $$16$$ and $$10$$; the class interval is ____
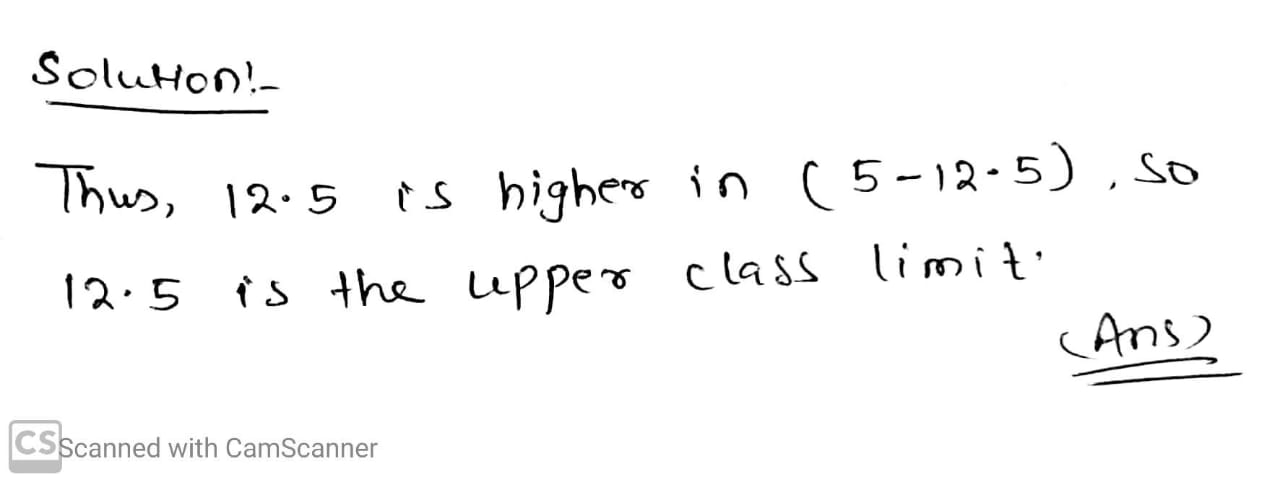
Upper limit of $$5-12.5$$ is _____
Find the actual lower class limits, upper class limits and the mid-values of the classes:
$$10-19,20-29,30-39,$$ and $$40-49$$.
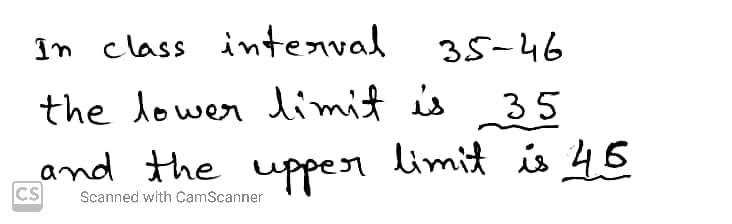
Fill in the blanks:
In the class interval $$35-46;$$ the lower limit is ....... and the upper limit is.....
Data personally collected by an investigator is ____________ data.
Classification data based on the geographical differences of the data is ________.
Define raw data. What is bivariate and univariate distribution? Explain.
The number of books in different shelves of a library are as follows :
$$ 30, 32, 28, 24, 20, 25, 38, 37, 40, 45, 16, 20 $$
$$ 19, 24, 27, 30, 32, 34, 35, 42, 27, 28, 19, 34, $$
$$ 38, 39, 42, 29, 24, 27, 22, 29, 31, 19, 27, 25 $$
$$ 28, 23, 24, 32, 34, 18, 27, 25, 37, 31, 24, 23, $$
$$ 43, 32, 28, 31, 24, 23, 26, 36, 32, 29, 28,$$
Prepare a cumulative frequency distribution table using 45 - 49 as the last class-interval.
Explain the difference between a frequency distribution and a cumulative frequency distribution.
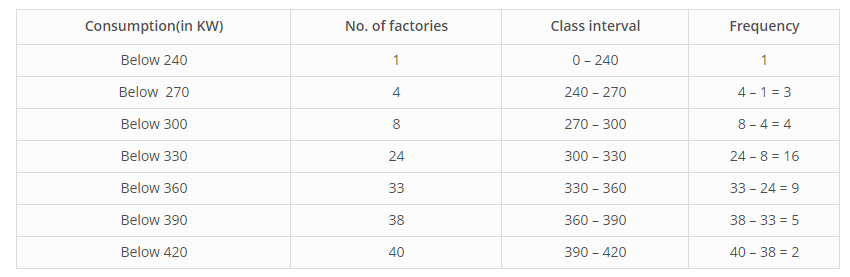
The following cumulative frequency distribution table shows the daily electricity consumption (in kW) of 40 factories in an industrial state : Represent this as a frequency distribution table.
| Consumption (in kW) | No. of Factories |
| Below 240 | 1 |
| Below 270 | 4 |
| Below 300 | 8 |
| Below 330 | 24 |
| Below 360 | 33 |
| Below 390 | 38 |
| Below 420 | 40 |
The marks scored by 40 students of class IX in mathematics are given below:
$$81,55,68,79,85,43,29,68,54,73,47,35,72,64,95,44,50,77,64,35,79,52,45,54,$$$$70,83,62,64,72,92,84,76,63,43,54,38,73,68,52,54.$$
Prepare a frequency distribution with class size of 10 marks.
Prepare a frequency distribution with class size of 10 marks.
Define the following terms: Frequency distribution
The heights (in cm) of 30 students of class IX are given below:
$$155,158,154,158,160,148,149,150,153,159,161,148,157,153,157,162,159,151,154,156,$$
$$152,156,160,152,147,155,163,155,157,153.$$
Prepare a frequency distribution table with 160-164 as one of the class intervals.
Define the following terms :
True class limits
The water bills (in RS) of 32 houses in a certain street for the period 1.1.98 to 31.3.98 are given below :$$ 56, 43, 32, 38, 56, 24, 68, 85, 52, 47, 35, 58, 63, 74, 27, 84, 69, 35, 44, 75, 55, 30, 54, 65,$$$$45, 67, 95, 72, 43, 65, 35,$$
Tabulate the data and present the data as a cumulative frequency table using 70 - 79 as one of the class intervals.
Tabulate the data and present the data as a cumulative frequency table using 70 - 79 as one of the class intervals.
Following figures relate the weekly wages (in Rs.) of 15 workers in a factory:
$$300,250,200,250,200,150,350,200,250,200,150,300,150,200,250$$
Prepare a frequency table.
How many workers are getting the minimum wages?
Following figures relate the weekly wages (in Rs.) of 15 workers in a factory:
$$300,250,200,250,200,150,350,200,250,200,150,300,150,200,250$$
Prepare a frequency table.
What is the range in wages (in Rs)?
Following figures relate the weekly wages (in Rs.) of 15 workers in a factory:
$$300,250,200,250,200,150,350,200,250,200,150,300,150,200,250$$
Prepare a frequency table.
How many Workers are getting Rs 350?
Following figures relate the weekly wages (in Rs.) of 15 workers in a factory:
$$300,250,200,250,200,150,350,200,250,200,150,300,150,200,250$$
Prepare a frequency table.
What is the highest mark?
Class 11 Commerce Economics Extra Questions
- Collection Of Data Extra Questions
- Correlation Extra Questions
- Index Numbers Extra Questions
- Introduction To Economics Extra Questions
- Introduction To Microeconomics Extra Questions
- Market Equilibrium Extra Questions
- Measures Of Central Tendency Extra Questions
- Measures Of Dispersion Extra Questions
- Non-Competitive Markets Extra Questions
- Organisation Of Data Extra Questions
- Presentation Of Data Extra Questions
- Production And Costs Extra Questions
- Theory Of Consumer Behaviour Extra Questions
- The Theory Of The Firm Under Perfect Competition Extra Questions
- Use Of Statistical Tools Extra Questions