Presentation Of Data - Class 11 Commerce Economics - Extra Questions
How much percentage is wheat more than cotton?
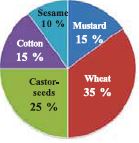
How many kilograms of sesame was bought?
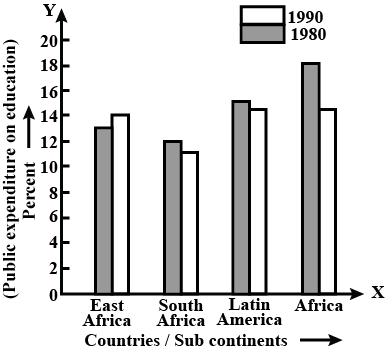
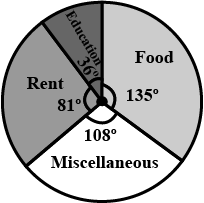
How many percentage of expenditure is done for education?
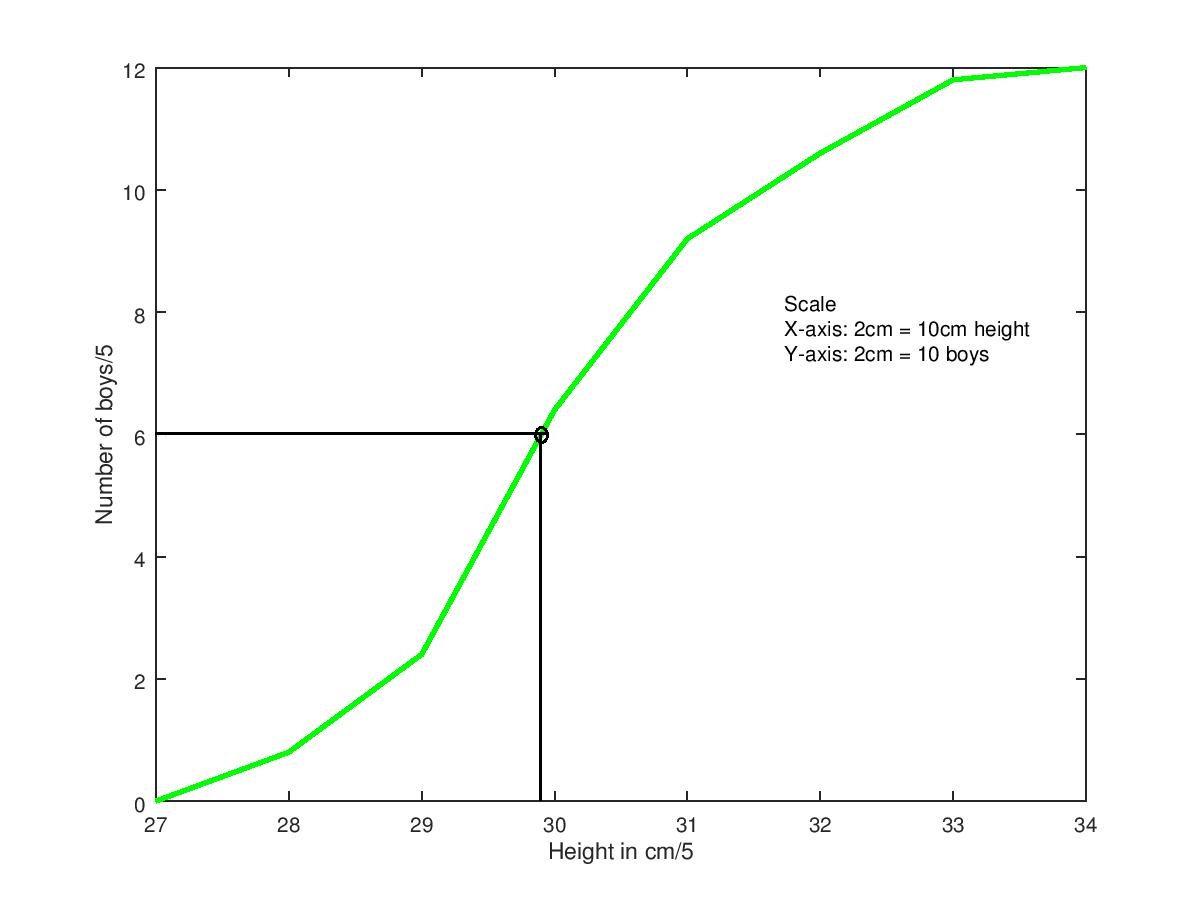
Use Graph paper for this question. A Survey regarding height (in cm ) of $$60$$ boys belonging to Class $$10$$ of a school was conducted. The following data was recorded.
| Height in cm | $$135-140$$ | $$140-145$$ | $$145-150$$ | $$150-155$$ | $$155-160$$ | $$160-165$$ | $$165-170$$ |
| No. of boys | $$4$$ | $$8$$ | $$20$$ | $$14$$ | $$7$$ | $$6$$ | $$1$$ |
There are $$60$$ boys.
To find the median height, we first arrange the class into increasing order of heights and then pick the height of the middle student as the median height.
To find that on the ogive plot, we have to find the mark on the y-axis which corresponds to $$30$$ boys and that would be the point $$6$$ on the y-axis.
Thus, the point on the x-axis which corresponds to the point $$6$$ on the y-axis is the median height.
We find that the number $$6$$ on the y-axis corresponds to somewhere between $$29$$ and $$30$$ on the x-axis.
That means, the median height range is $$145-150 cm$$.
This is shown on the graph attached.
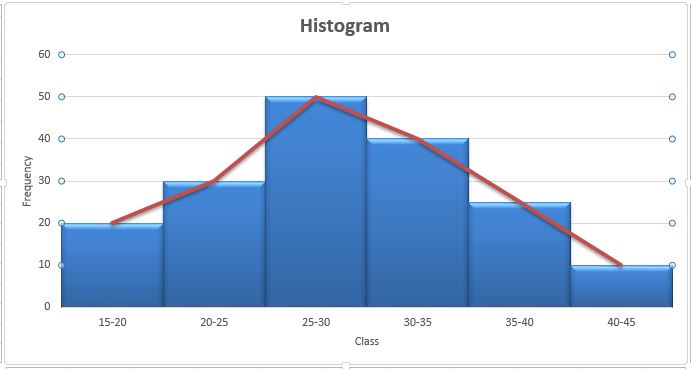
Draw histogram and frequency polygon on the same graph paper for the following frequency distribution.
| Class | Frequency |
| $$15-20$$ | $$20$$ |
| $$20-25$$ | $$30$$ |
| $$25-30$$ | $$50$$ |
| $$30-35$$ | $$40$$ |
| $$35-40$$ | $$25$$ |
| $$40-45$$ | $$10$$ |
| $$Class$$ | $$Class\,\, Mark$$ $$(x_i)$$ | $$f_i$$ |
| $$15-20$$ | $$17.5$$ | $$20$$ |
| $$20-25$$ | $$22.5$$ | $$30$$ |
| $$25-30$$ | $$27.5$$ | $$50$$ |
| $$30-35$$ | $$32.5$$ | $$40$$ |
| $$35-40$$ | $$37.5$$ | $$25$$ |
| $$40-45$$ | $$42.5$$ | $$10$$ |
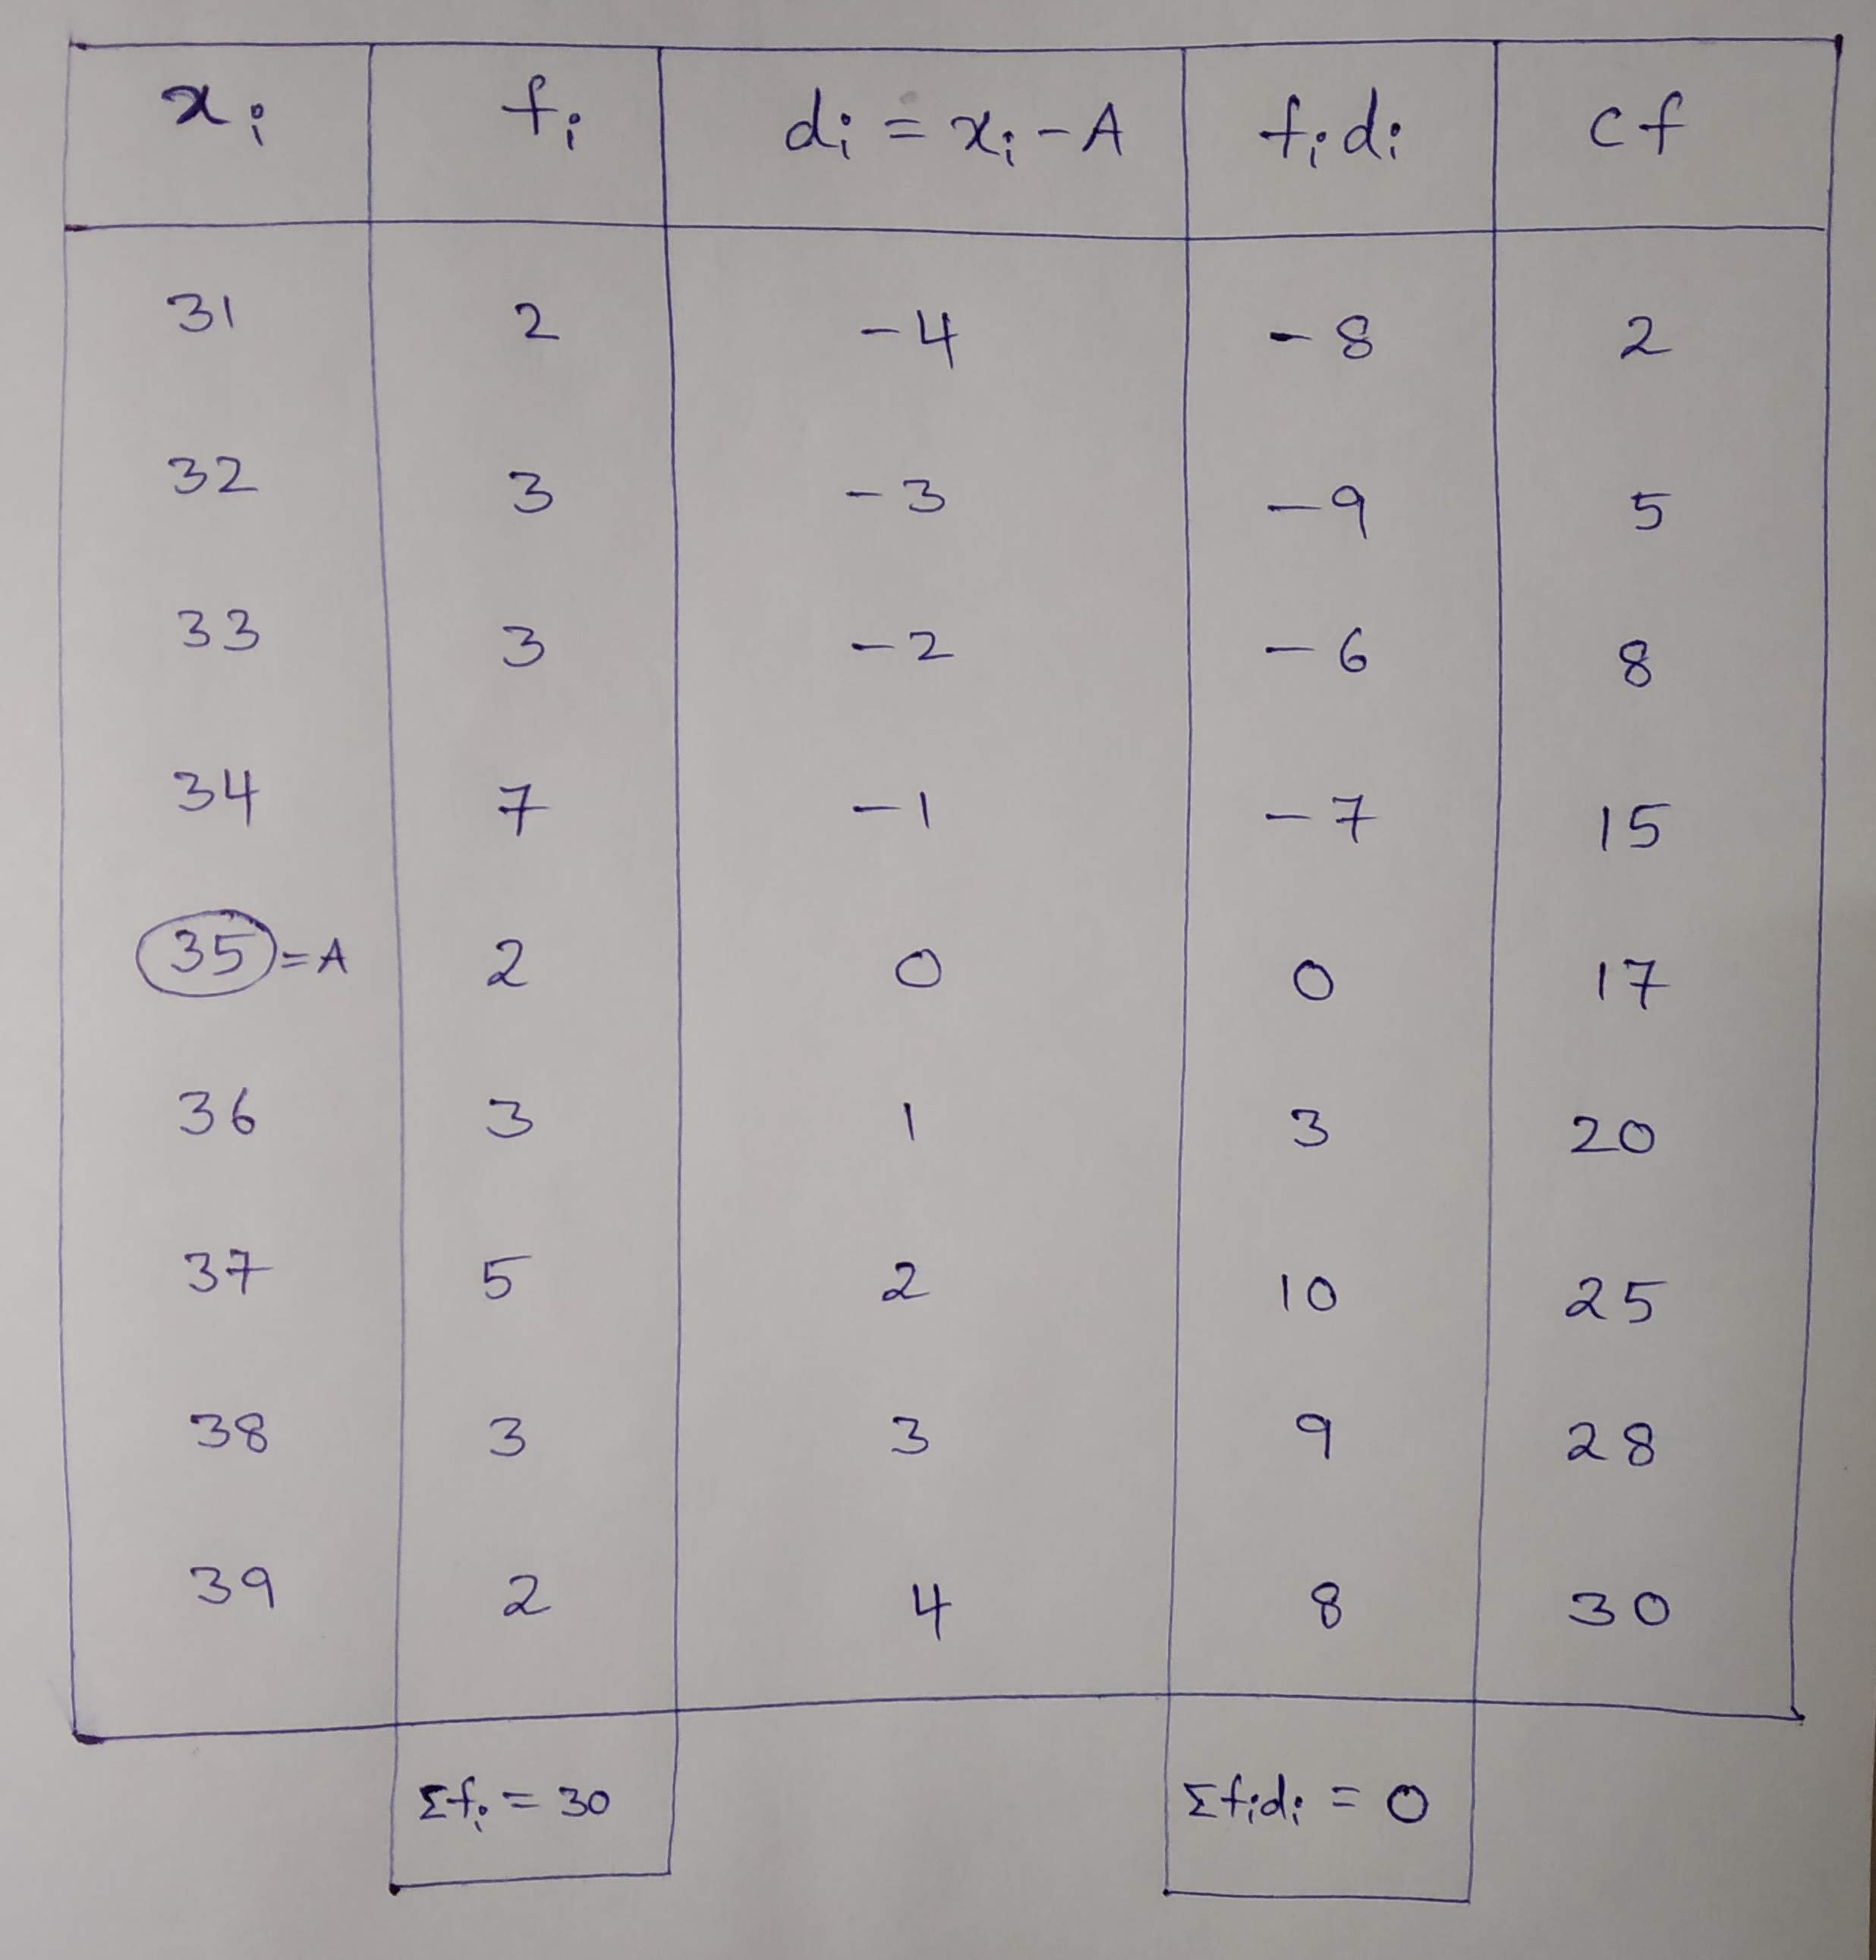
| $${32}^{o}$$ | $${34}^{o}$$ | $${36}^{o}$$ | $${37}^{o}$$ | $${38}^{o}$$ | |
| $${34}^{o}$$ | $${31}^{o}$$ | $${34}^{o}$$ | $${37}^{o}$$ | $${37}^{o}$$ | |
| $${37}^{o}$$ | $${35}^{o}$$ | $${32}^{o}$$ | $${34}^{o}$$ | $${38}^{o}$$ | |
| $${39}^{o}$$ | $${31}^{o}$$ | $${36}^{o}$$ | $${36}^{o}$$ | $${39}^{o}$$ | |
| $${34}^{o}$$ | $${33}^{o}$$ | $${35}^{o}$$ | $${34}^{o}$$ | $${33}^{o}$$ | |
| $${37}^{o}$$ | $${33}^{o}$$ | $${32}^{o}$$ | $${34}^{o}$$ | $${38}^{o}$$ |
Median = Average of $$15^{th}, 16^{th}$$ observations $$(\because n = 30)$$
$$= \dfrac{34+35}{2}$$
$$ = 34.5$$
Mode = most occurring observation $$ = 34$$
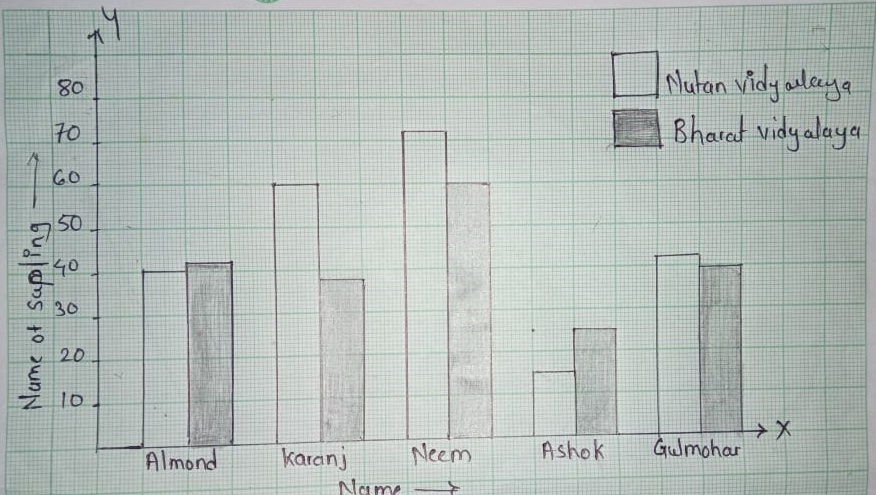
The number of saplings planted by schools on World Tree Day is given in the table below. Draw a joint bar graph to show these figures.
| Almond | Karanj | Neem | Ashok | Gulmohar | |
| Nutan Vidyalaya | 40 | 60 | 72 | 15 | 42 | |
| Bharat Vidyalaya | 42 | 38 | 60 | 25 | 40 |
$$\Rightarrow$$ The above figure shows joint bar graph.
A shop has the following number of shoe pairs of different sizes
Size$$2:20$$ Size$$3:30$$ Size$$4:28$$ Size$$5:14$$ Size$$6:8$$
Write this information in tabular form as done earlier and find the percentage of each shoe size available in the shop.
On the basis of information given below, calculate $$AR$$ and $$MR$$ and explain their mutual relationship.
| Units of a Good | $$1$$ | $$2$$ | $$3$$ | $$4$$ | $$5$$ | $$6$$ |
| $$TR (Rs.)$$ | $$4$$ | $$7$$ | $$9$$ | $$10$$ | $$10$$ | $$9$$ |
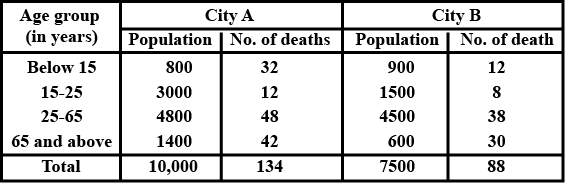
Obtain crude death rates $$(C.D.R)$$ for city $$A$$ and city $$B$$ from the given below:
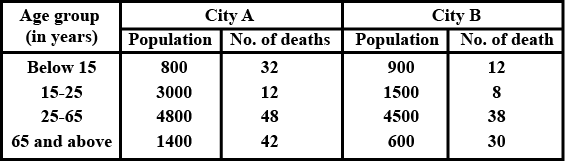
$$C.D.R=\dfrac{number\,of\,deaths}{total\,population}\times 100$$
$$C.D.R\,for\,city\,A=\dfrac{134}{10,000}\times 100=13.4$$
$$C.D.R\,for\,city\,B=\dfrac{88}{7,500}\times 1000=11.73$$
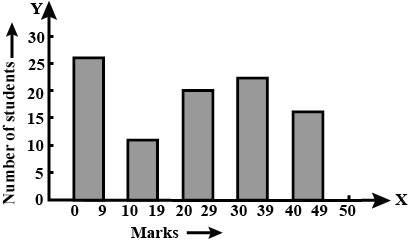
| Marks | No. of students |
| $$1-20$$ | $$8$$ |
| $$21-40$$ | $$12$$ |
| $$41-50$$ | $$15$$ |
| $$51-60$$ | $$20$$ |
| $$61-70$$ | $$13$$ |
| $$71-80$$ | $$17$$ |
| $$81-90$$ | $$5$$ |
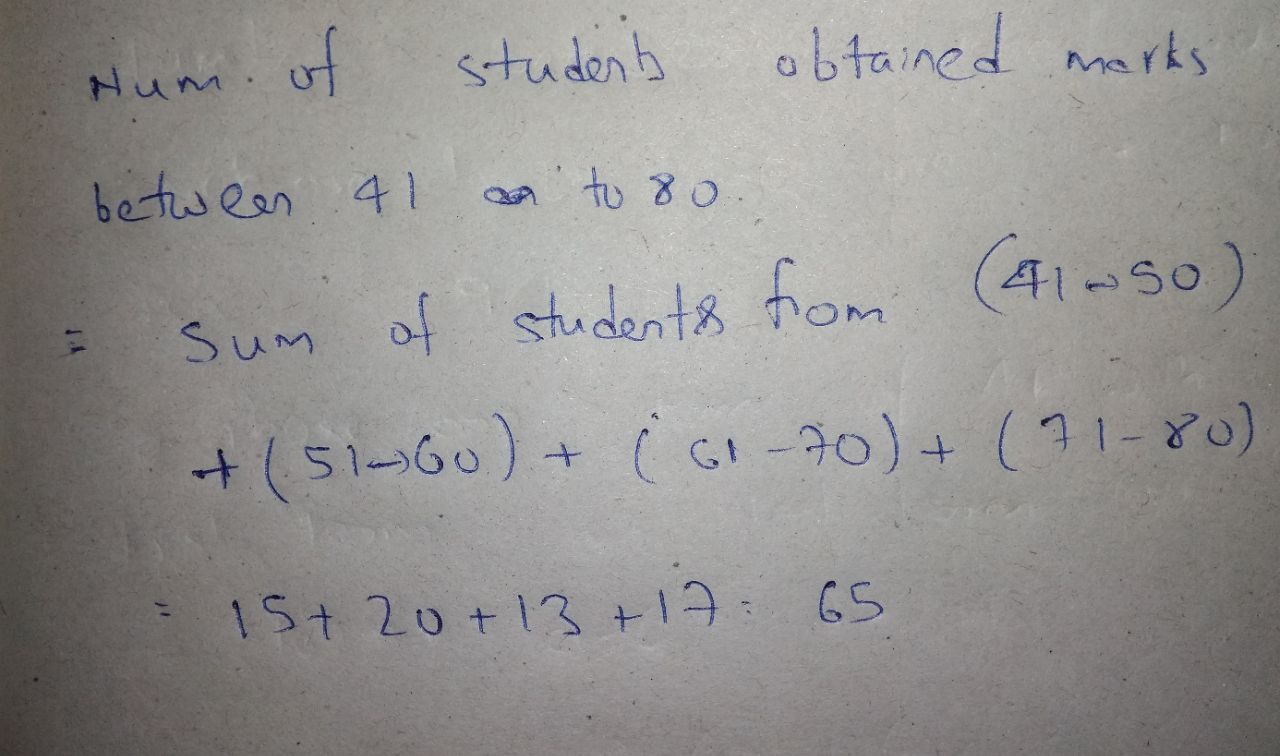
Number of students obtained marks between 41 to 80
= sum of students from (41-50)+(51-60)+(61-70)+(71-80)
= 15+20+13+17=65
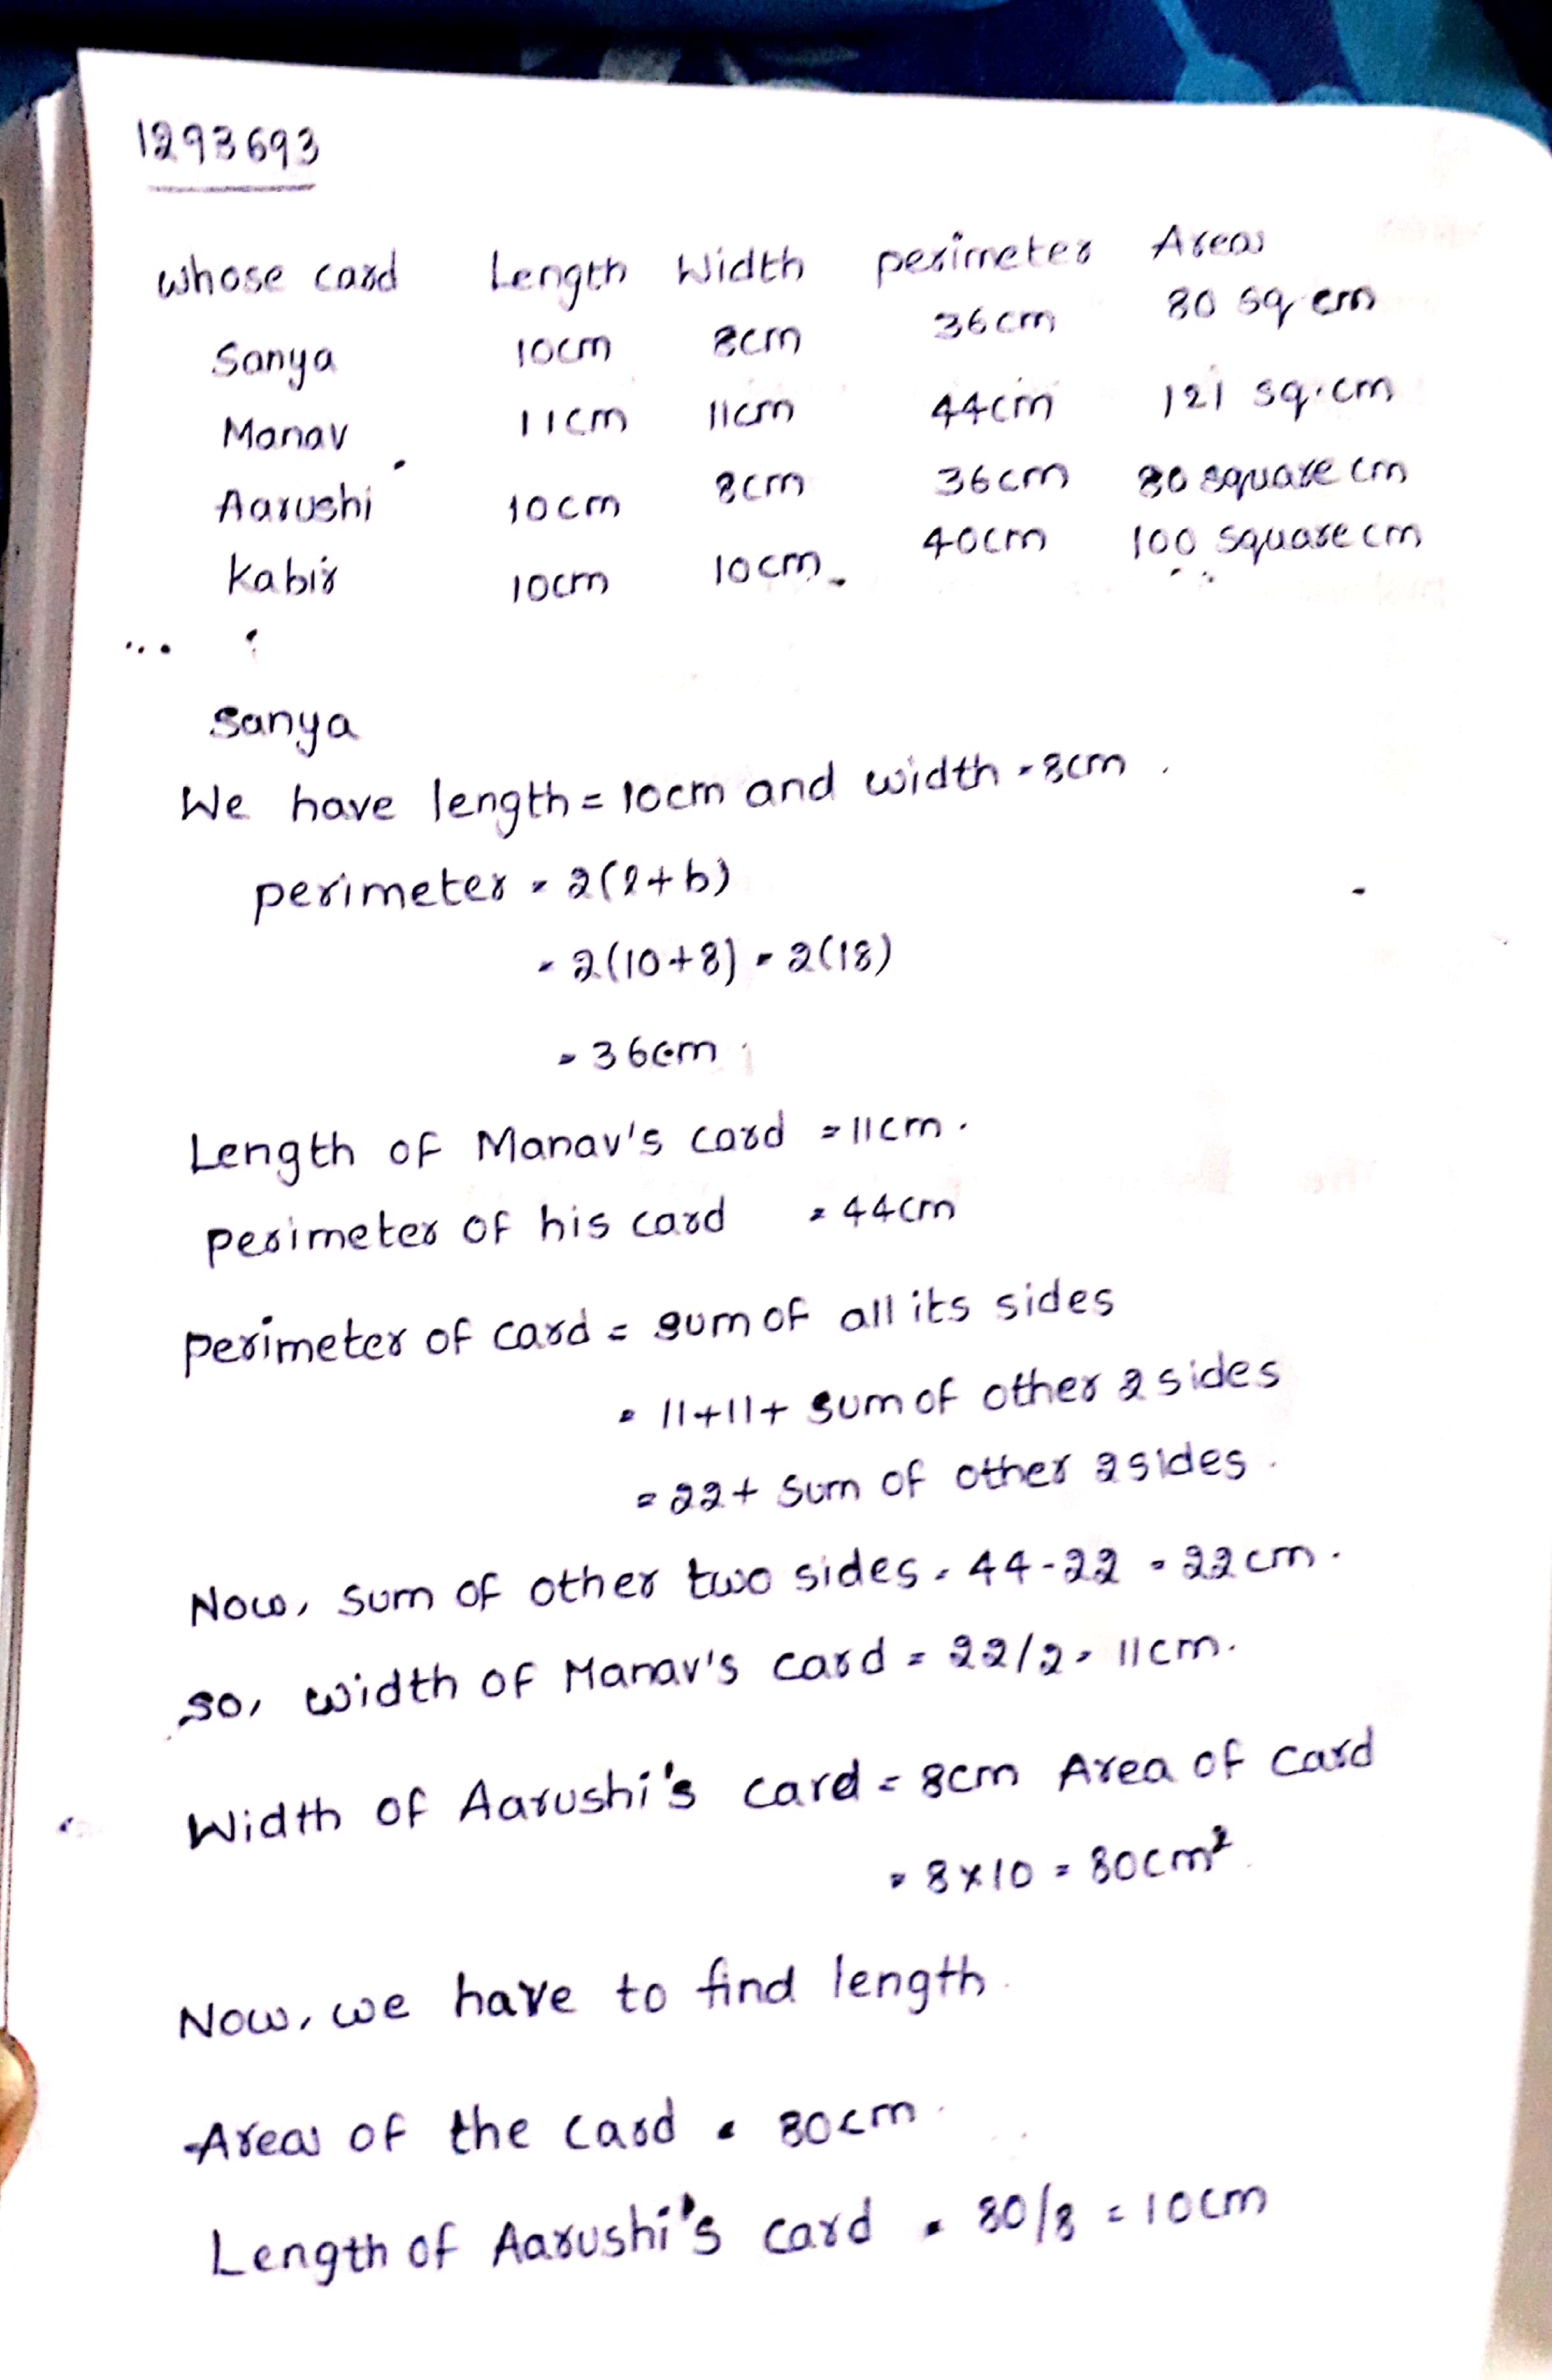
Sanya, Aarushi, Manav and Kabir made greeting cards. Complete the table for their cards:
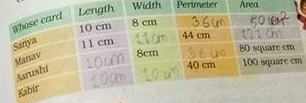
whose card Length width perimeter Areas
sanya 10 cm 8 cm 36 cm 80 sq.cm
Manav 11 cm 11 cm 44 cm 121 sq.cm
Aarushi 10 cm 8 cm 36 cm 80 sq.cm
Kabir 10 cm 10 cm 40 cm 100 sq.cm
sanya
we have length = 10 cm and width = 8 cm
perimeter =2(2+b)
= 2(10+8) = 2(18)
= 36 cm
Length of Manav's card =11 cm
Perimeter of his card =44 cm
Perimeter of card = sum of all its sides
=11+11+sum of other 2 sides
= 22+sum of other 2 sides
Now, sum of other two sides, 44-22=22 cm
so, width of manav's card =22/2, 11 cm
width of Arushi's card = 8 cm Area of card
$$= 8\times 10= 80cm^{2}$$
Now, we have to find length
Area of the card =80 cm
Length of Arushi's card = 80/8=10 cm.
The minimum cost of each tablet is Rs. 10 and each capsule is Rs.If the cost of 8 tablets and 5 capsules is not less than Rs. 150, frame the inequations for the given data.
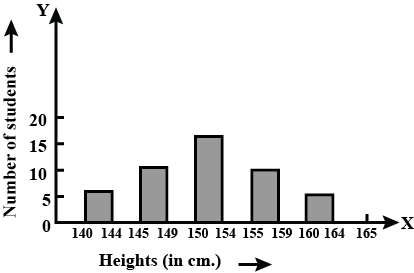
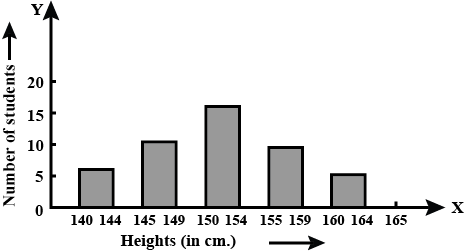
The bar graph as shown in above figure represents the heights (in cm) of 50 students of Class XI of a particular school. Study the graph and answer the following questions:
What percentage of the total number of students have their heights more than 149 cm?

What do you mean by the term sorting of data ?
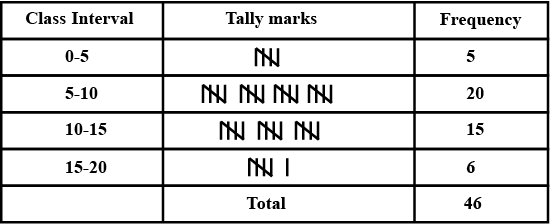
In a school, $$46$$ students of $$9th$$ standard were told to measure the lengths of the pencils in their compass-boxes in centimeters. The data collected was as follows.
$$16, 15, 7, 4.5, 8.5, 5.5, 5, 6.5, 6, 10, 12, 13, 4.5, 4.9, 16, 11, 9.2, 7.3, 11.4, 12.7, 13.9, 16, 5.5, 9.9, 8.4, 11.4, 13.1, 15, 4.8, 10, 7.5, 8.5, 6.5, 7.2, 4.5, 5.7, 16, 5.7, 6.9, 8.9, 9.2, 10.2, 12.3, 13.7, 14.5, 10$$.
By taking inclusive classes $$0-5, 5-10, 10-15....$$ prepare a grouped frequency distribution table.
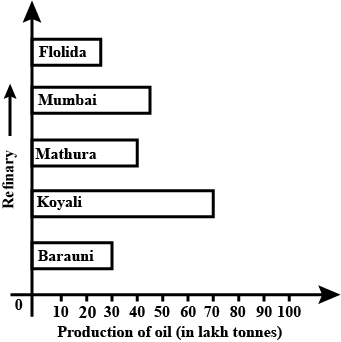
The ages of ten students of a group are given below. The ages have been recorded in
$$\text{years - months:}$$
$$8-6,9-0,8-4,9-3,7-8,8-11,8-7,9-2,7-10,8-8$$
What is the lowest age?
The following are the favorite cartoon characters of $$15$$ children. Doraemon, Jerry, Mickey mouse, Jerry, Tom, Doraemon, Doraemon, Mickey Mouse, Mickey mouse, Jerry, Jerry, Jerry, Doraemon, Doraemon, Doraemon.Arrange the names of the cartoon characters in a table using tally marks.
The bar graph as shown in above figure represents the heights (in cm) of 50 students of Class XI of a particular school. Study the graph and answer the following questions:
The school wants to provide a particular type of tonic to each student below the height of 150 cm to improve his height. If the cost of the tonic for each student comes out to be Rs 55, how much amount of money is required?
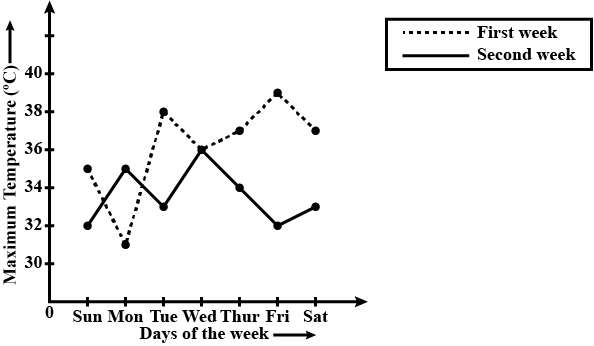
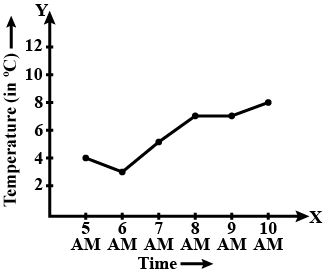
The graph shows the maximum temperatures recorded for two consecutive weeks of a town. Study the graph and answer the questions that follow.
On which day was the temperature highest for the second week?
Data available in an unorganised form is called _______ data
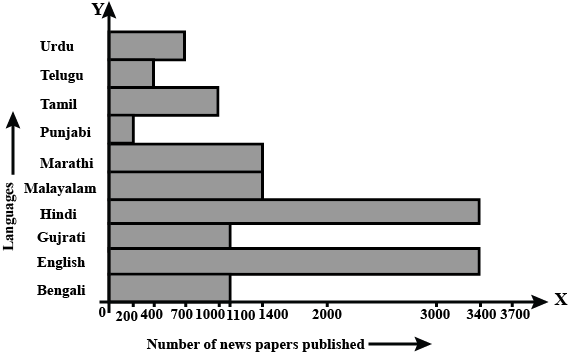
The bar graph shown in Fig.16 represents the circulation of newspapers in 10 languages.
study the bar graph and answer the following question:
State the language other than english in which the number of newspaper published is between 2500 and 3500.
The table given below shows the temperatures recorded on a day at different times.
Observe the table and answer the following questions.
During which hour was there a constant temperature?
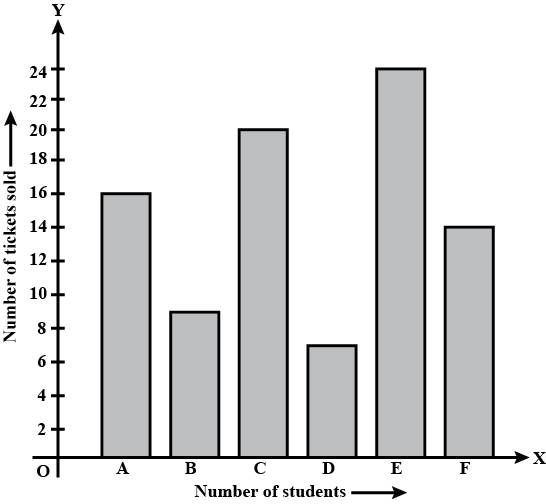
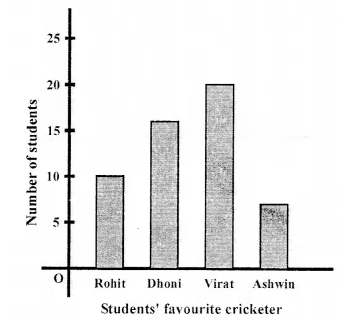
The bar graph drawn below shoes the number of tickets sold during a fair by $$6$$ students $$A, B, C, D, E$$ and $$F$$
Using the Bar graph, answer the following question:
What is the average number of tickets sold per student?
How is the data of a measurement recorded in tabular form? Describe in steps.
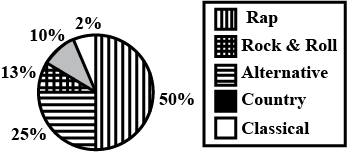
A pie chart is constructed by converting the share of each component into a percentage of 360 degrees Music preferences in 13 to 19 year (teenagers) olds are clearly shown in the figureFind the percentage occupied by the music which is least liked?
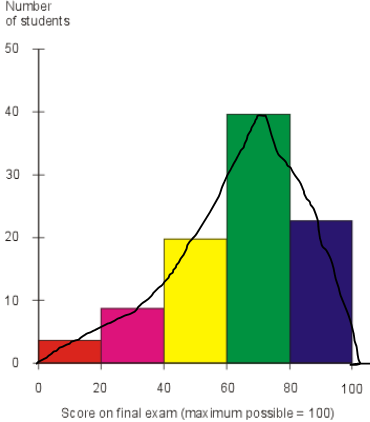
Plot the frequency curve for the following histogram.
Frequency curve can also be drawn with the help of histogram by joining their mid points of rectangle.
Draw frequency curve for the following histogram.
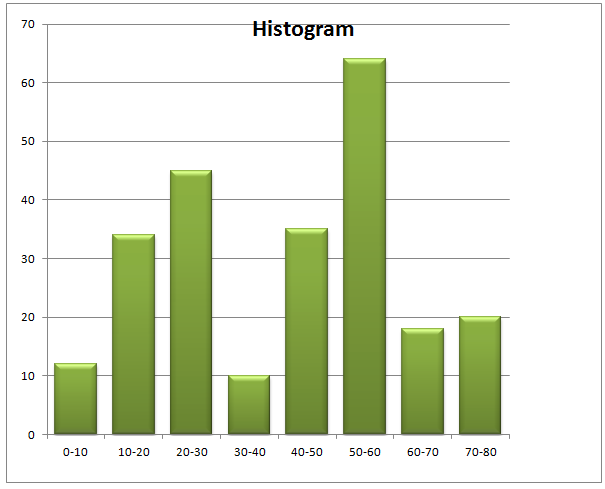
Find Mid-point of every class and connect them by free-hand
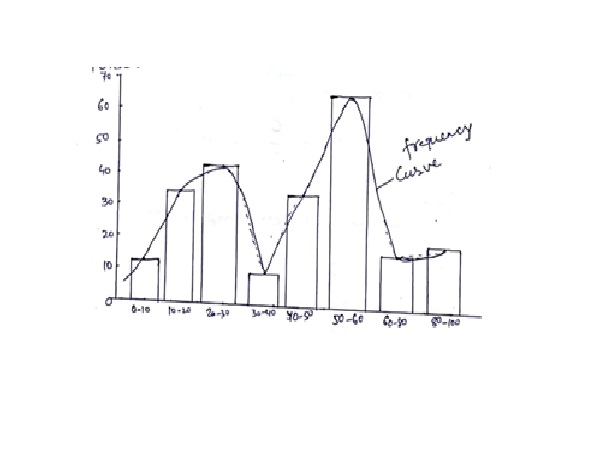
that is frequency curve.
Marks of $$30$$ students in mathematics test are given in the adjacent grouped frequency distribution.
| Sl. No | Marks | No of students |
| $$1$$ | $$0 - 5$$ | $$5$$ |
| $$2$$ | $$5 - 10$$ | $$7$$ |
| $$3$$ | $$10 - 15$$ | $$10$$ |
| $$4$$ | $$15 - 20$$ | $$6$$ |
| $$5$$ | $$20 - 25$$ | $$2$$ |
Marks of $$30$$ students in mathematics test are given in the adjacent grouped frequency distribution.
| Sl. No | Marks | No of students |
| $$1$$ | $$0 - 5$$ | $$5$$ |
| $$2$$ | $$5 - 10$$ | $$7$$ |
| $$3$$ | $$10 - 15$$ | $$10$$ |
| $$4$$ | $$15 - 20$$ | $$6$$ |
| $$5$$ | $$20 - 25$$ | $$2$$ |
The following is the frequency distribution with unknown frequencies
| Class | $$60-70$$ | $$70-80$$ | $$80-90$$ | $$90-100$$ | Total |
| Frequency | $$\dfrac{a}{2}$$ | $$\dfrac{3a}{2}$$ | $$2a$$ | $$a$$ | $$50$$ |
The value of $$a$$ can be calculated as follows
$$\dfrac{a}{2} + \dfrac{3a}{2} + 2a + a = 50$$
$$\dfrac{a + 3a + 4a + 2 a}{2} = 50$$
$$\dfrac{10a}{2} = 50$$
$$5a = 50$$
$$a = 10$$
$$\dfrac{a}{2} + \dfrac{3a}{2} + 2a + a = 50$$
$$\dfrac{a + 3a + 4a + 2 a}{2} = 50$$
$$\dfrac{10a}{2} = 50$$
$$5a = 50$$
$$a = 10$$
| Class | $$60-70$$ | $$70-80$$ | $$80-90$$ | $$90-100$$ |
| Frequency | $$5$$ | $$15$$ | $$20$$ | $$10$$ |
The following data give the number of students using different modes of transport:
| Modes of Transport | Number of Students |
| Bicycle | $$140$$ |
| Bus | $$100$$ |
| Walk | $$70$$ |
| Train | $$40$$ |
| Car | $$10$$ |
How many students scored full marks in the test?
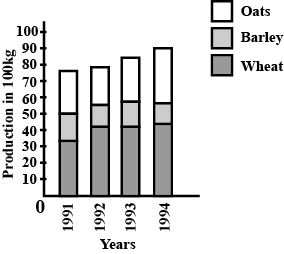
Draw a subdivided bar graph to illustrate the given data
| Years | Wheat | Barley | Oats |
| 1991 | 34 | 18 | 27 |
| 1992 | 43 | 14 | 24 |
| 1993 | 43 | 16 | 27 |
| 1994 | 45 | 13 | 34 |
| $$Years$$ | $$Wheat$$ | $$Barley$$ | $$Oats$$ | $$Total$$ |
| $$1991$$ | $$34$$ | $$18$$ | $$27$$ | $$79$$ |
| $$1992$$ | $$43$$ | $$14$$ | $$24$$ | $$81$$ |
| $$1993$$ | $$43$$ | $$16$$ | $$27$$ | $$86$$ |
| $$1994$$ | $$45$$ | $$13$$ | $$34$$ | $$92$$ |
How many students scored $$3$$ or more than $$3$$ marks?
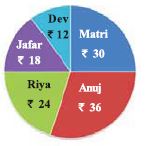
In all how many rupees were collected as fund?
What percentage of Asopalav tree were planted?
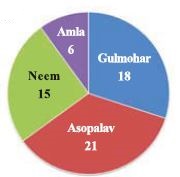
What percentage of Gulmohar sapling were planted? in % .
How many runs did sachin score? in %
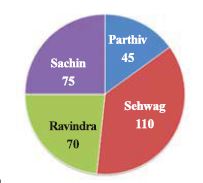
Find the degree measuremnet of the runs scored by Parthiv? in degrees.
Distinguish between:
Simple Bar Diagram and Multiple Bar Diagram
State whether True or False. Give Reasons.
Histogram is a type of diagram.
Distinguish Between.
Simple Bar Diagram and Multiple Bar Diagram.
Define or explain the concepts:
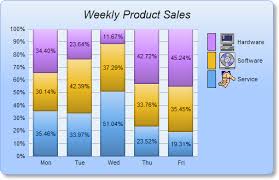
Percentage Bar
A percentage bar chart, bars of length equal to 100 for each class are drawn in the first step and sub-divided into the proportion of the percentage of their component in the second step. The diagram so obtained is called a percentage component bar chart or percentage stacked bar chart.
Answer in detail:
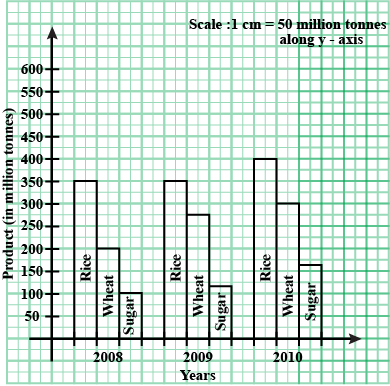
What is a Multiple Bar Diagram?
Prepare a Multiple Bar Diagram from the following data.
| Product | Production (in million tonnes) | ||
| 2008 | 2009 | 2010 | |
| Rice | 300 | 350 | 400 |
| Wheat | 200 | 275 | 300 |
| Sugar | 100 | 120 | 160 |
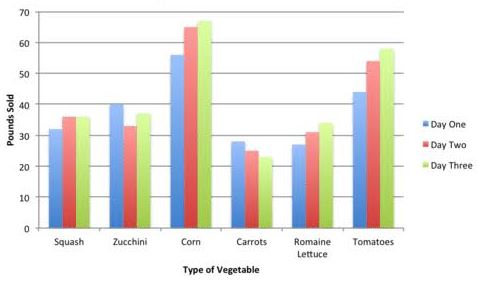
A multiple bar graph is a graph that has multiple bars for each category.A multiple bar graph compares as many sets of data you want. The process for creating a multiple bar graph is just like creating any other bar graph, only you will have more colors to represent different sets of data.
To create a multiple bar graph:
1. Draw the horizontal $$(x)$$ and vertical $$(y)$$ axis.
2. Give the graph a title.
3. Label the horizontal $$x$$ axis.
4. Label the vertical $$y$$ axis.
5. Look at the range in data and decide how the units on the vertical axis $$(y)$$ should be labeled.
For each item on the horizontal $$(x)$$ axis, draw a vertical column to the appropriate value however many times as you have sets of data.
Do you agree with the statement? Give reasons
There is a only one type of diagram.
Answer the following:
What are the general principles for the construction of a diagram?
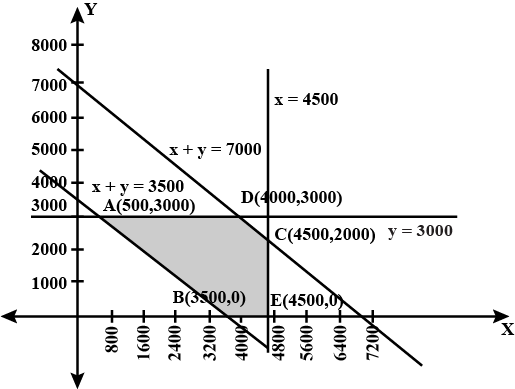
An oil company has tow depots A and B with capacities of $$7000\ L$$ and $$4000\ L$$ respectively. The company is to supply oil to three petrol pumps $$D, E$$ and $$F$$ whose requirements are $$4500L, 3000L$$ and $$3500L$$ respectively. The distances (in km) between the depots and the petrol pumps is given in the following table:
| Distance in km | Distance in km | |
| From/ To | $$A$$ | $$B$$ |
| $$D$$ | $$7$$ | $$3$$ |
| $$E$$ | $$6$$ | $$4$$ |
| $$F$$ | $$3$$ | $$2$$ |
Step 1:
Let $$x$$ litres of oil be supplied from depot $$A$$ to petrol pump $$D$$ and $$y$$ litres of oil be supplied from depot $$A$$ to petrol pump $$E$$,then $$7000−(x+y)\ge 0 (i.e) x+y\le 7000$$
The requirements of oil at petrol pumps $$D,E$$ and $$F$$ are $$4500l,3000l$$ and $$3500l$$
The quantity of oil transported from depot $$B$$ to petrol pump $$D,E$$ and $$F$$ are $$(4500−x),(3000−y)$$ and $$3500−[7000−(x+y)]litres$$ respectively.
$$(i.e)4500−x\ge0$$
$$\Rightarrow x\le4500$$
$$3000−y\ge0$$
$$\Rightarrow$$ $$y\le3000$$
$$3500−[7000−(x+y)]\ge0$$
$$\Rightarrow x+y\ge3500$$
Step 2:
The cost of transportation per km for $$10litre$$ oil is $$Rs.1.$$
Hence the cost of transportation/km/litre$$=Rs110=Rs 0.1$$
$$\Rightarrow$$ $$Z=0.7x+0.6y+0.3[7000−(x+y)]+0.3(4500−x)+0.4(3000−y)+0.2[(x+y)−3500]$$
On simplifying we get,
$$Z=0.3x+0.1y+3950$$
Now the corner points are $$A(500,3000),B(3500,0),E(4500,0),C(4500,2500)$$ and $$D(4000,3000)$$
Step 4:
Now let us calculate the values of the objective function as follows :
At the points $$(x,y)$$ the value of the objective function subjected to $$Z=0.3x+0.1y+3950$$
At $$A(500,3000)$$ the value of the objective function subjected to $$Z=0.3\times 500+0.1\times 3000+3950=4400$$
At $$B(3500,0)$$ the value of the objective function subjected to $$Z=0.3\times 3500+0+3950=5000$$
At $$E(4500,0)$$ the value of the objective function subjected to $$Z=0.3\times 4500+0+3950=5300$$
At $$C(4500,2500)$$ the value of the objective function subjected to $$Z=0.3\times 4500+0.1\times 2500+3950=5550$$
At $$C(4000,3000)$$ the value of the objective function subjected to $$Z=0.3\times 4000+0.1\times 3000+3950=5450$$
Step 5:
It is clear that the minimum transport charges are $$Rs.4400$$ at $$A(500,3000).$$
When $$x=500$$ and$$y=3000$$,
$$500L$$,$$3000L$$ and $$3500L$$ of oil should be transported from depot $$A$$ to petrol pumps $$D,E$$ and $$F$$ and $$4000L$$,$$0L$$ of oil be transported from depot $$B$$ to petrol pumps $$D,E$$ and $$F$$ with minimum cost of transportation of $$Rs.4400.$$
Answer in detail:
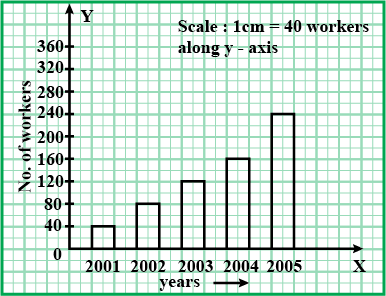
What is a Simple Bar Diagram?
Construct a Simple bar diagram from the following data
| Year | 2001 | 2002 | 2003 | 2004 | 2005 |
| No of Workers | 40 | 80 | 120 | 160 | 240 |
A bar chart or bar graph is a chart or graph that presents categorical data with rectangular bars with heights or lengths proportional to the values that they represent. The bars can be plotted vertically or horizontally.A bar graph shows comparisons among discrete categories.
Write Short Notes on the following:
Multiple Bar Diagram
Sometimes there are more than two sets of data to be compared in a bar graph. In that case, a multiple bar graph can be used. A multiple bar graph compares as many sets of data you want. The process for creating a multiple bar graph is just like creating any other bar graph, only you will have more colors to represent different sets of data.
To create a multiple bar graph:
Draw the horizontal $$(x)$$ and vertical $$(y)$$ axis.
Give the graph a title.
Label the horizontal $$x$$ axis.
Label the vertical $$y$$ axis.
Look at the range in data and decide how the units on the vertical axis $$(y)$$ should be labeled.
For each item on the horizontal $$(x)$$ axis, draw a vertical column to the appropriate value however many times as you have sets of data. For example, if you are looking at 3 days worth of data, you will have $$3$$ bars per item.
Choose three colors to represent each different data set. Make sure to label the data sets in a key alongside the graph.
Sometimes comparing data can also be done by comparing data sets across multiple different bar graphs.
The difference is the data is split versus all being compared in one graph. Either method allows you to analyze and compare the data being displayed.
Answer in detail:
What is a sub divided bar diagram?
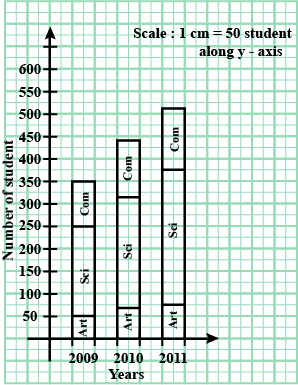
Draw a sub divided bar diagram from the following data?
| Stream | No of Students | |||
| 2009 | 2010 | 2011 | ||
| Arts | 50 | 70 | 75 | |
| Science | 200 | 250 | 300 | |
| Commerce | 100 | 120 | 130 |
A sub-divided or component bar chart is used to represent data in which the total magnitude is divided into different or components. In this diagram, first we make simple bars for each class taking the total magnitude in that class and then divide these simple bars into parts in the ratio of various components.
The random variable $$X$$ can take only the values $$0, 1, 2, 3$$. Given that $$P(X = 0) = P(X = 1) = p$$ and $$P(X = 2) = P(X =3)$$ such that $$\sum p_{i}x_{i}^{2} = 2\sum p_{i}x_{i}$$ find the value of $$p$$.
Complete the following table. Identify the phase of production which is relevant from the viewpoint of producer's equilibrium.
| Units of Labour | $$TP$$ | $$AP$$ | $$MP$$ |
| $$1$$ $$2$$ $$3$$ $$4$$ $$5$$ $$6$$ $$7$$ $$8$$ | $$4$$ $$12$$ $$24$$ $$32$$ $$36$$ $$36$$ $$28$$ $$16$$ | - - - - - - - - | - - - - - - - - |
There are four consumers of a fruit called a smile. They are Isla, Ifraah, Ila and Ibema. Their demand curves for smile are given below. Derive the market demand curve.
| Price (Rs.) | Quantity Demanded by Isla (Units) | Quantity Demanded by Ifraah (Units) | Quantity Demanded by Ila (Units) | Quantity Demanded by Ibema (Units) |
| $$1$$ $$2$$ $$3$$ $$4$$ $$5$$ $$6$$ | $$16$$ $$11$$ $$7$$ $$4$$ $$2$$ $$1$$ | $$7$$ $$6$$ $$5$$ $$4$$ $$3$$ $$2$$ | $$15$$ $$12$$ $$9$$ $$6$$ $$3$$ $$0$$ | $$8$$ $$6$$ $$4$$ $$2$$ $$0$$ $$0$$ |
In order to draw a market demand curve, we must first derive a market demand schedule, as under:
Market Demand Schedule
Note: Market demand curve is a horizontal summation of individual demand curves.
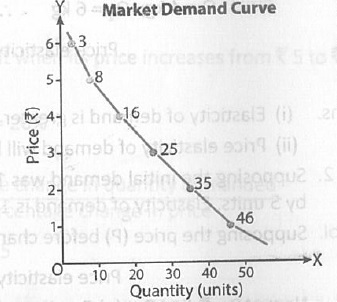
Market Demand Schedule
| Price (Rs.) | Quantity (Units) |
| $$1$$ $$2$$ $$3$$ $$4$$ $$5$$ $$6$$ | $$16 + 7 + 15 + 8 = 46$$ $$11 + 6 + 12 + 6 = 35$$ $$7 + 5 + 9 + 4 = 25$$ $$4 + 4 + 6 + 2 = 16$$ $$2 + 3 + 3 + 0 = 8$$ $$1 + 2 + 0 + 0 = 3$$ |
Demand schedule for three consumers such as Mohan, Rohan and Mitu for a commodity is given below. Derive the market demand schedule.
| Price (Rs.) | Demand Schedule of Mohan (Units) | Demand Schedule of Rohan (Units) | Demand Schedule of Mitu (Units) |
| $$1$$ $$2$$ $$3$$ $$4$$ $$5$$ | $$60$$ $$50$$ $$40$$ $$30$$ $$20$$ | $$55$$ $$40$$ $$25$$ $$10$$ $$0$$ | $$24$$ $$13$$ $$5$$ $$0$$ $$0$$ |
From the following table prepare demand schedule for household $$B$$, given demand schedule of household $$A, C$$ and market demand schedule.
| Price (Rs.) | Household $$A$$ (Units) | Household $$B$$ (Units) | Household $$C$$ (Units) | Market Demand (Units) |
| $$7$$ $$6$$ $$5$$ $$4$$ $$3$$ | $$6$$ $$8$$ $$12$$ $$17$$ $$24$$ | - - - - - | $$11$$ $$16$$ $$22$$ $$30$$ $$42$$ | $$26$$ $$36$$ $$51$$ $$71$$ $$98$$ |
Calculate average physical product and marginal physical product, given the following information about total physical product of a firm.
| Employment of Variable Factor (Units) | Employment of Fixed Factor (Units) | Total Physical Product (Units) |
| $$0$$ $$1$$ $$2$$ $$3$$ $$4$$ $$5$$ $$6$$ $$7$$ | $$5$$ $$5$$ $$5$$ $$5$$ $$5$$ $$5$$ $$5$$ $$5$$ | $$0$$ $$10$$ $$24$$ $$40$$ $$56$$ $$70$$ $$80$$ $$84$$ |
Given the following information about a firm, identify the stages of production.
| Units of Labour | $$1$$ | $$2$$ | $$3$$ | $$4$$ | $$5$ | $$6$$ | $$7$$ | $$8$$ |
| Units of output | $$4$$ | $$12$$ | $$24$$ | $$32$$ | $$36$$ | $$36$$ | $$28$$ | $$16$$ |
Complete the following table:
| Output (Units) | Total Cost (Rs.) | Average Variable Cost (Rs.) | Marginal Cost (Rs.) | Average Fixed Cost (Rs.) |
| $$0$$ $$1$$ $$2$$ $$3$$ $$4$$ $$5$$ | $$30$$ - $$68$$ $$84$$ - $$125$$ | - - - $$18$$ - $$19$$ | - $$20$$ - - $$18$$ - | - - - - - $$6$$ |
Demand schedule for commodity - $$X$$ of individual $$A$$ and $$B$$ is given in the following table. Derive the market demand schedule and market demand curve.
| Price of Commodity - $$X (Rs.)$$ | Demand of $$A$$ (Units) | Demand of $$B$$ (Units) |
| $$1$$ $$2$$ $$3$$ $$4$$ $$5$$ | $$9$$ $$7$$ $$6$$ $$4$$ $$3$$ | $$7$$ $$6$$ $$5$$ $$4$$ $$3$$ |
Market Demand Schedule
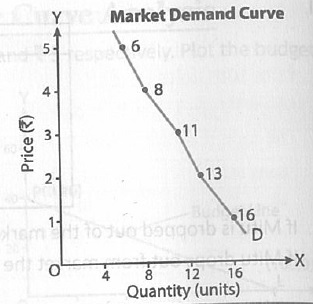
| Price (Rs.) | Quantity (Units) |
| $$1$$ $$2$$ $$3$$ $$4$$ $$5$$ | $$9 + 7 = 16$$ $$7 + 6 = 13$$ $$6 + 5 = 11$$ $$4 + 4 = 8$$ $$3 + 3 = 6$$ |
From the table given below, calculate total revenue, average revenue, and marginal revenue.
| Units Sold | Price (Rs.) | Total Revenue (Rs.) | Marginal Revenue (Rs.) |
| $$5$$ $$4$$ $$3$$ | $$6$$ $$7$$ $$8$$ | - - - | - - - |
Find out the average revenue and marginal revenue on the basis of the following data:
| Units of Production | Total Revenue (Rs.) | Average Revenue (Rs.) | Marginal Revenue (Rs.) |
| $$1$$ $$2$$ $$3$$ $$4$$ $$5$$ $$6$$ $$7$$ | $$20$$ $$36$$ $$48$$ $$56$$ $$60$$ $$60$$ $$56$$ | - | - |
Completer the following table:
| Output (Units) | Average Fixed Cost (Rs.) | Average Variable Cost (Rs.) | Marginal Cost (Rs.) | Total Cost (Rs.) |
| $$1$$ $$2$$ $$3$$ $$4$$ $$5$$ | $$120$$ $$60$$ - $$30$$ - | $$40$$ $$56$$ $$54$$ - - | - - - $$54$$ - | - $$232$$ - - - |
Complete the following table:
| Output (Units) | Price (Rs.) | Total Revenue (Rs.) | Marginal Revenue (Rs.) |
| $$1$$ $$2$$ $$3$$ $$4$$ | - - - - | $$6$$ - - - | - $$2$$ $$-2$$ $$-2$$ |
Complete the following table:
| Output (Units) | Total Cost (Rs.) | Average Variable Cost (Rs.) | Marginal Cost (Rs.) | Average Fixed Cost (Rs.) |
| $$0$$ $$1$$ $$2$$ $$3$$ $$4$$ $$5$$ | $$30$$ - $$78$$ - - $$150$$ | - - - $$23$$ - - | - $$25$$ - - $$23$$ - | - $$30$$ - $$10$$ - $$6$$ |
Complete the following table:
| Output (Units) | Average Revenue (Rs.) | Marginal Revenue (Rs.) | Total Revenue (Rs.) |
| $$1$$ $$2$$ $$3$$ $$4$$ | - - $$11$$ - | $$15$$ - - $$3$$ | - $$26$$ - - |
Complete the following table:
| Output (Units) | Marginal Cost (Rs.) | Average Variable Cost (Rs.) | Total Cost (Rs.) | Average Fixed Cost (Rs.) |
| $$1$$ $$2$$ $$3$$ $$4$$ $$5$$ | $$60$$ - - $$54$$ - | - - $$54$$ - $$57$$ | $$120$$ $$174$$ - - $$345$$ | - - - $$15$$ - |
Complete the following table:
| Output (Units) | Average Fixed Cost (Rs.) | Marginal Cost (Rs.) | Average Variable Cost (Rs.) | Average Cost (Rs.) |
| $$1$$ $$2$$ $$3$$ $$4$$ $$5$$ | $$60$$ - $$20$$ - $$12$$ | $$20$$ - - $$18$$ - | - $$19$$ $$18$$ - - | - - - - $$31$$ |
Calculate marginal revenue using following information:
| Price (Rs.) | $$10$$ | $$9$$ |
| Sale/ Demand (Units) | $$100$$ | $$110$$ |
Complete the following table:
| Output (Units) | Price (Rs.) | Marginal Revenue (Rs.) | Total Revenue (Rs.) |
| $$1$$ $$2$$ $$3$$ $$4$$ | - - $$22$$ - | $$30$$ - - $$6$$ | - $$52$$ - - |
Find producer's equilibrium, from the following. Give logical reason.
| Quantity Sold (Units) | Total Revenue (Rs.) | Total Cost (Rs.) |
| $$5$$ $$6$$ $$7$$ $$8$$ $$9$$ $$10$$ | $$15$$ $$20$$ $$25$$ $$30$$ $$35$$ $$40$$ | $$18$$ $$22$$ $$26$$ $$27$$ $$32$$ $$38$$ |
The following distribution gives the daily income of $$50$$ workers of a factory.
| Daily income (in Rupees) | $$250-300$$ | $$300-350$$ | $$350-400$$ | $$400-450$$ | $$450-500$$ |
| Number of workers | $$12$$ | $$14$$ | $$8$$ | $$6$$ | $$10$$ |
|
Daily income |
Number of workers |
Daily wages (x-axis) |
Cumulative frequency (y-axis) |
|
250-300 |
12 |
<300 |
12 |
|
300-350 |
14 |
<350 |
12+14=26 |
|
350-400 |
8 |
<400 |
26+8=34 |
|
400-450 |
6 |
<450 |
34+6=40 |
|
450-500 |
10 |
<500 |
40+10=50 |
Find the profit maximising level of output.
| Quantity Sold (Units) | Total Revenue (Rs.) | Marginal Cost (Rs.) |
| $$1$$ $$2$$ $$3$$ $$4$$ $$5$$ | $$12$$ $$26$$ $$34$$ $$40$$ $$42$$ | $$15$$ $$9$$ $$6$$ $$2$$ $$3$$ |
Find out the profit from the following:
| Quantity Sold (Units) | Price (Rs. per unit) | Average Cost (Rs.) |
| $$1$$ $$2$$ $$3$$ $$4$$ $$5$$ | $$15$$ $$16$$ $$17$$ $$18$$ $$19$$ | $$15$$ $$12$$ $$10$$ $$12$$ $$14$$ |
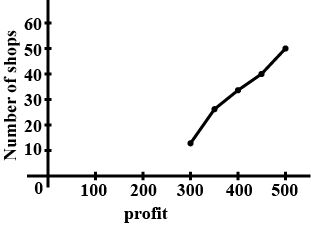
The annual profits earned by $$30$$ shops of a shopping complex in a locality give rise to the following distributions:
| Profit (in lakhs in Rs.) | Number of shops (Frequency) |
| More than or equal to $$5$$ | $$30$$ |
| More than or equal to $$10$$ | $$28$$ |
| More than or equal to $$15$$ | $$16$$ |
| More than or equal to $$20$$ | $$14$$ |
| More than or equal to $$25$$ | $$10$$ |
| More than or equal to $$30$$ | $$7$$ |
| More than or equal to $$35$$ | $$3$$ |
Now, we mark on x-axis lower class limits, y-axis cumulative frequency
Thus, we plot the points $$(5,30),(10,28),(15,16),(20,14),(25,10),(30,7) \,and\, (35,3)$$
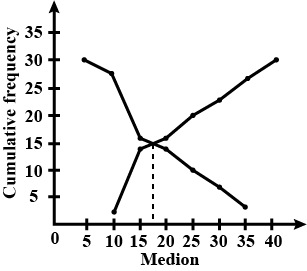
Less than method:
| Profit in lakhs | No. of shops | Profit less than | C.F |
| $$0-10$$ | $$2$$ | $$10$$ | $$2$$ |
| $$10-15$$ | $$12$$ | $$15$$ | $$14$$ |
| $$15-20$$ | $$2$$ | $$20$$ | $$16$$ |
| $$20-25$$ | $$4$$ | $$25$$ | $$20$$ |
| $$25-30$$ | $$3$$ | $$30$$ | $$23$$ |
| $$30-35$$ | $$4$$ | $$35$$ | $$27$$ |
| $$35-40$$ | $$3$$ | $$40$$ | $$30$$ |
Now we mark the upper class limits along x-axis and cumulative frequency along y-axis.
Thus we plot the points $$(10,2),(15,14),(20,16),(25,20),(30,23),(35,27),(40,30)$$
We find that the two types of curves intersect of P from point L it is drawn on x-axis
The value of a profit corresponding to M is $$17.5$$. Hence median is $$17.5\,lakh$$
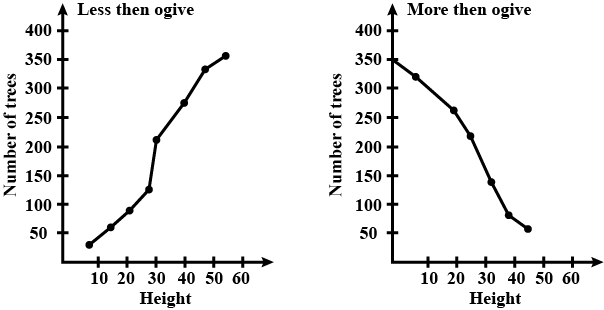
The following table gives the height of trees:
| Height | No. of trees |
| Less than $$7$$ | $$26$$ |
| Less than $$14$$ | $$57$$ |
| Less than $$21$$ | $$92$$ |
| Less than $$28$$ | $$134$$ |
| Less than $$35$$ | $$216$$ |
| Less than $$42$$ | $$287$$ |
| Less than $$49$$ | $$341$$ |
| Less than $$56$$ | $$360$$ |
For less than method :
Plot the points $$(7,26) , (14,57) , (21,92) , (28,134) , (35,216) , (42,287) , (49,341) , (56,360)$$ by taking upper class limit over the x-axis and cumulative frequency over the y-axis.By more than method :
| Height | Frequency | Height more than | cf |
| $$0-7$$ | $$26$$ | $$0$$ | $$360$$ |
| $$7-14$$ | $$31$$ | $$7$$ | $$334$$ |
| $$14-21$$ | $$35$$ | $$14$$ | $$303$$ |
| $$21-28$$ | $$42$$ | $$21$$ | $$268$$ |
| $$28-35$$ | $$82$$ | $$28$$ | $$226$$ |
| $$35-42$$ | $$71$$ | $$35$$ | $$144$$ |
| $$24-49$$ | $$54$$ | $$42$$ | $$73$$ |
| $$49-56$$ | $$19$$ | $$49$$ | $$19$$ |
Complete the following table:
| Output (Units) | Price (Rs.) | Total Revenue (Rs.) | Marginal Revenue (Rs.) |
| - - - - | $$10$$ $$7$$ $$5$$ $$3$$ | - - - - | $$10$$ $$4$$ $$1$$ $$-3$$ |
A perfectly competitive firm faces the market price of $$Rs. 20$$ per unit. Derive its $$TR$$ schedule for a range of output from $$1$$ to $$10$$ units. What will happens to market price if the firm decides to suspend its production for the time being?
Complete the following table:
| Units of Output | Total Revenue (Rs.) | Average Revenue (Rs.) | Marginal Revenue (Rs.) |
| $$1$$ $$2$$ $$3$$ | - - - | $$10$$ $$8$$ $$6$$ | - - - |
Complete the following table:
| Price (Rs.) | Output (Units) | Total Revenue (Rs.) | Marginal Revenue (Rs.) |
| $$7$$ - - $$1$$ | - $$2$$ $$3$$ - | $$7$$ $$10$$ - - | - - $$-1$$ $$-5$$ |
Consider the following distribution:
| Marks | 0 or more | 10 or more | 20 or more | 30 or more | 40 or more | 50 or more |
| Number of Students | 63 | 58 | 55 | 51 | 48 | 42 |
(b) Calculate the class mark of the class 10 - 20.
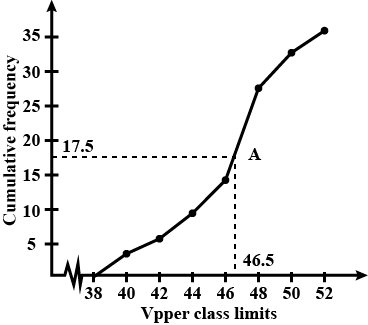
During the medical check-up of $$35$$ students of a class, their weights were recorded as follows :
| Weight (in $$kg$$) | Number of students |
| Less than $$38$$ | $$0$$ |
| Less than $$40$$ | $$3$$ |
| Less than $$42$$ | $$5$$ |
| Less than $$44$$ | $$9$$ |
| Less than $$46$$ | $$14$$ |
| Less than $$48$$ | $$28$$ |
| Less than $$50$$ | $$32$$ |
| Less than $$52$$ | $$35$$ |
Less than method, It is given that,
On x-axis upper class limits. Y-axis cumulative frequency
We plot the points $$(38,0) (40,3)(42,5)(44,9)(46,4)(48,28)(50,32)(52,35)$$
Here, $$N=35$$ so, $$\dfrac{N}{2}=17.5$$
Mark the point $$A$$ whose coordinate is $$17.5$$ and its x-coordinate is $$46.5$$
$$\Rightarrow$$ $$N=35$$ and $$\dfrac{N}{2}=17.5$$
| $$Weight$$ | $$Frequency$$ | $$cf$$ |
| Less than $$38$$ | $$0$$ | $$0$$ |
| $$38-40$$ | $$3$$ | $$3$$ |
| $$40-42$$ | $$2$$ | $$5$$ |
| $$42-44$$ | $$4$$ | $$9$$ |
| $$44-46$$ | $$5$$ | $$14$$ |
| $$46-48$$ | $$14$$ | $$28$$ |
| $$48-50$$ | $$4$$ | $$32$$ |
| $$50-52$$ | $$3$$ | $$35$$ |
| $$N=35$$ |
$$\Rightarrow$$ Class interval is $$46-48$$ then median class $$=46-48$$
$$l =$$ lower limit of the modal class
$$h =$$ size of the class intervals
$$f =$$ frequency of the modal class
$$\Rightarrow$$ $$l=46,\,f=14,\,cf=14,\,h=2$$
$$\Rightarrow$$ $$Median=l+\dfrac{\dfrac{N}{2}-cf}{f}\times h$$
$$\Rightarrow$$ $$Median=46+\dfrac{17.5-14}{14}\times 2$$
$$\Rightarrow$$ $$Median=46+\dfrac{3.5}{7}=46.5$$
$$\therefore$$ Median of this data is $$46.5$$.
Hence, the value of median is verified.
Organise the following marks in a class assessment in a tabular form.
$$4,6,7,5,6,5,4,5,2,6,2,5,1,9,6,5,8,4,6,7$$
The following table shows the details of items purchased in a school for the noon-meal.
| Items | Quantity | Price for $$1$$ kilogram (in rupees) | Total price |
| Tomato | $$2$$ kg | $$20\dfrac{1}{2}$$ | $$41$$ rupees |
| Potato | $$3\dfrac{1}{2}$$ kg | $$25$$ | - |
| Peas | $$5$$ kg | $$30\dfrac{1}{2}$$ | - |
| Dal | $$2\dfrac{1}{4}$$ kg | $$32$$ | - |
The amount collected by $$15$$ students for flood relief find is given below. Answer the following.
| Amount | Number of students |
| $$0-10$$ | $$3$$ |
| $$10-20$$ | $$4$$ |
| $$20-30$$ | $$5$$ |
| $$30-40$$ | $$2$$ |
| $$40-50$$ | $$1$$ |
The weight of new born babies (inn kg) in a hospital on a particular day are as follows
2.3, 2.2, 2.1, 2.7, 2.6, 3.0, 2.5, 2.9, 2.8, 3.1, 2.5, 2.8, 2.7, 2.9, 2.4
(a) How many babies were born on that day?
(b) How many babies weigh below 2.5 kg?
(c) How many babies weigh more than 2.8 kg?
(D) How many babies weigh 2.8?
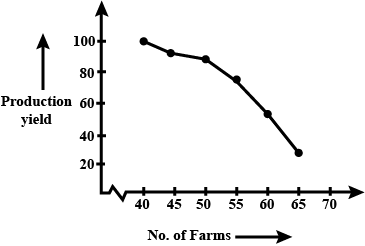
The following tables gives production yield per hectare (in quintals) of wheat of $$100$$ farms of a village.
| Production yield/hect | $$40-45$$ | $$45-50$$ | $$50-55$$ | $$55-60$$ | $$60-65$$ | $$65-70$$ |
| No. of farms | $$4$$ | $$6$$ | $$16$$ | $$20$$ | $$30$$ | $$24$$ |
| Production field | No. of Farms $$(F_i)$$ |
| 40 - 45 | 4 |
| 45 - 50 | 6 |
| 50 - 55 | 16 |
| 55 - 60 | 20 |
| 60 - 65 | 30 |
| 65 - 70 | 24 |
| $$\sum F_i = 100$$ |
| Production yield (X-axis) | No. of Farms (Y -axis) |
| More than 40 | $$100 $$ |
| More than 45 | $$100 - 4 = 96$$ |
| More than 50 | $$96 - 6 = 90$$ |
| More than 55 | $$90 - 16 = 74$$ |
| More than 60 | $$74 - 20 = 54$$ |
| More than 65 | $$54 - 30 = 24$$ |
| Production Yield (X-axis) | No. Of Farms (Y-axis) |
| More than 40 | 100 |
| More than 45 | 96 |
| More than 50 | 90 |
| More than 55 | 74 |
| More than 60 | 54 |
| More than 65 | 24 |
The following is the favourite cartoon characters of $$15$$ children. Doraemon, Jerry, Mickey mouse, Jerry, Tom, Doraemon, Doraemon, Mickey mouse, Mickey mouse, Jerry,, Jerry,, Jerry, Doraemon, Doraemon, Doraemon. Which cartoon character is liked least by the children
The following is the favourite cartoon characters of $$15$$ children.
Doraemon, Jerry, Mickey mouse, Jerry, Tom, Doraemon, Doraemon, Mickey mouse, Mickey mouse, Jerry,, Jerry,, Jerry, Doraemon, Doraemon, Doraemon.
The following are the favorite cartoon characters of $$15$$ children. Doraemon, Jerry, Mickey mouse, Jerry, Tom, Doraemon, Doraemon, Mickey Mouse, Mickey mouse, Jerry, Jerry, Jerry, Doraemon, Doraemon, Doraemon. Which cartoon character is liked by most of the children
The following are the favorite cartoon characters of $$15$$ children.
Doraemon, Jerry, Mickey mouse, Jerry, Tom, Doraemon, Doraemon, Mickey Mouse, Mickey mouse, Jerry, Jerry, Jerry, Doraemon, Doraemon, Doraemon.
The ages of ten students of a group are given below. The ages have been recorded in years and months:
$$8-6,9-0,8-4,9-3,7-8,8-11,8-7,9-2,7-10,8-8$$
What is the highest age?
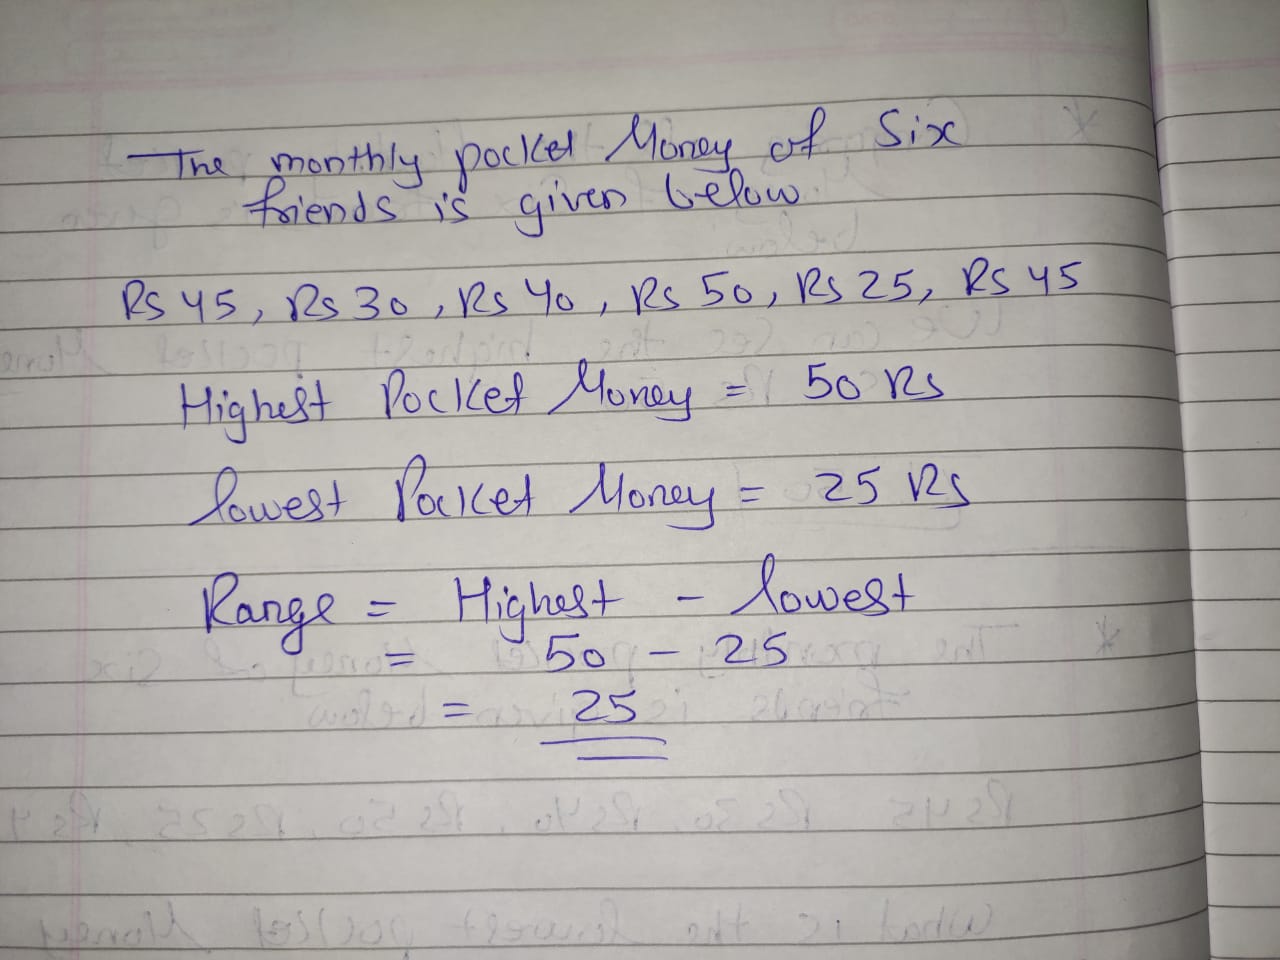
The monthly pocket money of six friends is given below:
Rs. 45, Rs. 30, Rs. 40, Rs. 50, Rs. 25, Rs. 45
What is the highest pocket money?
The monthly pocket money of six friends is given below:
Rs. 45, Rs. 30, Rs. 40, Rs. 50, Rs. 25, Rs. 45
What is the lowest pocket money?
Read the bar graph given in Fig. 23.18 and answer the following question:
What information does it give?
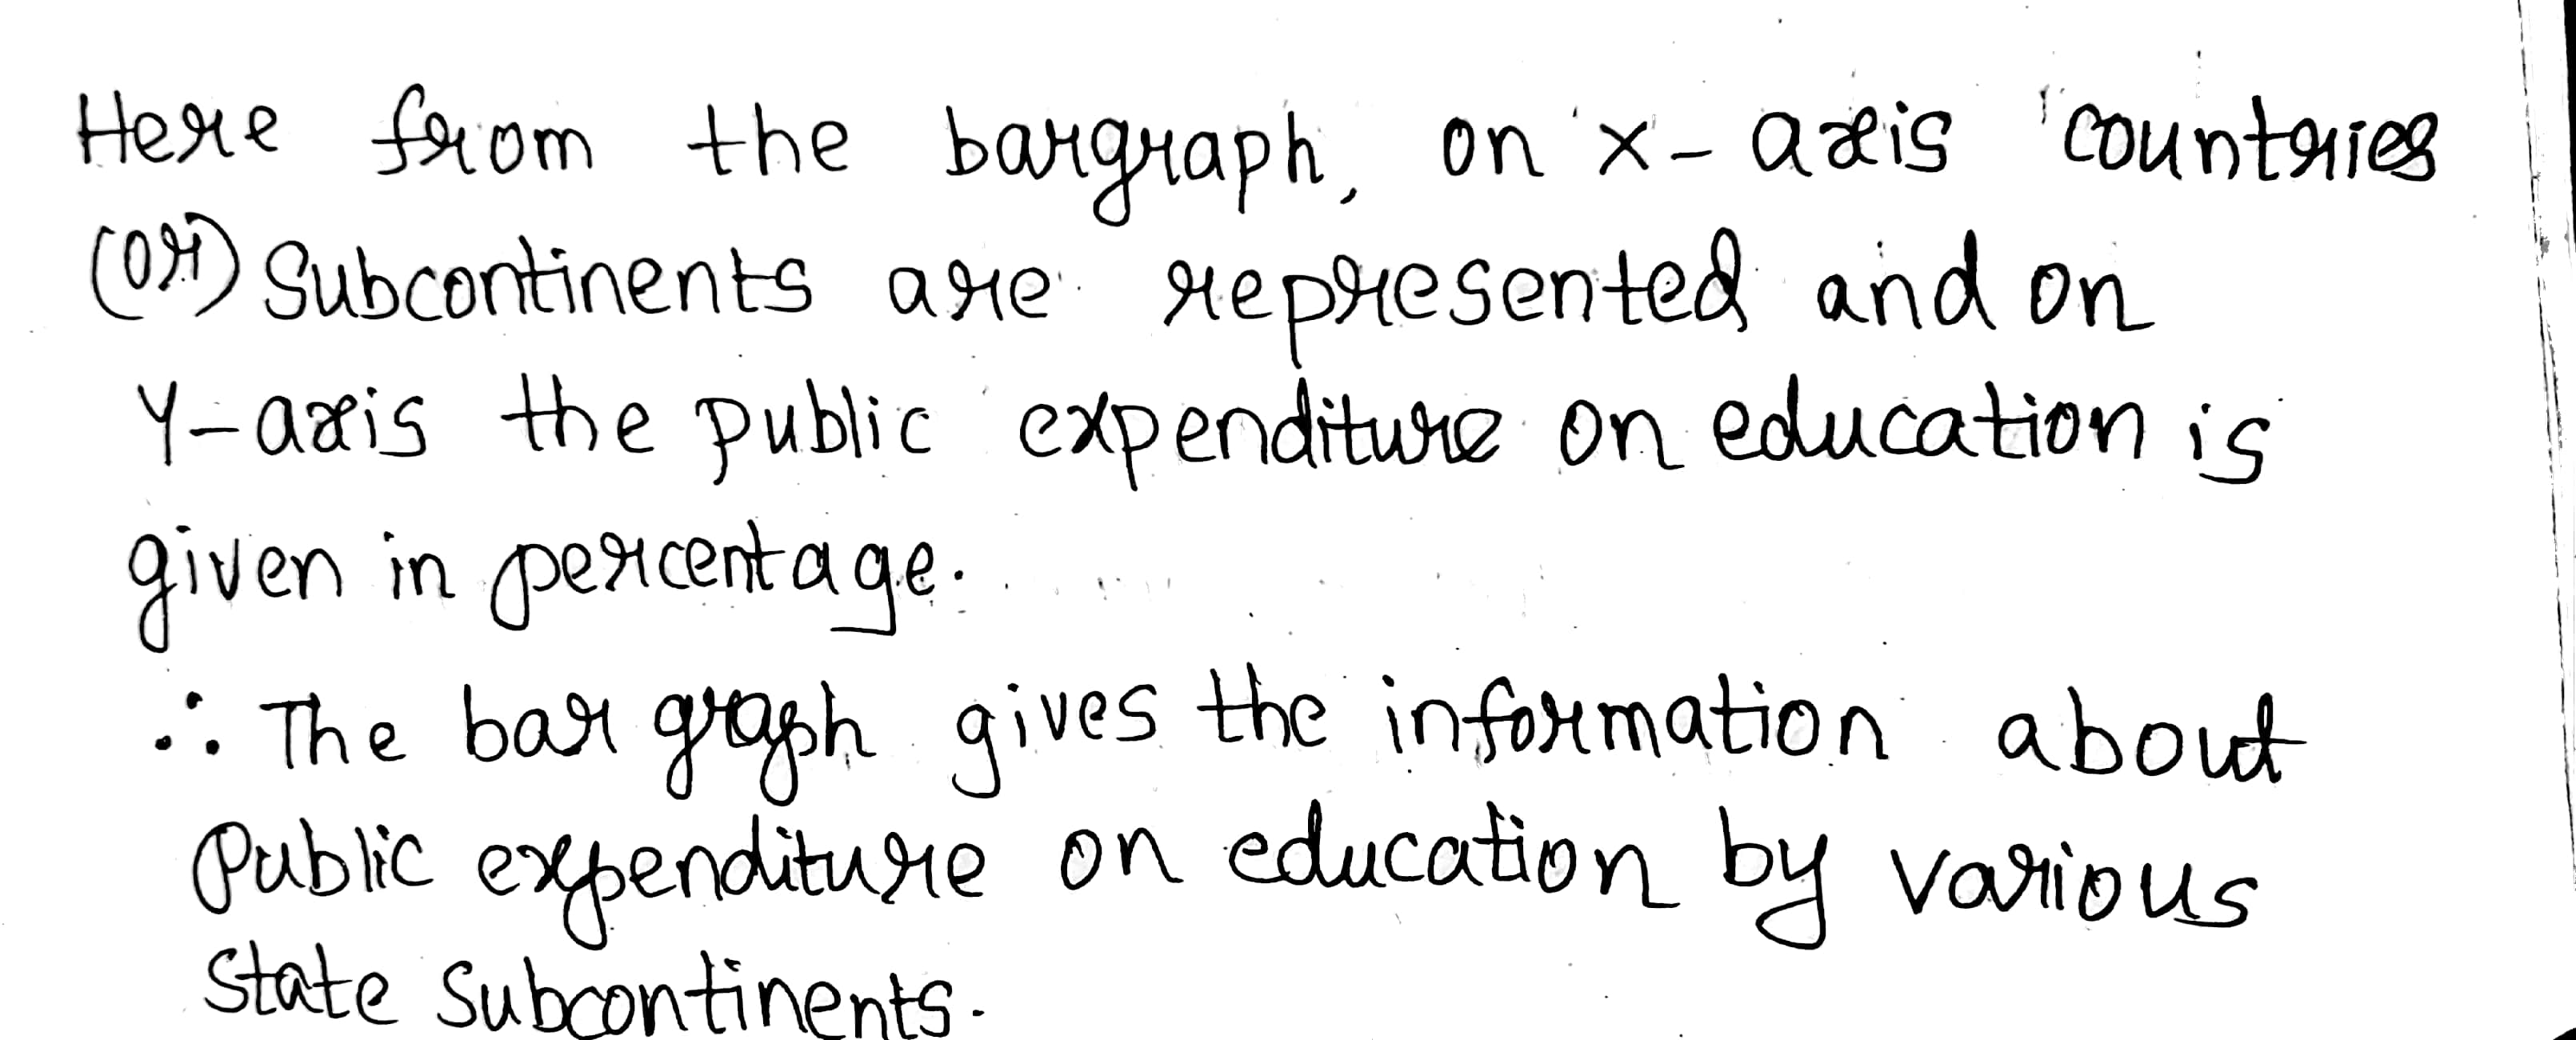
The production of oil (in lakh tonnes) in some of the refineries in India during 1982 was given below :
| Refinery : | Barauni | Koyali | Mathura | Mumbai | Florida |
| Production of oil (in lakh tonnes ) | 30 | 70 | 40 | 45 | 25 |
To represent the given data by a vertical bar graph, we first draw horizontal and vertical axes. Let us consider that the vertical and horizontal axes represent the refineries and the production of oil in lakh tonnes respectively.
We have to draw $$5$$ bars of different lengths given in the table.
At first, we mark $$5$$ points in the vertical axis at equal distances and erect rectangles of the same wk at these points. The lengths of the rectangles are proportional to the productions of oil.
The horizontal bar graph of the given data is following:
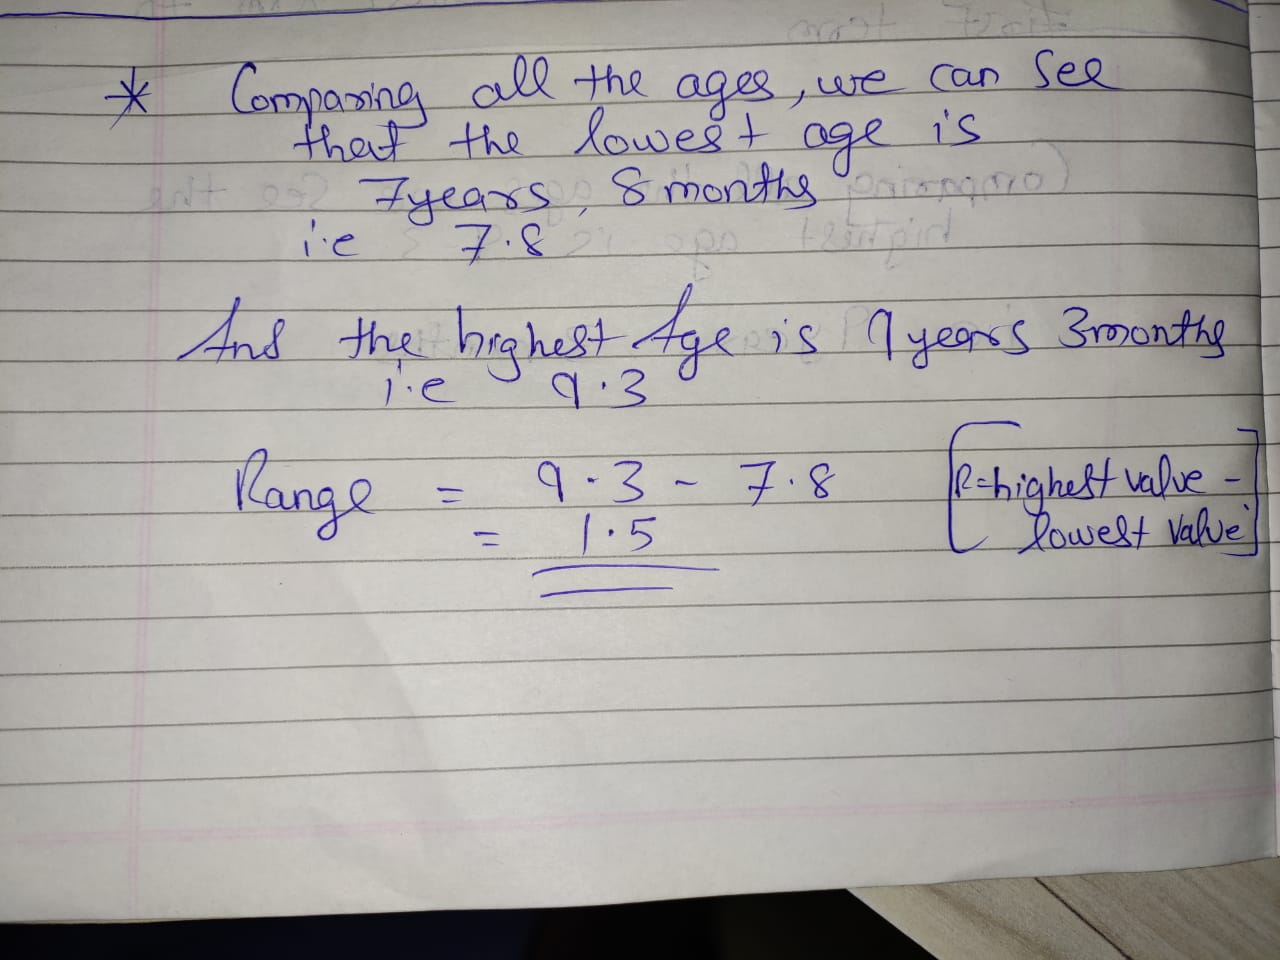
The ages of ten students of a group are given below. The ages have been recorded in years and months:
$$8-6,9-0,8-4,9-3,7-8,8-11,8-7,9-2,7-10,8-8$$
Determine the range?
The monthly pocket money of six friends is given below:
Rs. 45, Rs. 30, Rs. 40, Rs. 50, Rs. 25, Rs. 45
What is the range?
The pie-chart given in Fig. shows the annual agricultural production of an Indian state. If the total production of the all commodities in $$81000\ tonnes,$$ find the production (in tonnes) of
Wheat

The pie chart given in the figure shows the annual agricultural production of an Indian state. If the total production of all commodities is $$81000\ tonnes,$$ find the production (in tones) of
Sugar.
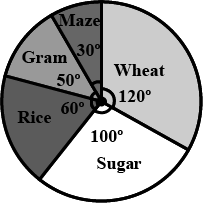
The pie-chart given in Fig.25.18 shows the annual agricultural production of an Indian state. If the total production of the all commodities in $$81000\ tonnes,$$ find the production (in tonnes) of
Gram

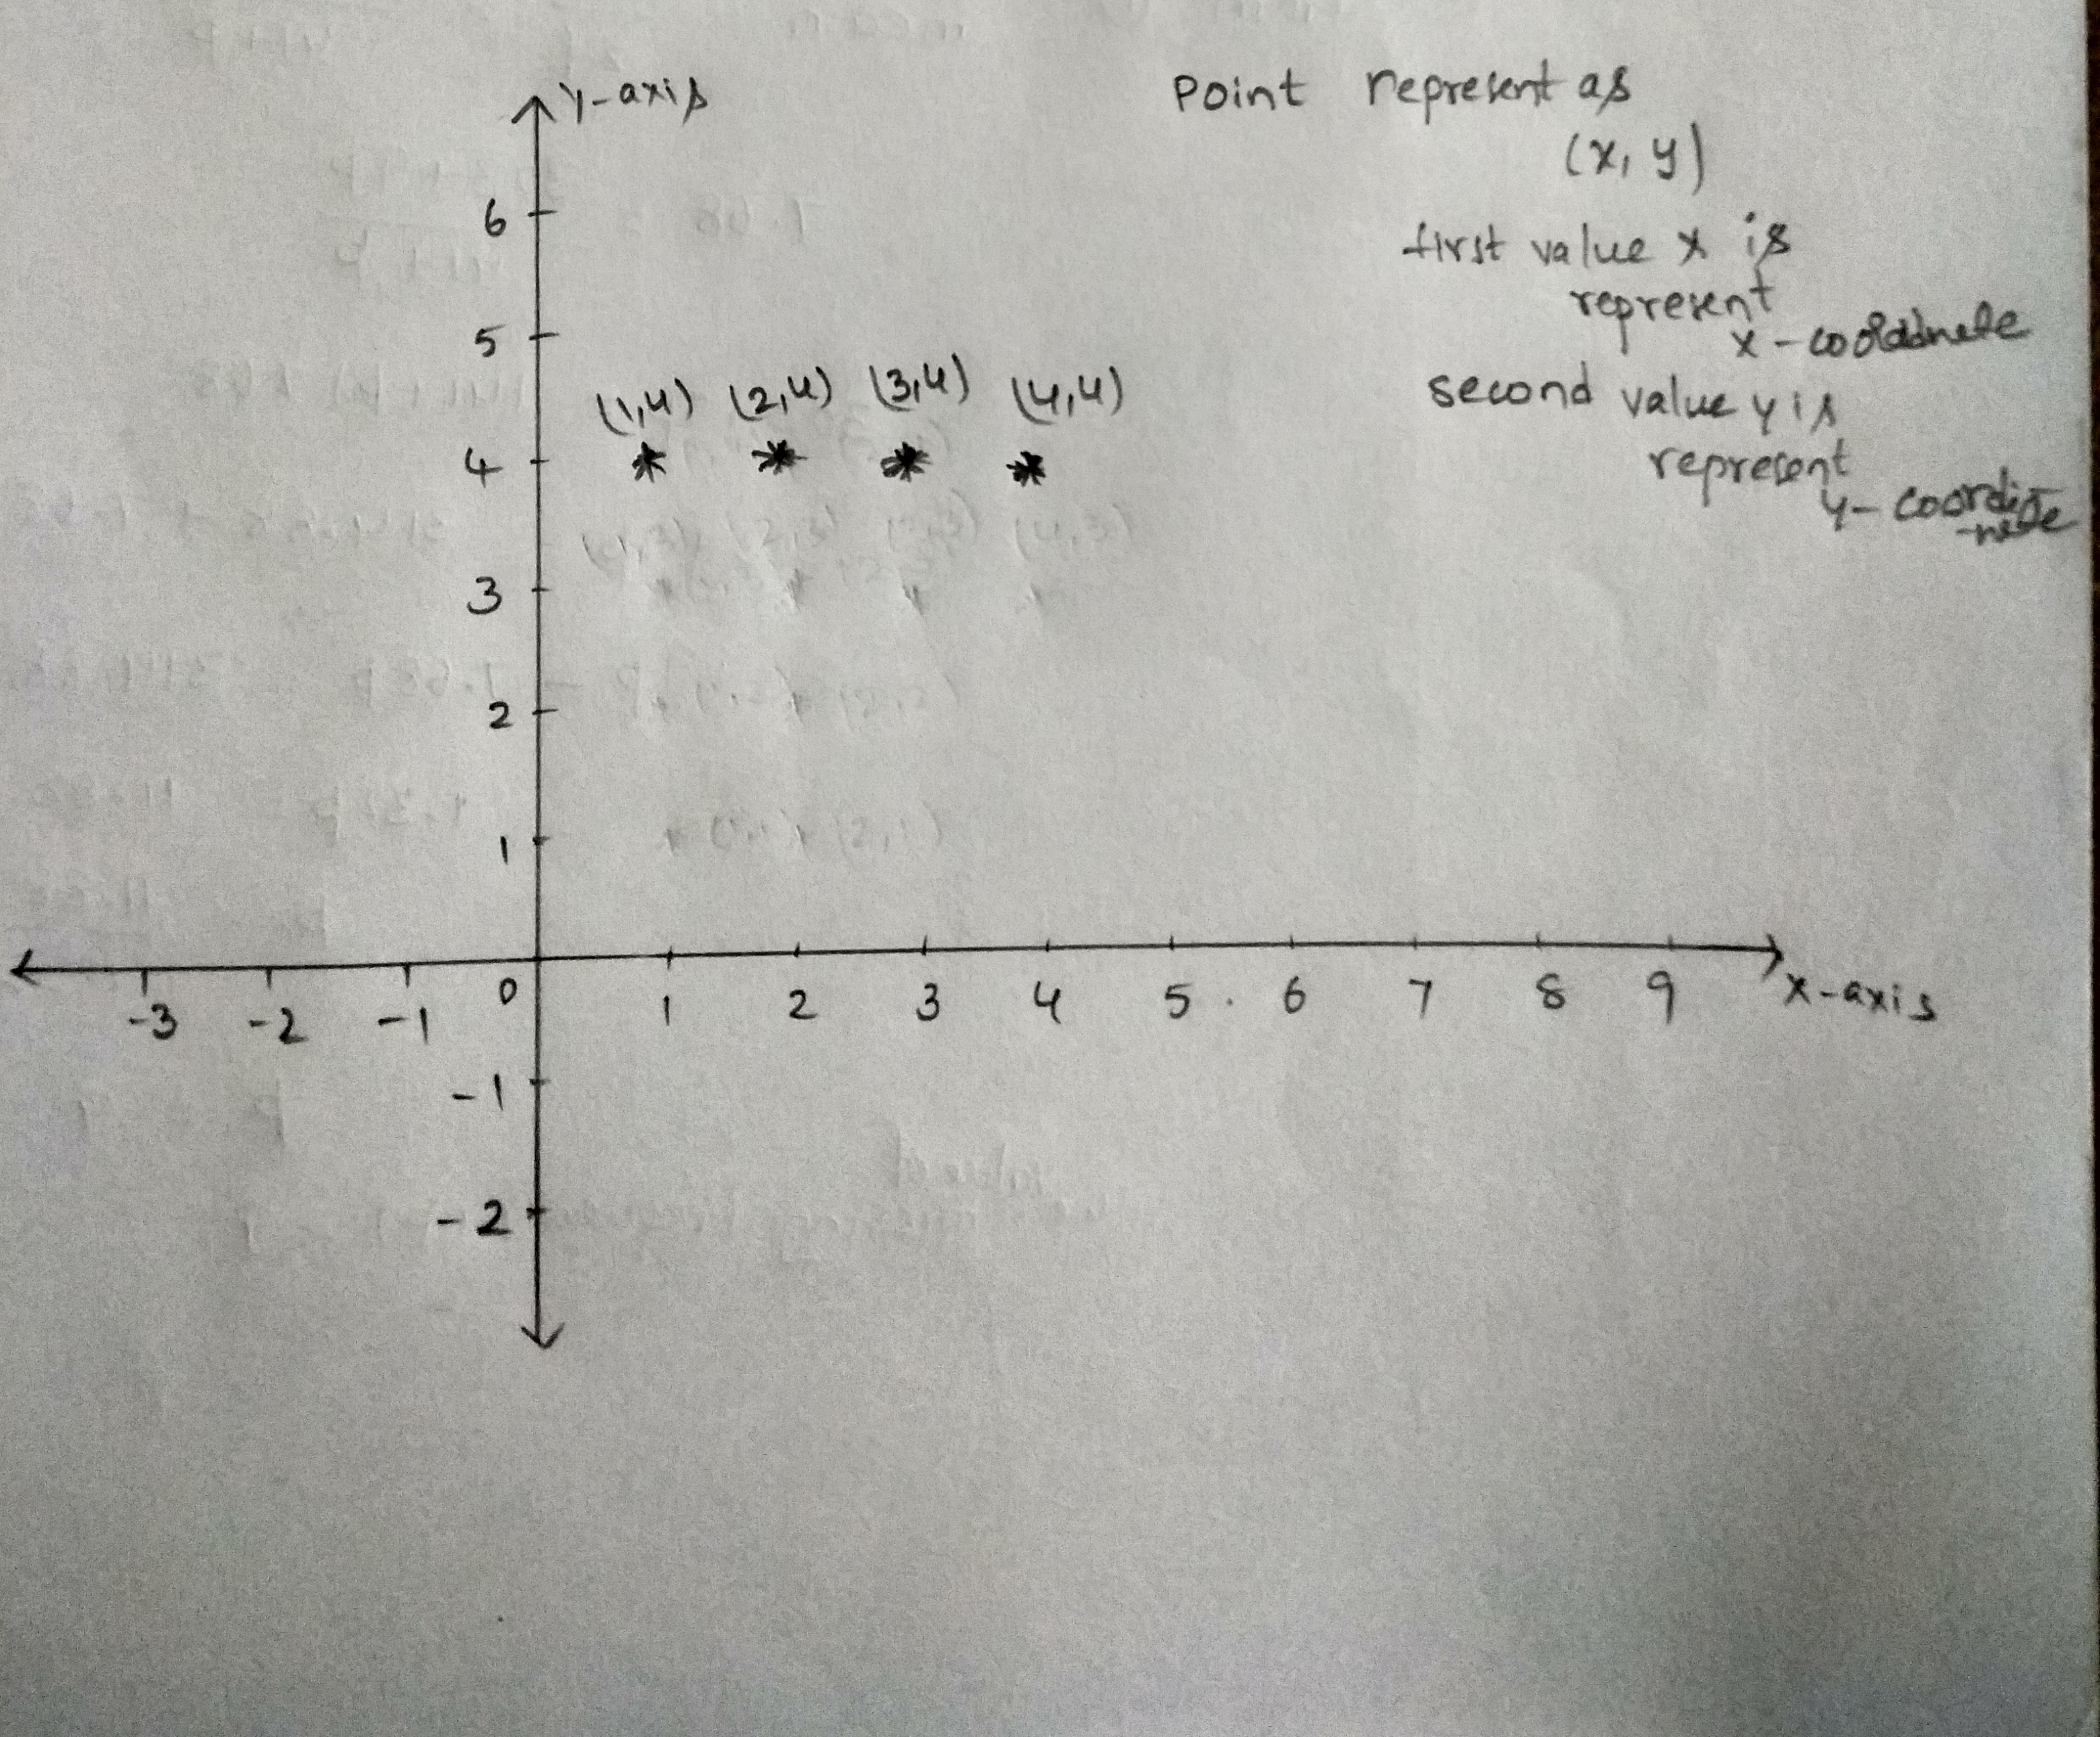
Locate the points:
$$(1,3), (2,3), (3,3), (4,3)$$
Point represent as $$(x,y)$$
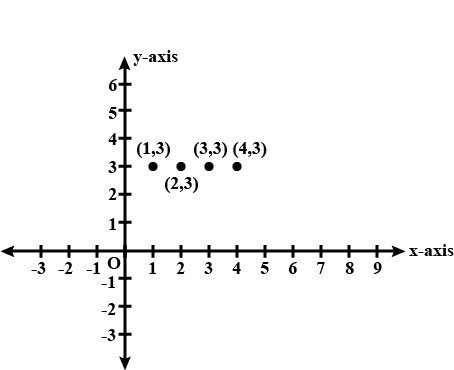
First value $$x$$ is represent x-coordinates
Second value $$y$$ is represent y-coordinates
The pie-chart given in Fig.25.18 shows the annual agricultural production of an Indian state. If the total production of the all commodities in $$81000\ tonnes,$$ find the production (in tonnes) of
Maize

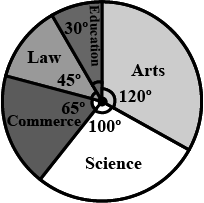
The following pie-chart shows the number of students admitted in different faculties of a college. If $$1000$$ students are admitted in Science answer the following:
What is the total number of students?
The pie-chart given in Fig.25.18 shows the annual agricultural production of an Indian state. If the total production of the all commodities in $$81000\ tonnes,$$ find the production (in tonnes) of
Rice

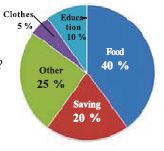
The following pie-chart shows the monthly expenditure of Shikha on various items. If she spends $$Rs\ 16000$$ per month, answer the following question:
How much she spend on rent ? (in Rs)
Locate the points:
$$(1,4), (2,4), (3,4), (4,4)$$
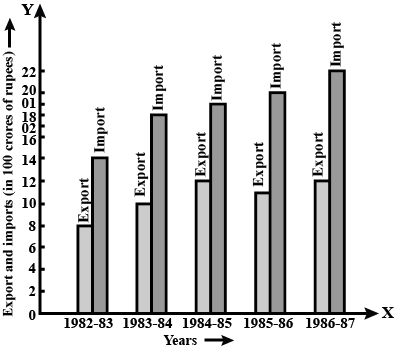
Read the following bar graph and answer the following questions:
In which year the export is minimum?
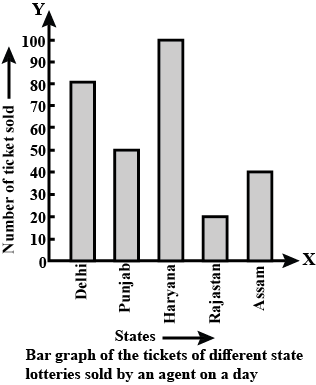
Read the bar graph shown in fig. and answer the following question:
Of which state, were the maximum number of tickets sold?
Read the following bar graph and answer the following questions:
In which year the import is maximum?

Define the following terms: data
The following bar graph (Fig.) represents the heights (in cm) of 50 students of Class XI of a particular school. Study the graph and answer the following questions:
The school wants to provide a particular type of tonic to each student below the height of 150 cm to improve his height. If the cost of the tonic for each student comes out to be Rs 55, how much amount of money is required?

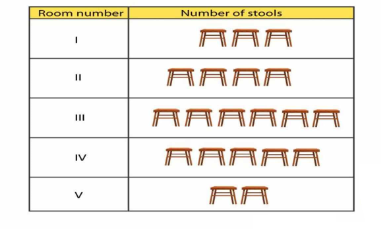
The number of stools in five rooms of a school are given below, Draw a pictograph of stools in the five rooms
| Room number | $$I$$ | $$II$$ | $$III$$ | $$IV$$ | $$V$$ |
| Number of stools | $$30$$ | $$40$$ | $$60$$ | $$50$$ | $$20$$ |
The pictograph of number of stools in five rooms of a school is given:
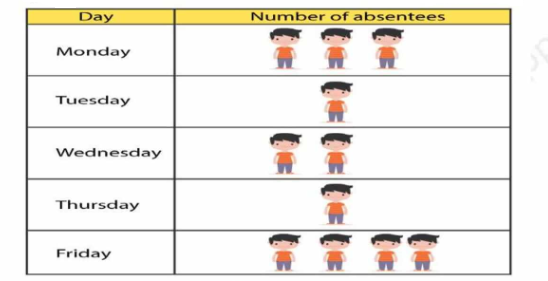
The number of students who were absent from the class during a week is given below, Draw the pictograph of the number of students who were absent from the class during the week.
| Day | Monday | Tuesday | Wednesday | Thursday | Friday |
| No. of absentees | $$6$$ | $$2$$ | $$4$$ | $$2$$ | $$8$$ |
The pictograph of the number of students who were absent from the class during the week is given:
Define the term Observations
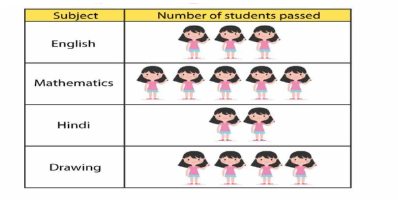
In a class test, the number of students passed in various subjects are given below. Draw the pictograph of number of students passed in various subjects.
| Subject | English | Mathematics | Hindi | Drawing |
| Number of students passes | $$15$$ | $$25$$ | $$10$$ | $$20$$ |

The pictograph of number of students passed in various subjects is given
Define the term:
Tabulation of data
| No. of children | $$0$$ | $$1$$ | $$2$$ | $$3$$ | $$4$$ | $$5$$ |
| No. of families | $$5$$ | $$11$$ | $$25$$ | $$12$$ | $$5$$ | $$2$$ |
Fill in the blanks:
Arranging the data in the form of a table is called ................ of data.
Some people of society decreased with area with flags and tricolour ribbons on Republic day. the following data shown the number of person in different age group who participated in the decoration.
| Age (in years) | $$5-15$$ | $$15-25$$ | $$25-35$$ | $$35-45$$ | $$45-55$$ | $$55-65$$ |
| Number of patients | $$6$$ | $$11$$ | $$21$$ | $$23$$ | $$14$$ | $$5$$ |
Define the term Tabulation of data
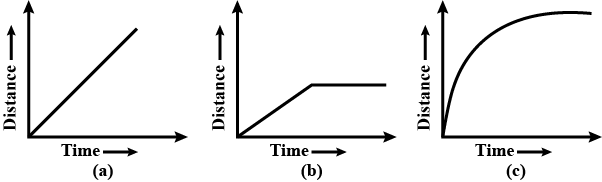
Explain the situations represented by the following distance- time graphs.
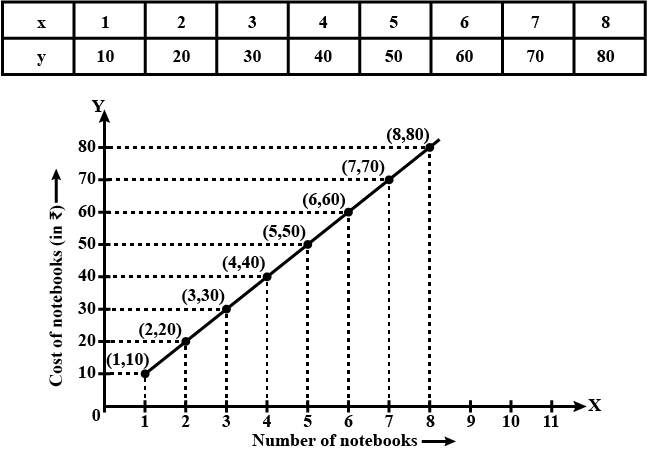
The cost of a notebook is Rs $$10$$. Draw a graph after making a table showing the cost of 2, 3, 4 ... notebooks. Use it to find(a) the cost of $$7$$ notebooks. (b) the number of notebooks that can be purchased with Rs$$50$$.
Let $$x$$ be the number of notebooks
and $$y$$ be the cost of notebooks
Then, the table is completed as shown.
And hence, the graph is plotted from the table.
(a) The cost of $$7$$ notebooks is equal to the ordinate of the point $$(7,70)$$,
i.e. cost of $$7$$ notebooks $$=$$ Rs $$70$$
(b) The number of notebooks that can be purchased with Rs 50 is equal to the abscissa of the point $$(5,50)$$.
Hence, $$5$$ notebooks can be purchased with Rs $$50.$$
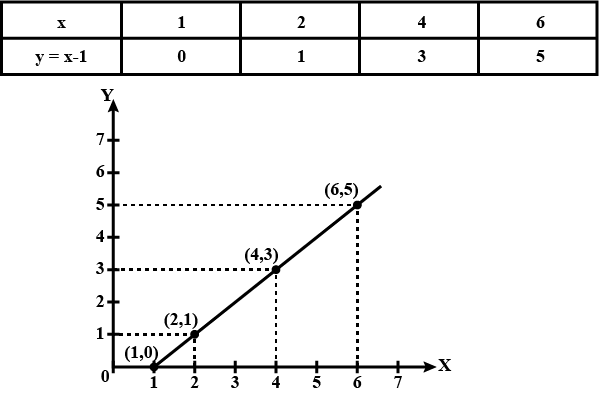
Complete the given tables and draw a graph for each.
Second table:
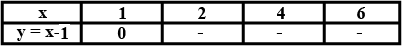
Given,
$$y=x-1$$
Therefore,
for $$x=2, y=(2)-1=1$$
for $$x=4, y=(4)-1=3$$
for $$x=6, y=(6)-1=5$$
The graph of the given data in table is plotted as shown.
Complete the given table and draw a graph.
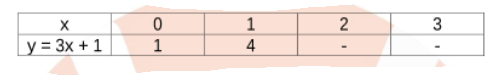
Given, $$y=3x+1$$
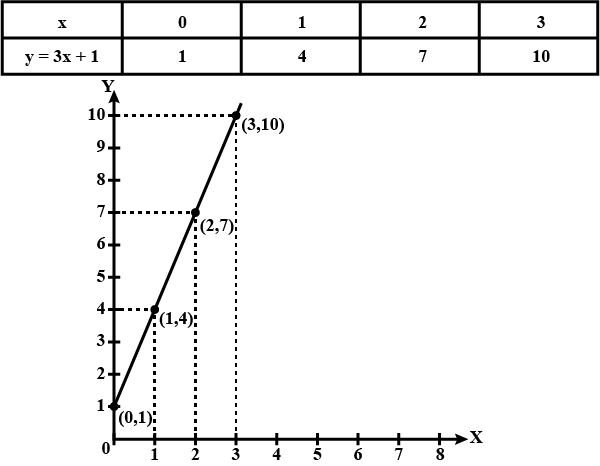
Therefore,
for $$x=2,\ y=3(2)+1=6+1=7$$
for $$x=3,\ y=3(3)+1=9+1=10$$
The graph of the given data in table is plotted as shown.
The following table gives the number of pages written by Sarika for completing her own book for 30 days :
| Number of pages written per day | 16-18 | 19-21 | 22-24 | 25-27 | 28-30 |
| Number of days | 1 | 3 | 4 | 9 | 13 |
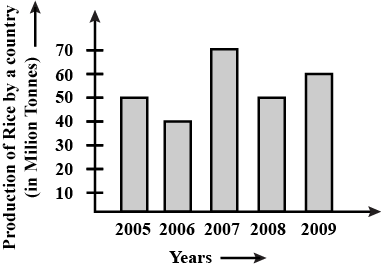
Study the bar graph given below and answer the question that follow:
(a) What information does the above bar graph represent?
(b) In which year was production the least?
(c) After which year was the maximum rise in the production?
(d) Find the average production of rice during the 5 years.
(e) Find the difference of rice production between years $$2006\, and\, 2008$$.
Below is a list of 10 tallest buildings in India.
This list ranks buildings in India that stand at least 150m (492 ft.) tall, based on standard height measurement. This includes spires and architectural details but does not include antenna marks. Following data is given as per the available information tillSince new buildings are always under construction, go on-line to check new taller buildings.
Use the information given in the table about skyscrapers to answer the following questions:
| Name | City | Height | Floors | Year |
| Planet UB Tower Ashok Towers The Imperial I The Imperial II RNA Mirage Oberoi Woods Tower I Oberoi Woods Tower II Oberoi Woods Tower III MVRDC | | |
Make a table corresponding to the above graph:
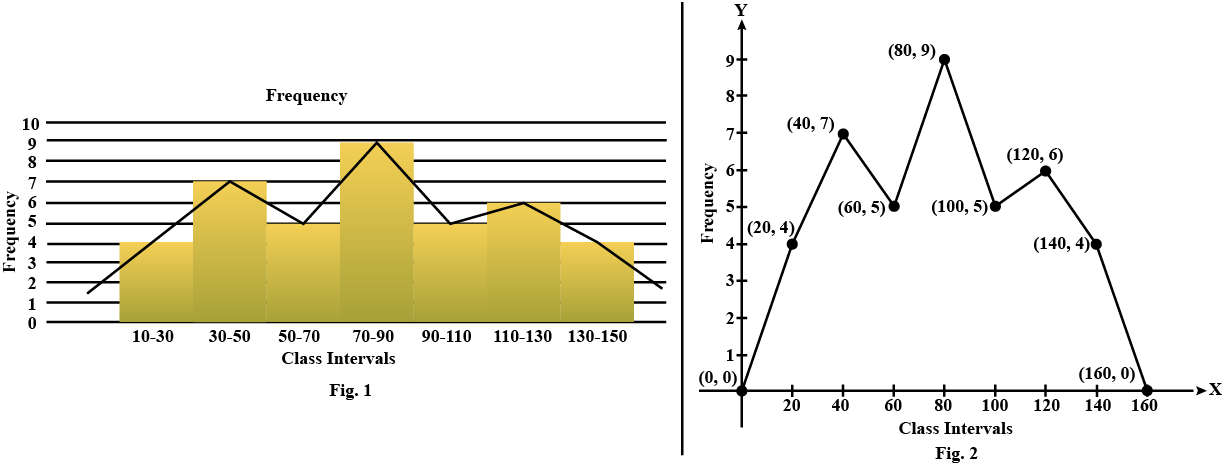
Draw frequency polygons for each of the following frequency distribution;
(a). Using histogram
(b). Without using histogram
(i)
| $$C.I$$ | $$10-30$$ | $$30-50$$ | $$50-70$$ | $$70-90$$ | $$90-110$$ | $$110-130$$ | $$130-150$$ |
| $$f$$ | $$4$$ | $$7$$ | $$5$$ | $$9$$ | $$5$$ | $$6$$ | $$4$$ |
$$(i)$$
$$(a)$$ Using Histrogram
$$C.I$$ $$f$$
$$10-30$$ $$4$$
$$30-50$$ $$7$$
$$50-70$$ $$5$$
$$70-90$$ $$9$$
$$90-110$$ $$5$$
$$110-130$$ $$6$$
$$130-150$$ $$4$$
Steps:
$$i.$$ Draw a histogram for the given data.
$$ii.$$ Mark the mid-point at the top of each rectangle of the histogram drawn.
$$iii.$$ Also, mark the mid-point of the immediately lower class-interval and mid-point of the immediately higher class-interval.
$$iv.$$ Join the consecutive mid-points marked by straight lines to obtain the required frequency polygon.
(b) Without using Histogram:
Steps:
$$i.$$ Find the class-mark (mid-value) of each given class-interval.
$$Class-mark=mid-value=\dfrac {Upper\ limit + Lower\ limit}{2}$$
$$ii.$$ On a graph paper, mark class-marks along $$X-$$axis and frequencies along $$Y-$$axis.
$$iii.$$ On the graph paper, mark point taking values of class-marks along $$X-$$axis and the values of their corresponding frequencies along $$Y-$$axis.
$$iv.$$ Draw the line segments joining the consecutive point marked in step $$(3)$$ above.
$$C.I.$$ Class-mark $$f$$
$$-10-10$$ $$0$$ $$0$$
$$10-30$$ $$20$$ $$4$$
$$30-50$$ $$40$$ $$7$$
$$50-70$$ $$60$$ $$5$$
$$70-90$$ $$80$$ $$9$$
$$90-110$$ $$100$$ $$5$$
$$110-130$$ $$120$$ $$6$$
$$130-150$$ $$140$$ $$4$$
$$150-170$$ $$160$$ $$0$$
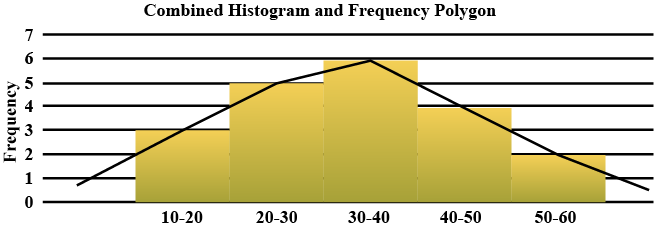
Construct a combined histogram and frequency polygon for the following frequency distribution:
| Class-intervals | $$10-20$$ | $$20-30$$ | $$30-40$$ | $$40-50$$ | $$50-60$$ |
| Frequency | $$3$$ | $$5$$ | $$6$$ | $$4$$ | $$2$$ |
Steps:
(i) Draw a histogram for the given data.
(ii) Mark the mid-points at the top of each rectangle of the histogram drawn.
(iii) Also, mark the mid-point of the immediately lower class-interval and mid-point of the immediately higher class-interval.
(iv)Join the consecutive midpoints marked by straight lines to obtain the required frequency polygon.
The required combined histrogram and frequency polygon is shown in the following figure:
The ages of $$40$$ students are given in the following table:
| Age (in yrs) | 12 | 13 | 14 | 15 | 16 | 17 | 18 |
| Frequency | 2 | 4 | 6 | 9 | 8 | 7 | 4 |
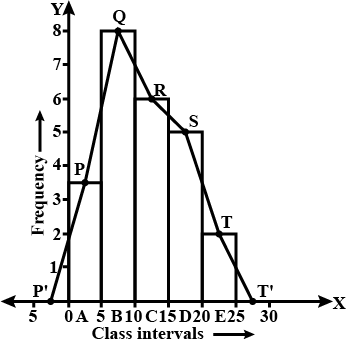
| C.I. | $$0-5$$ | $$5-10$$ | $$10-15$$ | $$15-20$$ | $$20-25$$ |
| Frequency | $$4$$ | $$8$$ | $$6$$ | $$4$$ | $$2$$ |
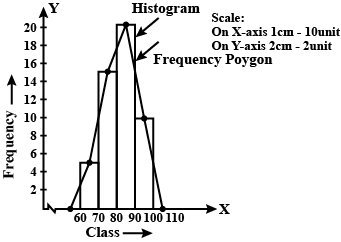
The given frequency distribution is grouped and continuous. so we construct a histogram. After that we join the middle points i/e., $$P, Q, R, S, T$$ of upper horizontal lines of rectangles $$A, B, C, D, E$$ respectively by straight lines. Since nothing is said here about initial and last intervals, so join the end points with the middle points of these intervals on the x-axis. We thus, obtained the frequency polygon $$P'PQRSTT'$$ for the given frequency distribution.
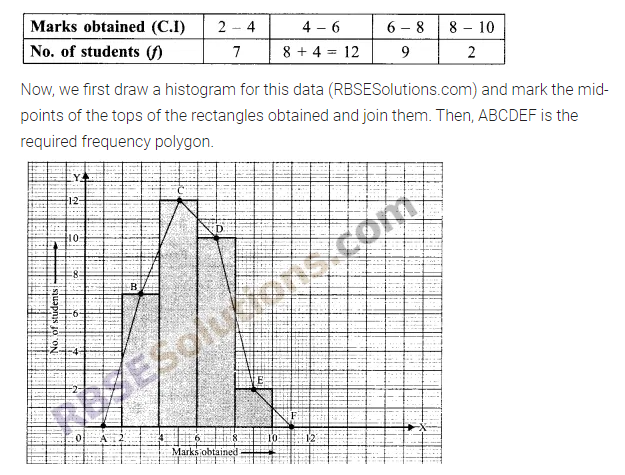
Construct a frequency polygon with the help of histogram for the following frequency distribution. Maximum marks is $$10$$.
| Marks obtained | $$2-4$$ | $$4-6$$ | $$4-6$$ | $$6-8$$ | $$8-10$$ |
| No. of students | $$7$$ | $$8$$ | $$4$$ | $$9$$ | $$2$$ |
Here, we see that class interval $$4 - 6$$ is repeated. So, we need to make certain modifications.
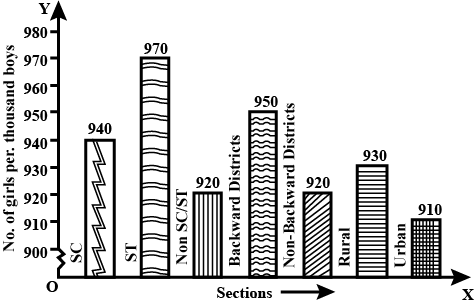
| S.No. | Section | Number of Girls per thousand Boys |
| 1 | Scheduled Caste (SC) | 940 |
| 2 | Scheduled Tribe (ST) | 970 |
| 3 | Non SC/ST | 920 |
| 4 | Backward districts | 950 |
| 5 | Non-backward districts | 920 |
| 6 | Rural | 930 |
| 7 | Urban | 910 |
(i) Represent the information above by a bar graph.
(ii) In the class room, discuss what conclusions can be arrived from the graph.
(i) Taking different sections of the society on the x-axis and number of girls per thousand boys on the y-axis, we draw a bar graph to represent the above data.
We-take one unit of length along y-axis = 10 girls
(ii) (a) The number of girls per thousand boys under Non SC/ST and non-backward districts are same as $$920$$.
(b) Number of girls under section Scheduled Tribe (ST) per thousand boys is maximum i.e. $$970$$ while minimum $$910$$ inn Urban section.
We-take one unit of length along y-axis = 10 girls
(ii) (a) The number of girls per thousand boys under Non SC/ST and non-backward districts are same as $$920$$.
(b) Number of girls under section Scheduled Tribe (ST) per thousand boys is maximum i.e. $$970$$ while minimum $$910$$ inn Urban section.
Name the type of data which a university uses while finding out average of best four subjects out of five, from your marks sheet.
| Class Interval (C.I) | $$0-5$$ | $$5-10$$ | $$10-15$$ | $$15-20$$ | $$20-25$$ | $$25-30$$ | $$30-35$$ |
| Frequency | $$1$$ | $$2$$ | $$4$$ | $$6$$ | $$5$$ | $$3$$ | $$2$$ |
We take $$OX$$ and $$OY$$ as x-axis and y-axis respectively $$O$$ as the origin.
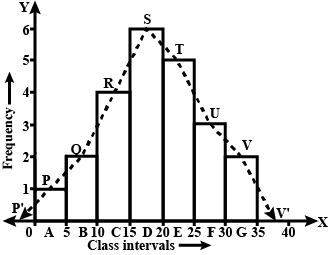
By taking suitable scale at the x-axis as $$1 cm = 5$$ units and y-axis as $$1 cm = 1$$ unit,
we draw graph of the given distribution and join the upper mid-point of the rectangles $$A, B, C, D, E,F$$, and $$G$$.
Hence,
$$P'PQRSTUVV'$$ from the required frequency polygon.
| Height (in cm) | 135 - 140 | 140 - 145 | 145 - 150 | 150 - 155 | 155 - 160 |
| Frequency | 8 | 20 | 12 | 11 | 9 |
The given frequency distribution is grouped and continuous.
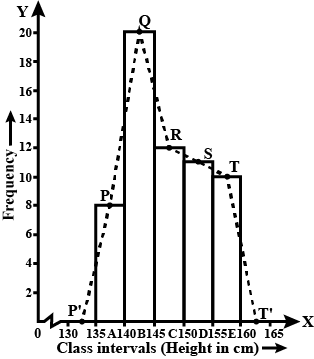
so we construct a histogram. After that, we join the middle points
i.e., $$P, Q, R, S, T$$ of upper horizontal lines of rectangles $$A, B, C, D, E$$ respectively by straight lines. Since nothing is said here about initial and last intervals,
so join the endpoints with the middle points of these intervals on the x-axis.
We, thus, obtained the frequency polygon $$P'PQRSTT'$$ for the given frequency distribution.
The following are marks obtained by a group of 40 class X students in an english examination:
| 42 | 88 | 37 | 75 | 98 | 93 | 73 | 62 | 96 | 80 |
| 52 | 76 | 66 | 54 | 73 | 69 | 83 | 62 | 53 | 79 |
| 69 | 56 | 81 | 75 | 52 | 65 | 49 | 80 | 67 | 59 |
| 88 | 80 | 44 | 71 | 72 | 87 | 91 | 82 | 89 | 79 |
for these data using a class interval of 5.
Change the following data into 'less than type' distribution and draw its ogive:
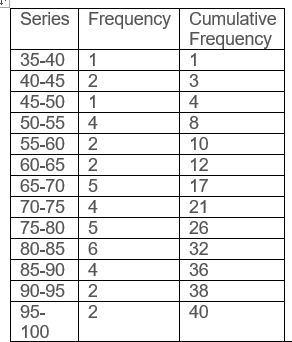
| Clas Interval : | $$30 - 40$$ | $$40 - 50$$ | $$50 - 60$$ | $$60 - 70$$ | $$70 - 80$$ | $$80 - 90$$ | $$90 - 100$$ |
| Frequency : | $$7$$ | $$5$$ | $$8$$ | $$10$$ | $$6$$ | $$6$$ | $$8$$ |
$$\textbf{Step 1: Obtain the cumulative frequency distribution table.}$$
$$\text{The cumulative frequency distribution table is as follows:}$$
$$\text{Class Interval}$$ $$\text{F}$$ $$\text{CF(less than type)}$$
$$30 - 40$$ $$7$$ $$7$$
$$40 - 50$$ $$5$$ $$12$$
$$50 - 60$$ $$8$$ $$20$$
$$60 - 70$$ $$10$$ $$30$$
$$70 - 80$$ $$6$$ $$36$$
$$80 - 90$$ $$6$$ $$42$$
$$90 - 100$$ $$8$$ $$50$$
$$\textbf{Step 2: Obtain the less than type ogive.}$$
$$\text{The points to be plotted are:}$$
$$\mathrm{(30,0),(40,7),(50,12),(60,20),(70,30),(80,36),(90,42)\ and\ (100,50).}$$
$$\text{These points are joined to obtain the required ogive.}$$
$$\textbf{Hence, the required less than type ogive is obtained.}$$
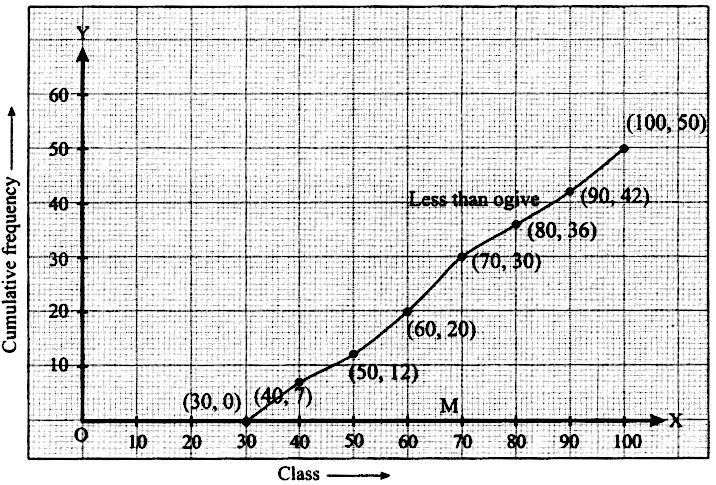
Draw less than ogive curve from the following data.
|
Marks |
Students |
|
0-10 |
5 |
|
10-20 |
12 |
|
20-30 |
20 |
|
30-40 |
11 |
|
40-50 |
9 |
|
50-60 |
7 |
| Marks | Students |
| Less than 10 | 5 |
| Less than 20 | 5 + 12 = 17 |
| Less than 30 | 17 + 20 = 37 |
| Less than 40 | 37 + 11 = 48 |
| Less than 50 | 48 + 9 = 57 |
| Less than 60 | 57 + 7 = 64 |
Following data relate to the marks secured by students in their statistics paper. Graph these data in the form of less than ogive.Marks
No. of Students
0-5
4
5-10
6
10-15
10
15-20
10
20-25
25
25-30
22
30-35
18
35-40
5
Marks | No. of Students |
0-5 | 4 |
5-10 | 6 |
10-15 | 10 |
15-20 | 10 |
20-25 | 25 |
25-30 | 22 |
30-35 | 18 |
35-40 | 5 |

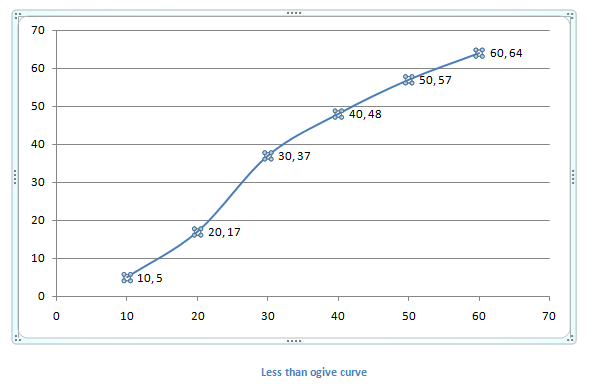
Present the data in the form of a simple bar diagram.
| Year | 1970 | 1980 | 1990 | 2000 |
| Production of Wheat (million tonnes) | 100 | 210 | 350 | 500 |
The answer is given as:
Explain the necessity and usefulness of diagrammatic presentation of data.
In the following table, data of the transport means used by students $$8th$$ standard for commutation between home and school is give. Draw a subdivided bar diagrame to show the data.
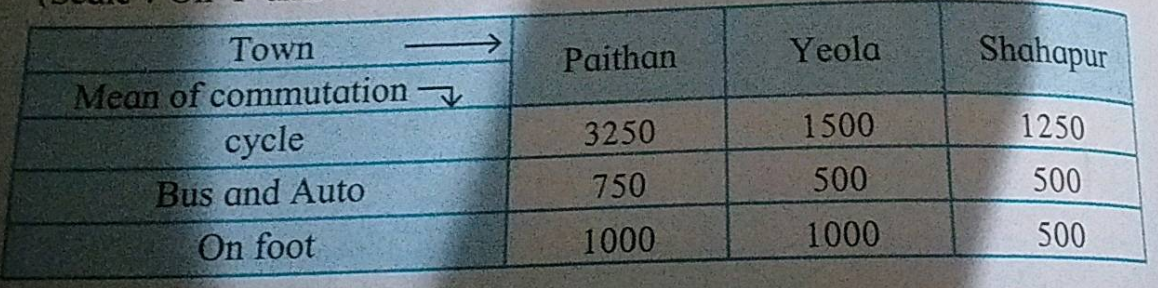
Given Table
We have draw subdivided bar graph
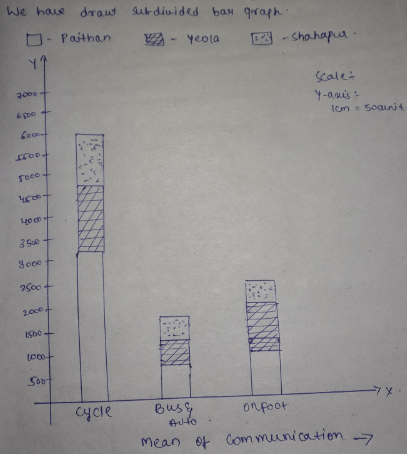
| Town mean of communication | Paithan | Yeoca | Shanapur |
| Cycle | $$3250$$ | $$1500$$ | $$1250$$ |
| Bus & Auto | $$750$$ | $$500$$ | $$500$$ |
| On Foot | $$1000$$ | $$1000$$ | $$500$$ |
The final marks in mathematics of 30 students are as follows:
$$53,61,48,60,78,68,55,100,67,90$$
$$75,88,77,37,84,58,60,48,62,56$$
$$44,58,52,64,98,59,70,39,50,60$$
If 40 is the pass mark how many have failed?
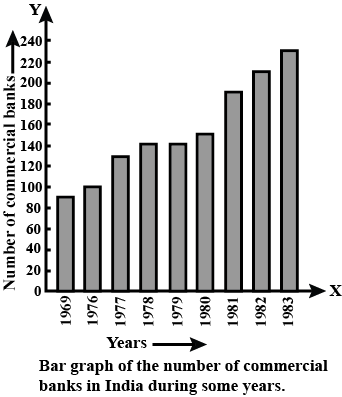
Read the bar graph shown in Fig. and answer the following questions: What was the number of commercial banks in 1977?

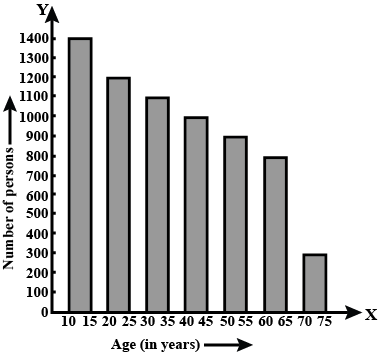
Study the bar graph representing the number of persons in various age groups in a town shown in Fig. Observe the bar graph and answer the following questions:
What is the total number of persons living in the town in the age-groups 10-15 and 60-65?
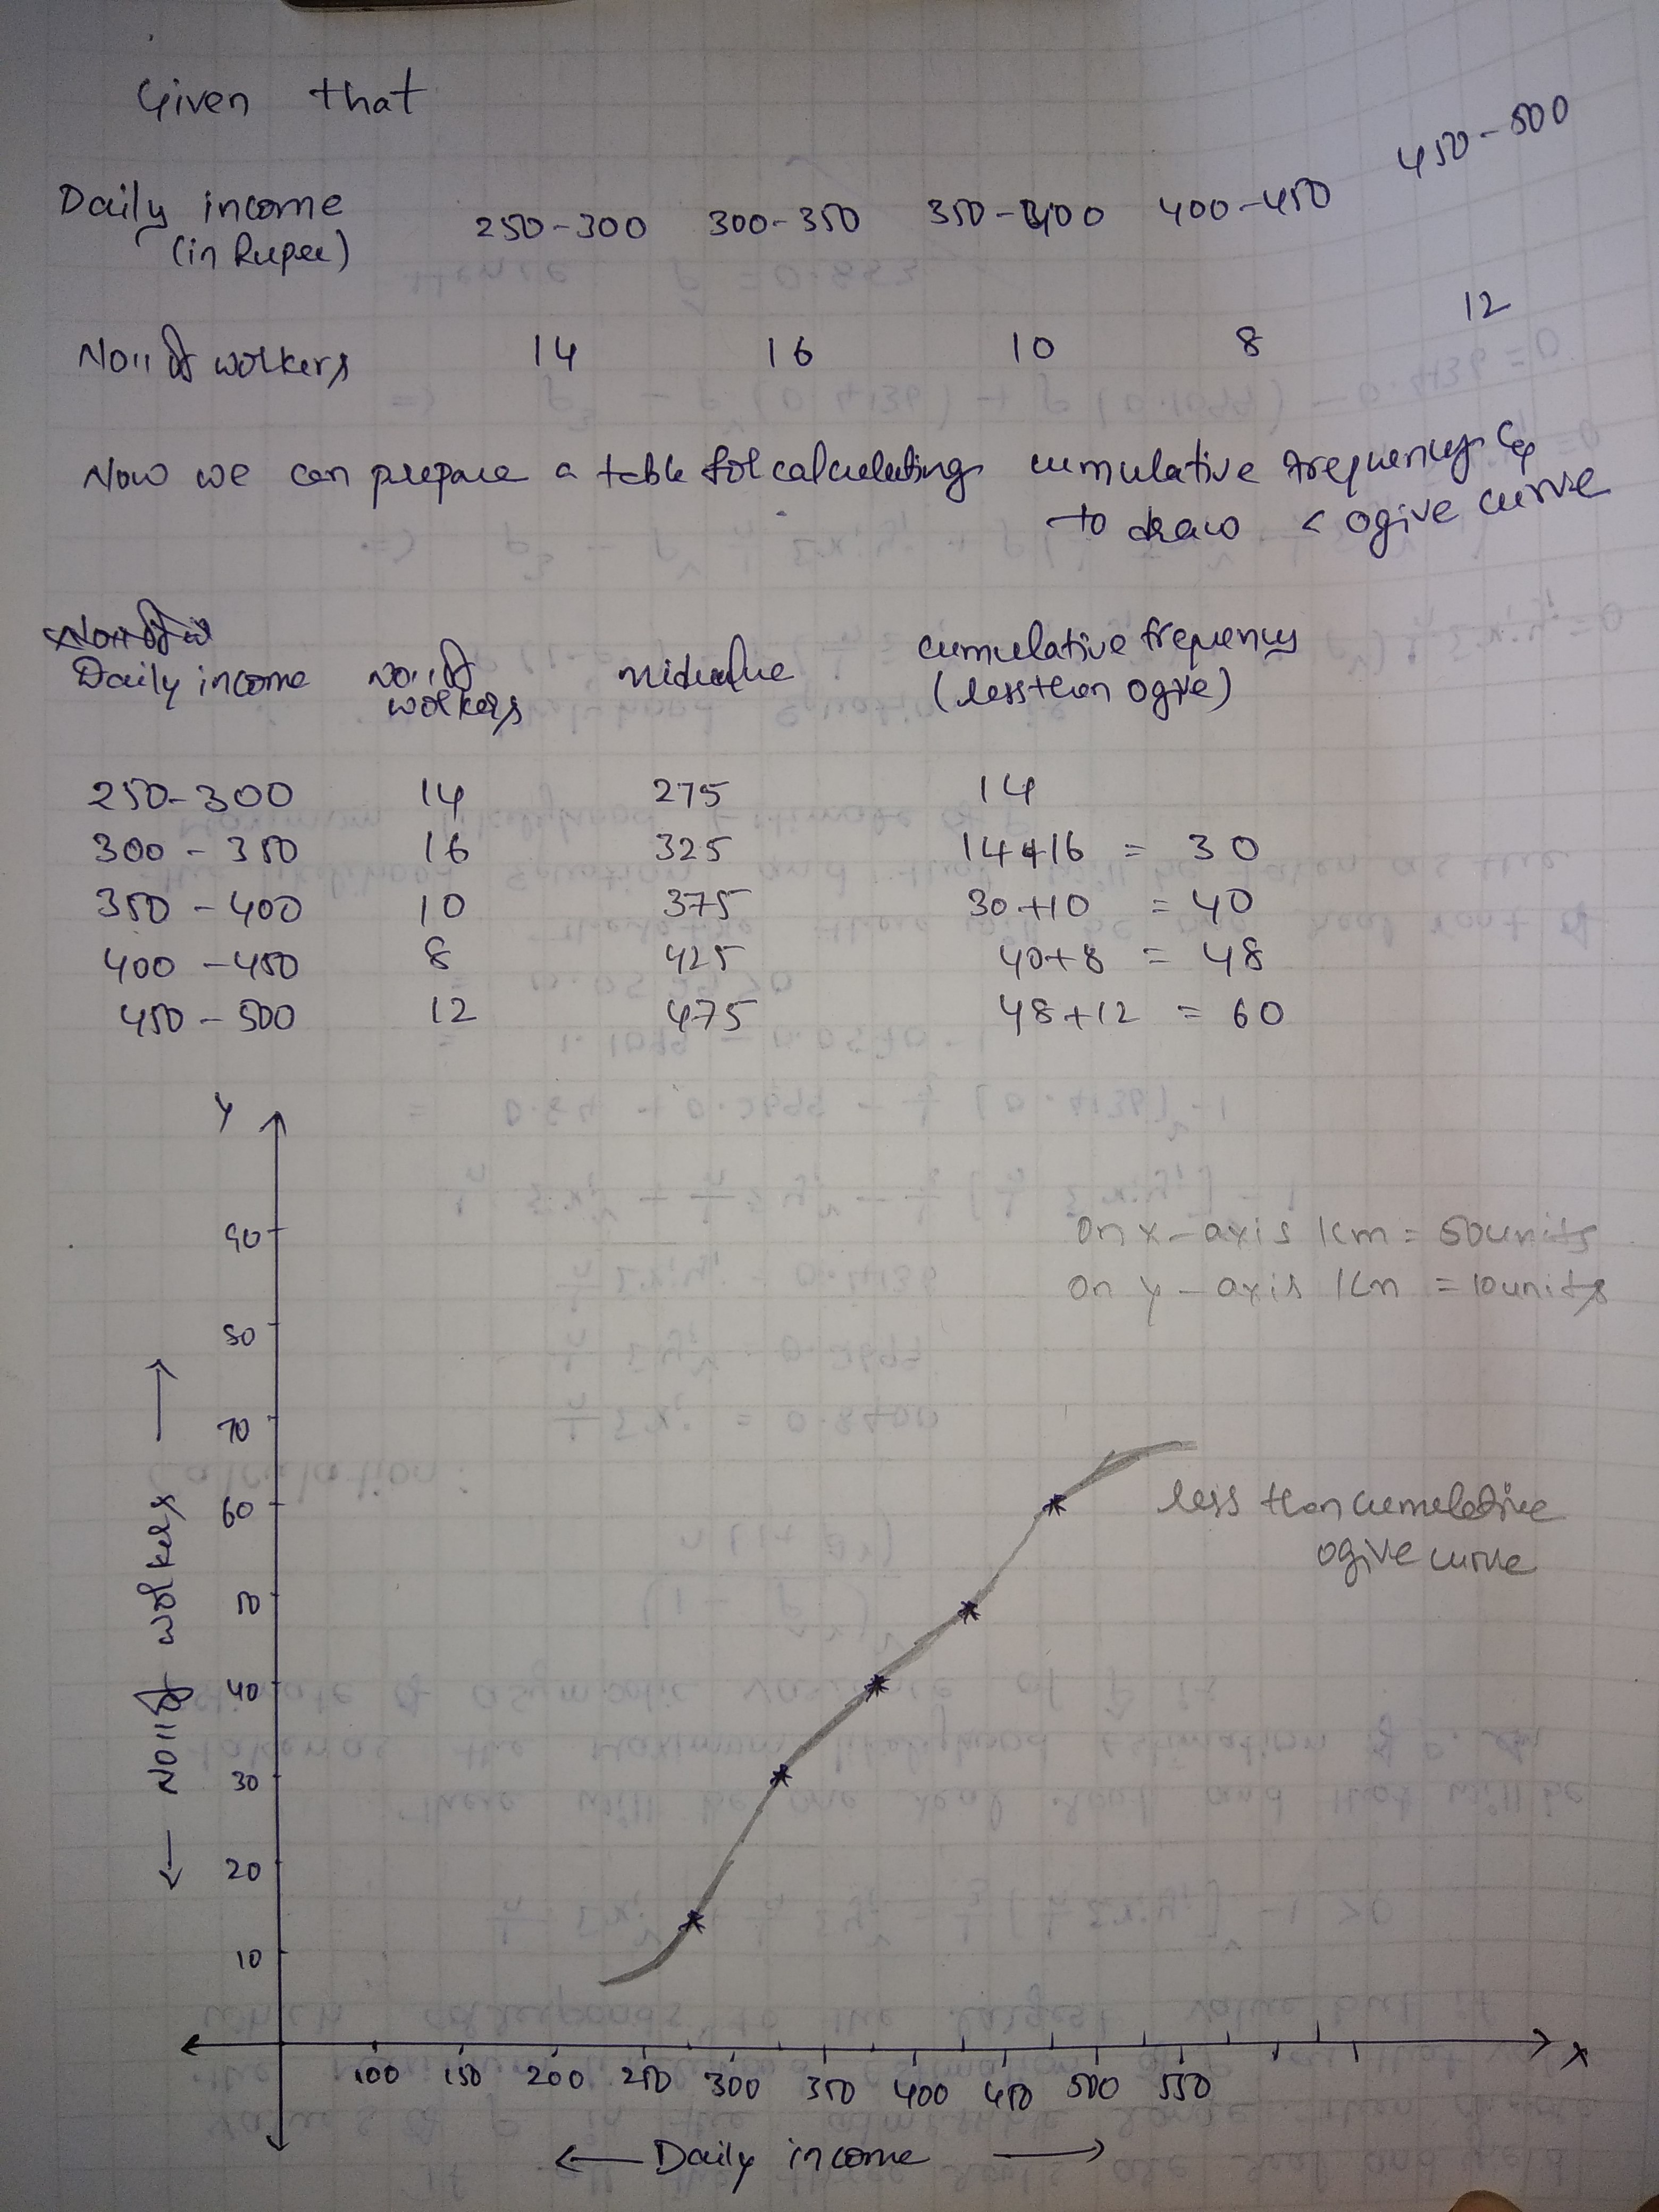
Draw less than type cumulative frequency (O give) curve for the above data.
| Daily Income (in rupee) | 250-300 | 300-350 | 350-400 | 400-450 | 450-500 |
| Number of workers | 14 | 16 | 10 | 8 | 12 |
The weights of new born babies (in kg) in a hospital on a particular day are as follows:
$$2.3,2.2,2.1,2.7,2.6,3.0,2.5,2.9,2.8,3.1,2.5,2.8,2.7,2.9,2.4$$
How many babies weigh 2.8 kg?
In a mathematics test following marks were obtained by 40 students of class VI. Arrange these marks in a table using, tally marks.
8 1 3 7 6 5 5 4 4 2
4 9 5 3 7 1 6 5 2 7
7 3 8 4 2 8 9 5 8 6
7 4 5 6 9 6 4 4 6 6
Find how many students obtained marks equal to or more than 7?
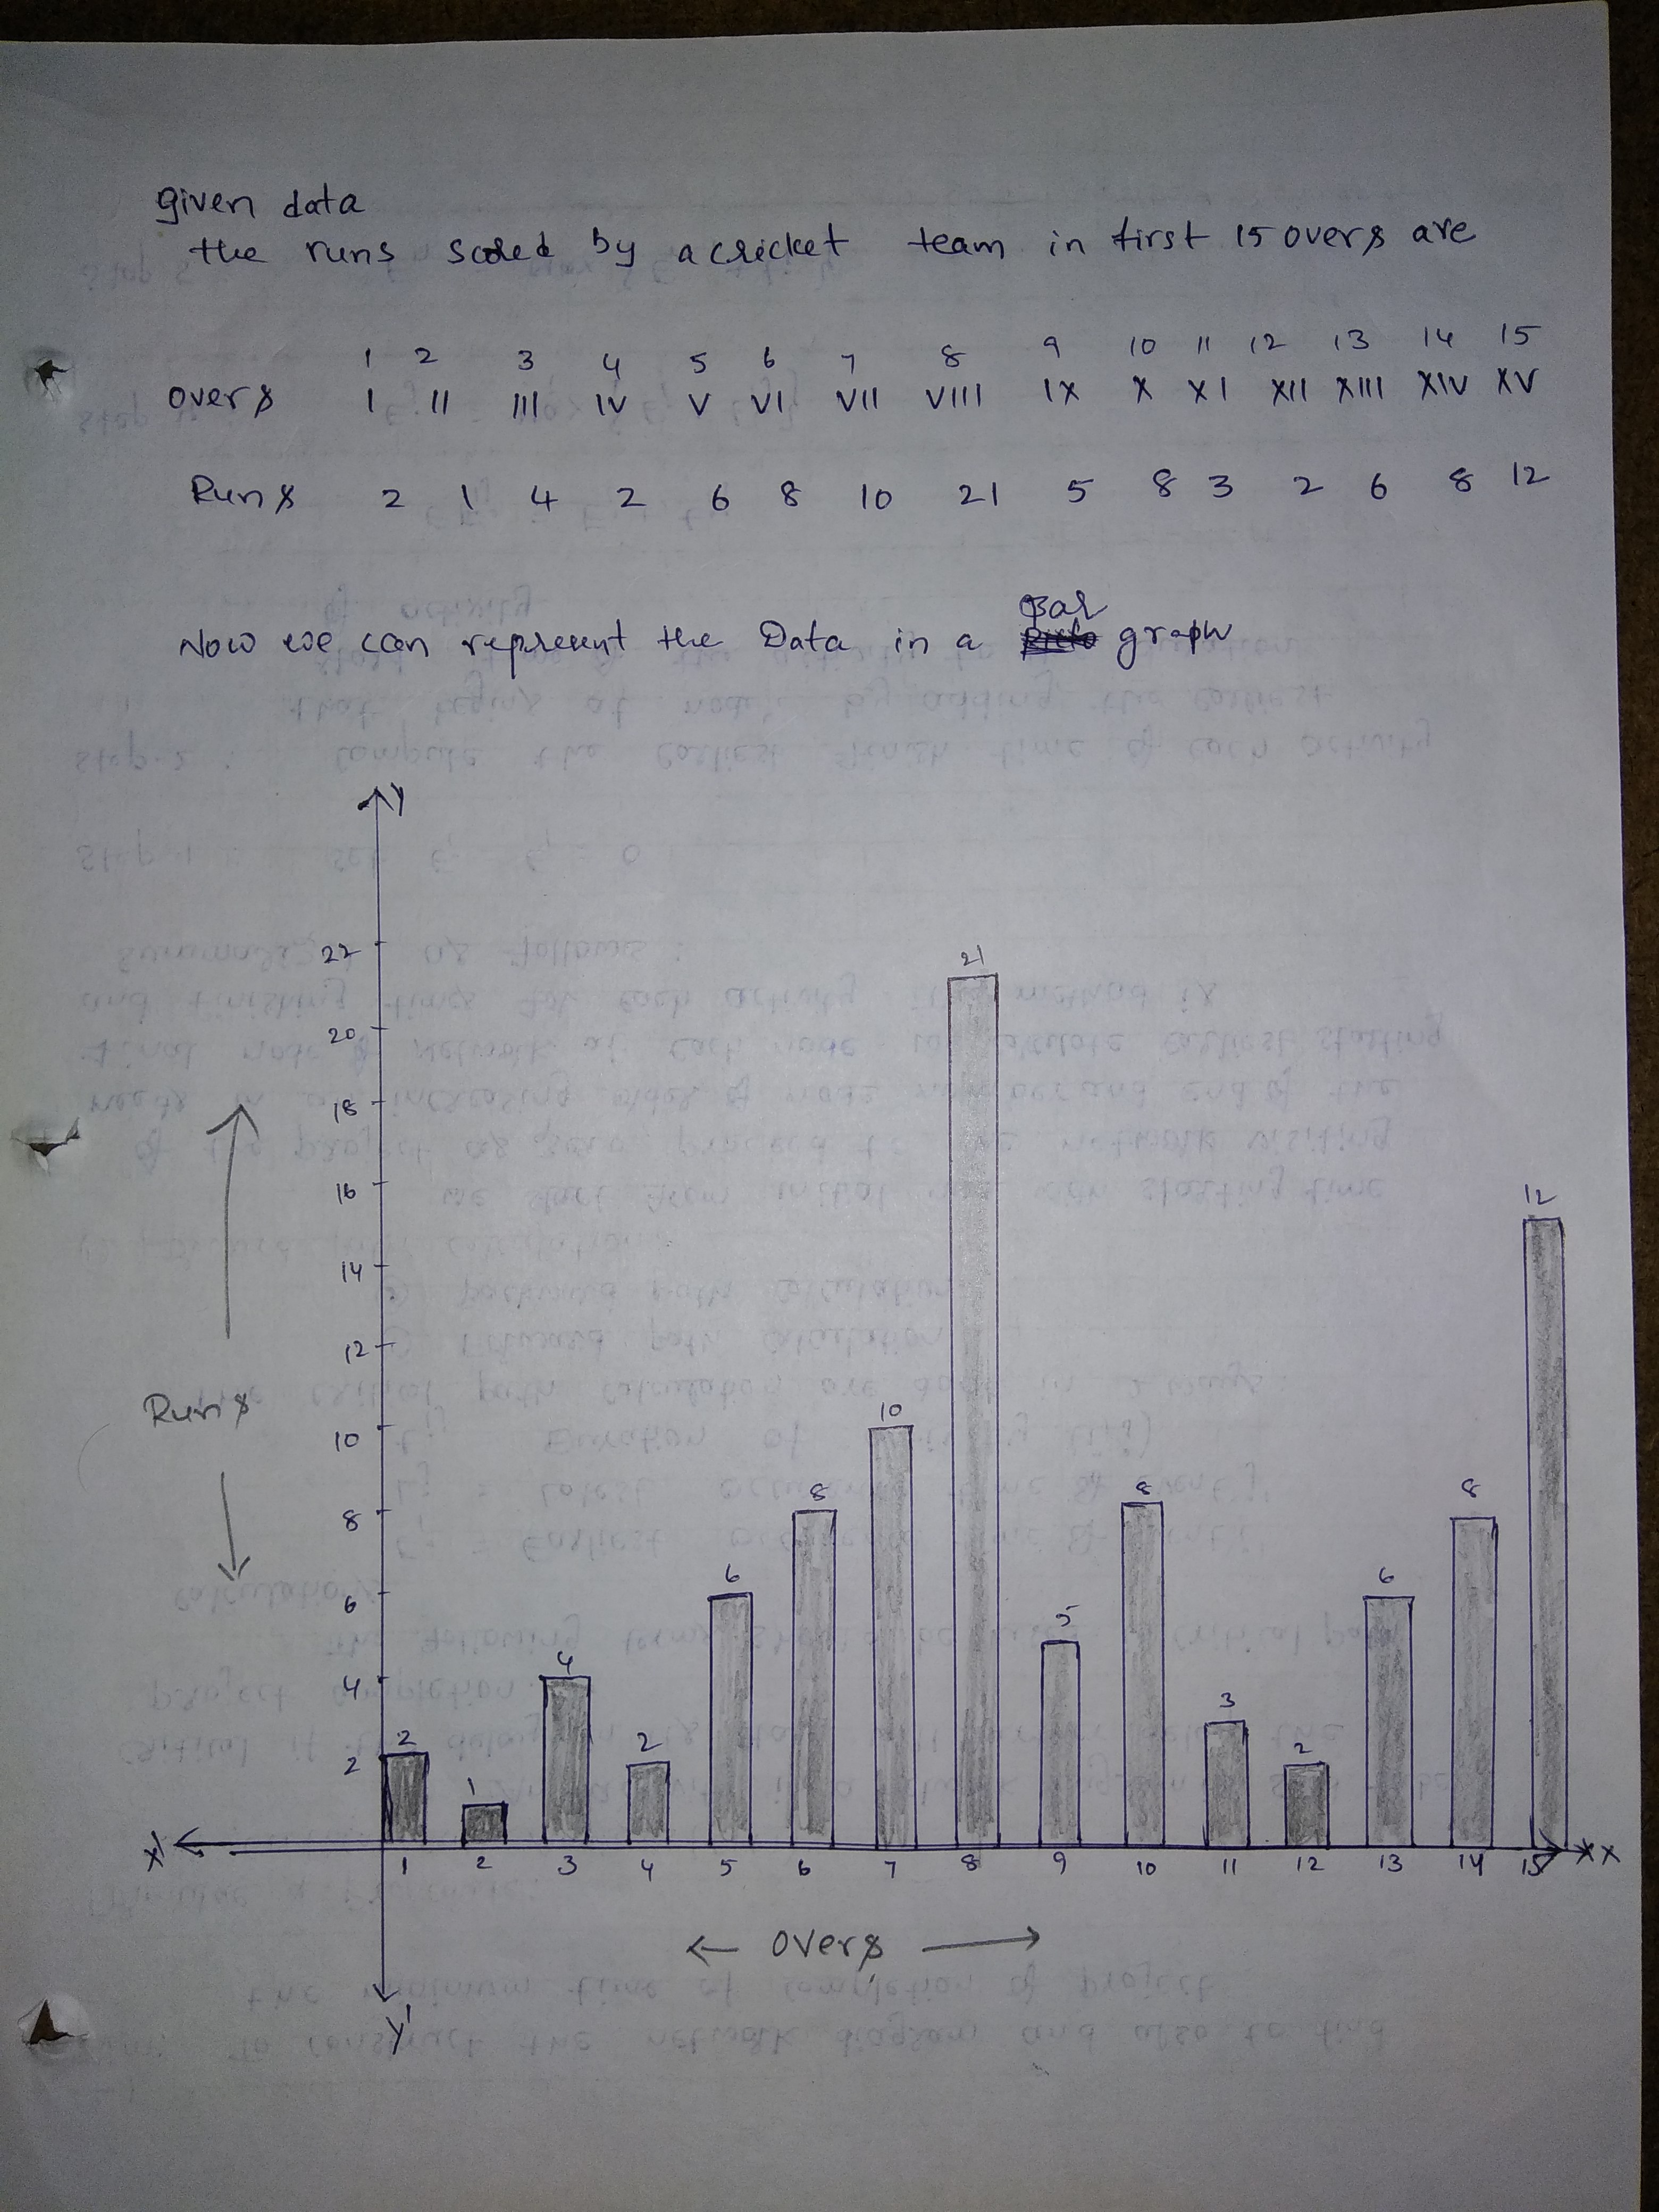
The runs scored by a cricket team in first 15 overs are given below:
| Overs: | $$I$$ | $$II$$ | $$III$$ | $$IV$$ | $$V$$ | $$VI$$ | $$VII$$ | $$VIII$$ | $$IX$$ | $$X$$ | $$XI$$ | $$XII$$ | $$XIII$$ | $$XIV$$ | $$XV$$ |
| Runs: | $$2$$ | $$1$$ | $$4$$ | $$2$$ | $$6$$ | $$8$$ | $$10$$ | $$21$$ | $$5$$ | $$8$$ | $$3$$ | $$2$$ | $$6$$ | $$8$$ | $$12$$ |
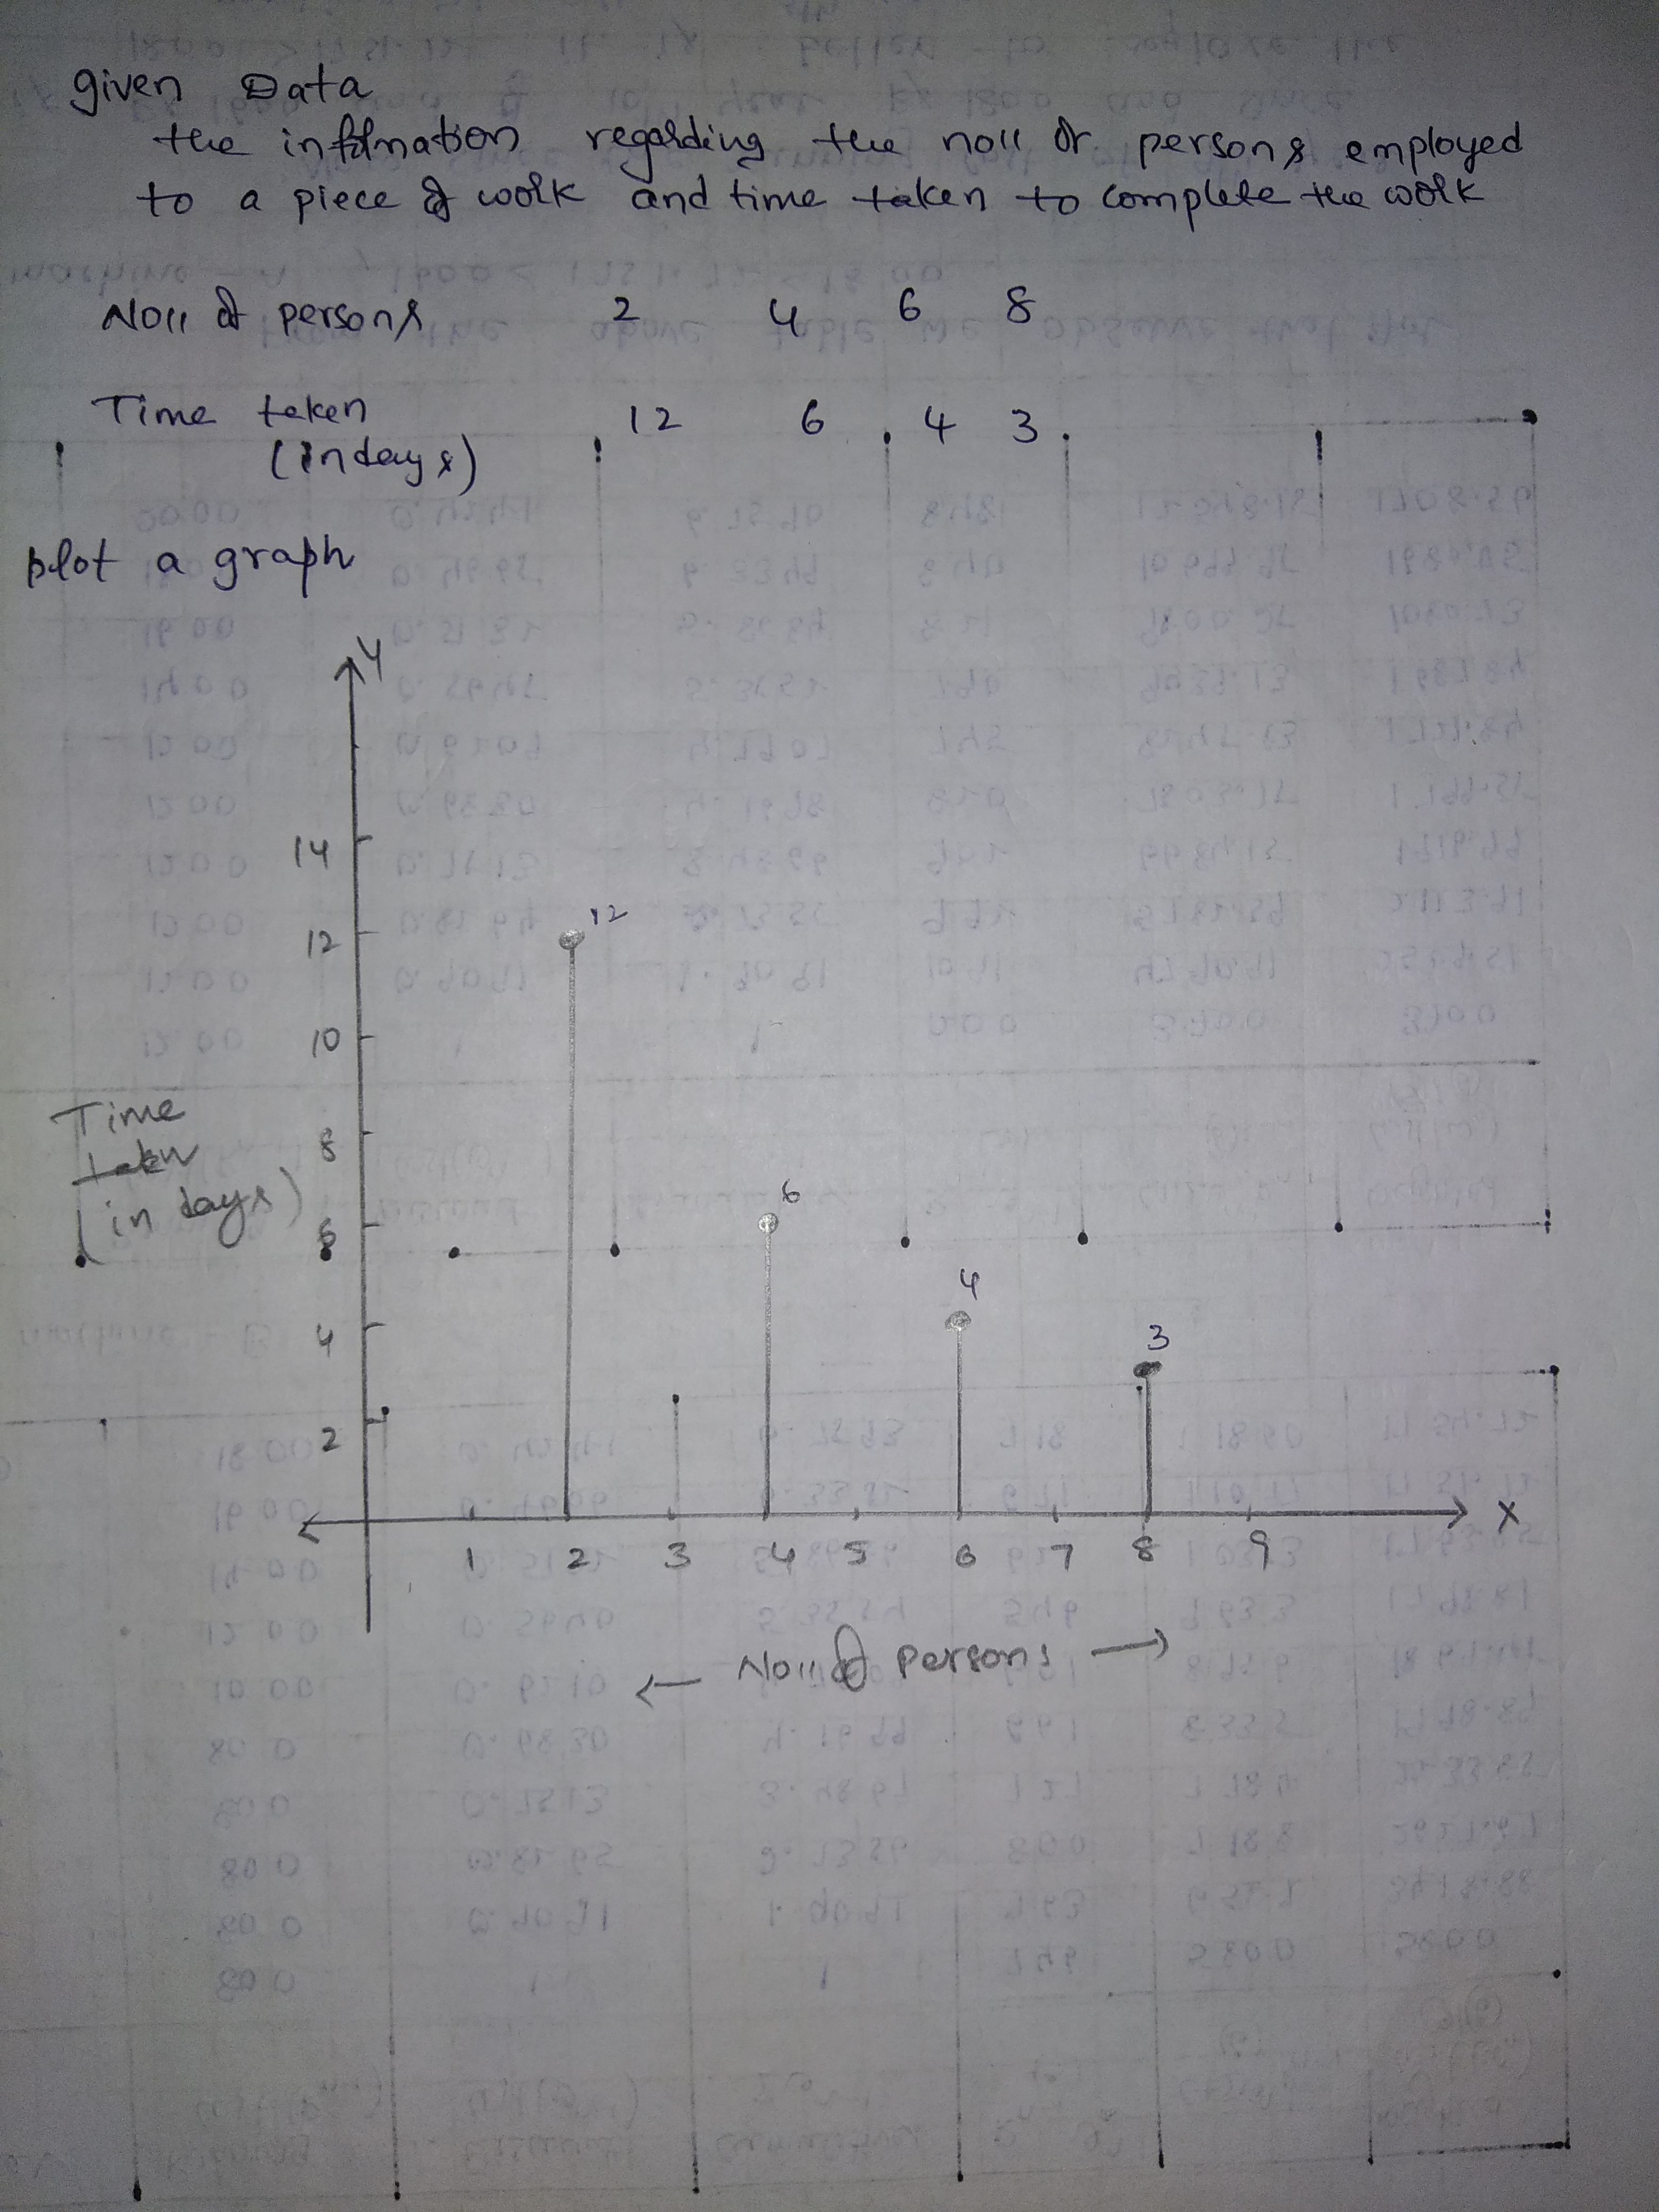
The following table gives the information regarding the number of persons employed to a piece of work and time taken to complete the work:
| Number of persons: | $$2$$ | $$4$$ | $$6$$ | $$8$$ |
| Time taken(in days): | $$12$$ | $$6$$ | $$4$$ | $$3$$ |
Read the bar graph shown in Fig. and answer the following questions: What is the ratio of the number of commercial banks in 1969 to that in 1980?
Given below (Fig.) is the bar graph indicating the marks obtained out of 50 in mathematics paper by 100 students. Read the bar graph and answer the following question:
What is the number of students belonging to the highest mark group?

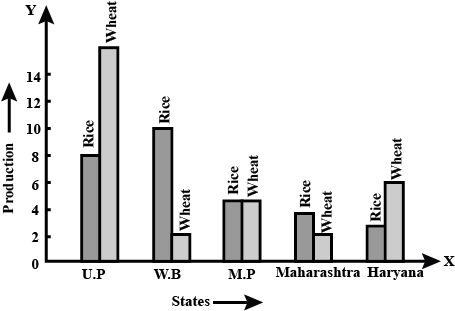
Read the following bar graph and answer the following questions:
Which state has the total production of wheat and rice minimum?

Read the following bar graph and answer the following questions:
Which state has total production of rice and wheat as its maximum?
Given below Fig. is the bar graph indicating the marks obtained out of $$50$$ in mathematics paper by $$100$$ students. Read the bar graph and answer the following question:
Every student belonging to the lowest mark-group has to solve $$5$$ problems per day. How many problems, in all, will be solved by the students of this group per day?
Given above Fig. is the bar graph indicating the marks obtained out of $$50$$ in mathematics paper by $$100$$ students. Read the bar graph and answer the following question:
Every student belonging to the highest mark group is entitled to get a prize of Rs. $$10.$$ How much amount of money is required for distributing the prize money?

The following bar graph (Fig.) represents the heights (in cm) of 50 students of Class XI of a particular school. Study the graph and answer the following questions:
What percentage of the total number of students have their heights more than 149 cm?
Sonal and Amole made a sequence of tile designs from square white tiles surrounding one square purple tile. The purple tiles come in many sizes. Three of the designs are shown below.
Copy and complete the table
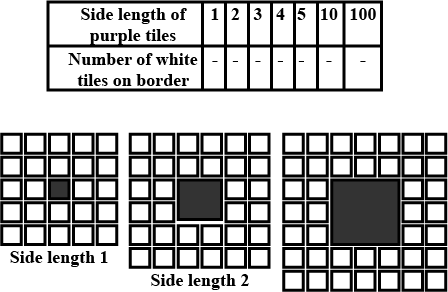
Sonal and Amole made a sequence of tile designs from square white tiles surrounding one square purple tile. The purple tiles come in many sizes. Three of the designs are shown below.
Do the points lie on line?
Let $$n$$ = side length of the purple tile
Let $$m$$ = number of white tiles on the border
Refer to the figure.
When $$n=1$$, $$m=8$$
When $$n=2$$, $$m=12$$
When $$n=3$$, $$m=16$$
Thus, it is clear that this series is in A.P. Thus, we can use formula for A.P. to find number of white tiles on border for given side length of purple tile.
$${ a }_{ n }={ a }_{ 1 }+\left( n-1 \right) d$$
1) When $$n=4$$,
$${ a }_{ 4 }=8+\left( 4-1 \right) \times 4$$
$$\therefore { a }_{ 4 }=8+12=20$$
2) When $$n=5$$,
$${ a }_{ 5 }=8+\left( 5-1 \right) \times 4$$
$$\therefore { a }_{ 5 }=24$$
3) When $$n=10$$,
$${ a }_{ 10 }=8+\left( 10-1 \right) \times 4$$
$$\therefore { a }_{ 10 }=44$$
4) When $$n=100$$
$${ a }_{ 100 }=8+\left( 100-1 \right) \times 4$$
$$\therefore { a }_{ 100 }=404$$
If we plot first five values graphically, we get a straight line as A.P. has linear relationship

Class 11 Commerce Economics Extra Questions
- Collection Of Data Extra Questions
- Correlation Extra Questions
- Index Numbers Extra Questions
- Introduction To Economics Extra Questions
- Introduction To Microeconomics Extra Questions
- Market Equilibrium Extra Questions
- Measures Of Central Tendency Extra Questions
- Measures Of Dispersion Extra Questions
- Non-Competitive Markets Extra Questions
- Organisation Of Data Extra Questions
- Presentation Of Data Extra Questions
- Production And Costs Extra Questions
- Theory Of Consumer Behaviour Extra Questions
- The Theory Of The Firm Under Perfect Competition Extra Questions
- Use Of Statistical Tools Extra Questions